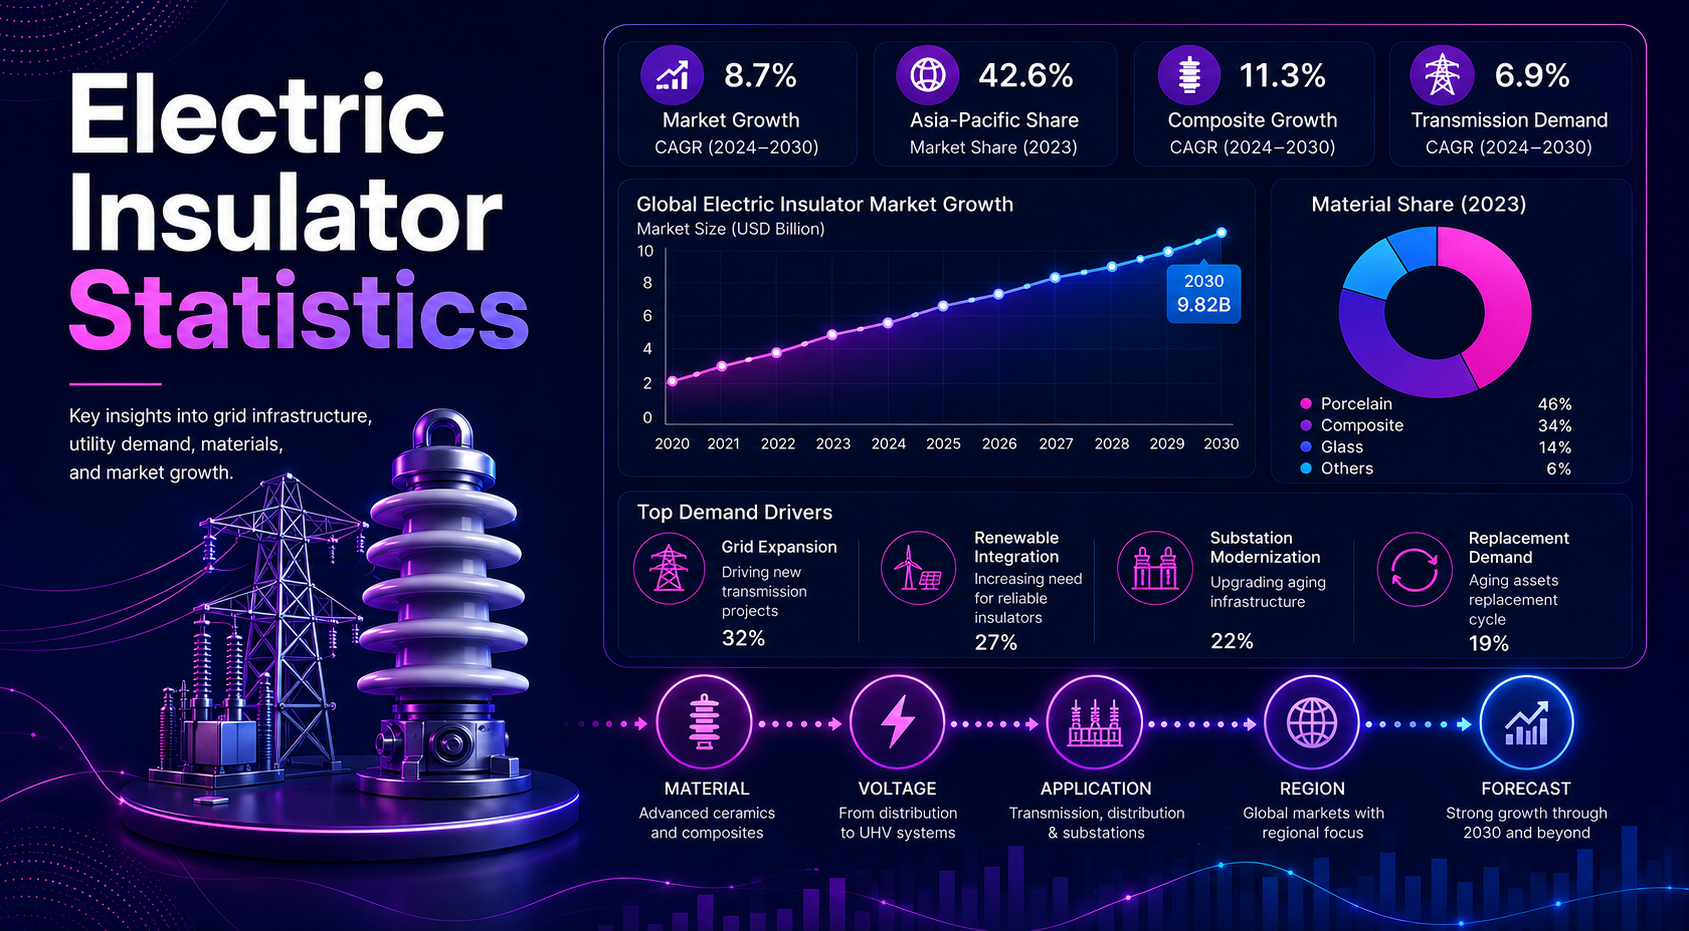
The useful way to read this market is to treat each statistic as evidence of grid activity. A country can have rising electricity demand without creating immediate insulator orders if transmission permits, substation procurement, or utility budgets are delayed. In the same way, a smaller market can create concentrated demand when one large renewable corridor, metro electrification program, or high-voltage upgrade moves from planning to construction. This article therefore separates the market into demand signals that can be measured: line construction, voltage level, material preference, regional investment, replacement cycles, and the infrastructure required to move renewable power from generation sites to customers.
Electric insulators are small components inside a much larger power-infrastructure story. They separate energized conductors from towers, poles, busbars, switchgear, transformers, railway catenary systems, and other support structures, but their market demand is created by the same forces reshaping global electricity: network buildout, renewable connection, industrial electrification, urban load growth, and replacement of aging transmission and distribution assets.
The strongest market statistics show why the category deserves its own scorecard. Spherical Insights valued the global electric insulator market at USD 13.2 billion in 2023 and forecast USD 22.4 billion by 2033. Market Data Forecast placed the Asia-Pacific electric insulator market at USD 3.26 billion in 2024 and USD 5.64 billion by 2033. Future Market Insights placed the composite insulator segment at USD 3.8 billion in 2025 and USD 7.1 billion by 2035, while IEA renewable-grid data shows 1,650 GW of advanced-stage wind, solar PV, and hydropower capacity waiting for grid connections by July 2024.
Executive Electric Insulator Benchmarks
These are the statistics that frame the market. They show the size of the opportunity, the pace of forecast growth, the role of Asia-Pacific, the importance of composite and high-voltage products, and the connection between insulator demand and grid construction.
The numbers that define the electric insulator market
• The global electric insulator market was valued at USD 13.2 billion in 2023 and is expected to reach USD 22.4 billion by 2033, according to Spherical Insights.
• The same global forecast implies a 5.4% CAGR from 2023 to 2033, keeping the market in a steady infrastructure-growth range rather than a short-cycle spike.
• Fortune Business Insights expects the electric insulator market to move from USD 17.68 billion in 2026 to USD 26.66 billion by 2034 at a 5.3% CAGR.
• Maximize Market Research valued the market at USD 14.38 billion in 2024 and projected USD 22.92 billion by 2032 at a 6% CAGR.
• Asia-Pacific electric insulator market value was estimated at USD 3.26 billion in 2024 and forecast to reach USD 5.64 billion by 2033.
• India electric insulator estimates show 2023 values around USD 411 million to USD 424 million, making it a high-interest country within Asia-Pacific demand.
• Composite insulators are projected from USD 3.8 billion in 2025 to USD 7.1 billion by 2035, indicating stronger growth for polymer-based applications.
• The high-voltage electric insulator market is estimated at USD 2.1 billion in 2025 and forecast to approach USD 3.8 billion by 2035.
• IEA renewable-grid data shows 1,650 GW of advanced-stage wind, solar PV, and hydropower capacity waiting for grid connections by July 2024.
• Energy-transition grid estimates put global grid length near 68 million km in 2023, with a possible need for 110 million to 200 million km by 2050.
• The transmission line market is estimated at USD 113.34 billion in 2025 and USD 181.53 billion by 2034, showing the scale of adjacent infrastructure demand.
• Market demand is strongest where utilities are expanding high-voltage corridors, replacing aging assets, connecting renewables, and modernizing substations.
Why Electric Insulators Now Carry Grid-Scale Stakes
Electric insulators become more important when the power grid grows longer, denser, cleaner, and more complex. A new transmission line does not only require conductors and towers. It also requires reliable insulation at every support point where electrical energy must be kept away from grounded structures. The same logic applies to substations, distribution feeders, renewable interconnections, rail electrification, industrial power systems, and grid hardening programs.
Grid expansion and electrification benchmarks
• Global grid length is estimated around 68 million km in 2023, creating a large installed base for inspection, maintenance, and replacement demand.
• Long-term energy-transition estimates suggest global grids may need to reach 110 million to 200 million km by 2050, depending on electrification and network design assumptions.
• IEA data shows advanced-stage renewable projects waiting for grid connection increased from about 1,500 GW in 2023 to 1,650 GW by July 2024.
• Transmission and distribution assets are the bridge between renewable generation and power users, making grid equipment a bottleneck for energy-transition delivery.
• The global transmission line market is estimated at USD 113.34 billion in 2025 and projected to reach USD 181.53 billion by 2034.
• Europe transmission line market value is estimated at USD 22.64 billion in 2025, reflecting renewable integration, cross-border grid needs, and grid modernization.
• North America transmission investment is linked to aging grids, renewable interconnection queues, data center load growth, and electrification of transport and heating.
• Grid investment creates demand for overhead line insulators, substation post insulators, equipment bushings, polymer housings, and specialized insulation systems.
A market view that ignores grid expansion will understate the importance of insulators. They are not a standalone purchase in most utility budgets. They are purchased when utilities, EPCs, industrial operators, rail operators, and renewable developers build or upgrade power infrastructure.
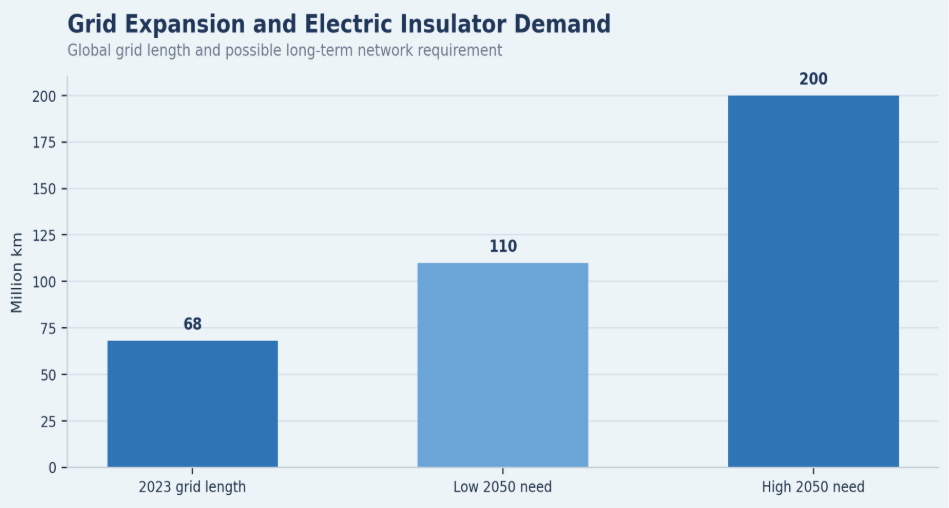
Figure 1. Electric insulator demand should be reviewed alongside grid expansion because insulators are purchased as part of larger transmission, distribution, substation, and renewable-connection projects.
Global Electric Insulator Market Size and Forecast
The market forecast is best read as a range rather than a single fixed number because market research providers define the category differently. Some include a broad set of electrical insulators across transmission, distribution, and equipment applications. Others focus on high-voltage products, composite products, ceramic products, or electric insulators used in specific grid segments. The direction is consistent even when definitions differ: the market is expected to grow with grid modernization, renewable integration, utility spending, and replacement demand.
Market-size and forecast benchmarks
• Spherical Insights reported USD 13.2 billion in 2023 and USD 22.4 billion by 2033 for the global electric insulator market.
• The Spherical Insights forecast implies a 5.4% CAGR across the 2023 to 2033 period.
• Fortune Business Insights reported an expected rise from USD 17.68 billion in 2026 to USD 26.66 billion by 2034.
• Maximize Market Research valued the market at USD 14.38 billion in 2024 and projected USD 22.92 billion by 2032.
• GMI Insights reported a smaller scoped electric insulators market value of USD 5.9 billion in 2024 with a 5.9% CAGR outlook through 2034.
• Grand View Research reported the high-voltage insulator market at USD 1.99 billion in 2023 and a 5.2% CAGR outlook from 2024 to 2030.
• Future Market Insights reported the composite insulator market at USD 3.8 billion in 2025 and USD 7.1 billion by 2035.
• Different market scopes explain why absolute values vary, while the underlying growth story remains linked to transmission, distribution, utility upgrade programs, and renewable connection.
| Market scope | Current value | Forecast | CAGR |
|---|---|---|---|
| Global electric insulator market | 2023: USD 13.2B | 2033: USD 22.4B | 5.4% |
| Electric insulator market | 2026: USD 17.68B | 2034: USD 26.66B | 5.3% |
| Electric insulator market | 2024: USD 14.38B | 2032: USD 22.92B | 6.0% |
| Composite insulator segment | 2025: USD 3.8B | 2035: USD 7.1B | 6.5% |
| High-voltage insulator market | 2023: USD 1.99B | 2030: Forecast growth | 5.2% |
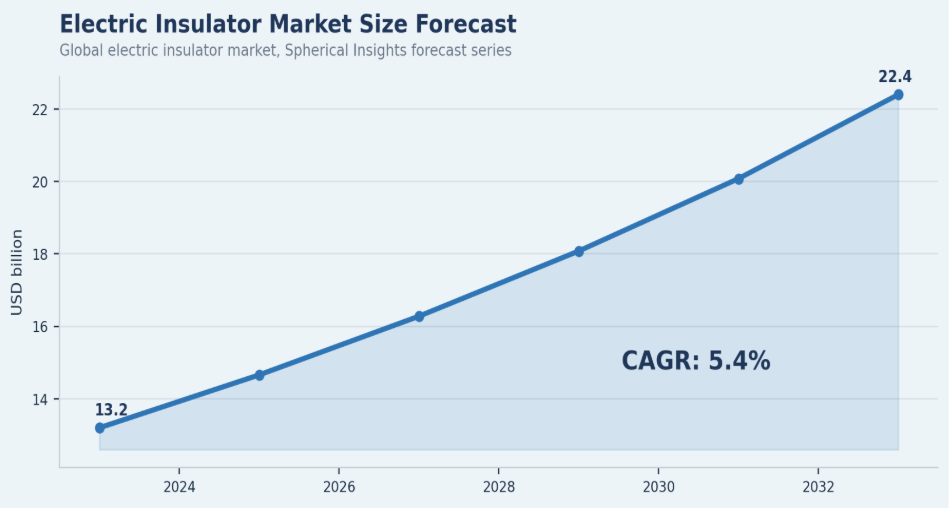
Figure 2. Electric insulator market forecasts vary by scope, but the consistent direction is growth from network buildout, renewable connection, and utility upgrade programs.
Where Electric Insulator Demand Starts Building
Demand also builds at different speeds. New transmission corridors can produce large but lumpy orders because tower hardware, suspension strings, and station equipment are purchased around project milestones. Distribution upgrades are usually smaller but more continuous, especially in urban networks, industrial clusters, and rural reliability programs. Replacement demand sits between those two patterns: it can be planned through inspection cycles, but storms, contamination, flashover events, and equipment failures can pull purchases forward. Separating these demand types makes the statistics more useful for manufacturers, utilities, EPC contractors, and market analysts.
Total market size is useful, but it does not explain where demand comes from. Electric insulator demand starts building when a utility adds line length, raises voltage, modernizes a substation, hardens a grid against weather, connects renewable projects, expands a distribution feeder, or replaces aging assets. Each demand source uses different product types and creates a different purchase cycle.
Demand drivers worth separating
• New transmission corridors create demand for suspension, strain, long-rod, disc, and line-post insulators across high-voltage overhead networks.
• Distribution upgrades create recurring demand for pin, post, shackle, and line-post insulators across local feeders and rural networks.
• Substation modernization creates demand for post insulators, equipment insulation, switchgear support, and busbar insulation.
• Renewable grid connections create medium-voltage and transmission-voltage demand at solar farms, wind plants, collector systems, substations, and evacuation lines.
• Aging-grid replacement creates recurring demand when porcelain, glass, or polymer insulators are damaged, contaminated, cracked, flashed over, or no longer aligned with reliability standards.
• Industrial electrification adds demand from factories, refineries, mines, data centers, ports, and heavy power users that require reliable medium- and high-voltage systems.
• Railway electrification adds demand for catenary and traction power insulation, especially in countries expanding metro, high-speed rail, and electrified freight networks.
• Polluted, coastal, desert, icy, or storm-prone environments increase interest in materials and designs that improve contamination performance and reduce maintenance.
| Demand type | Primary metric | Likely market owner |
|---|---|---|
| New transmission | Line-km additions and high-voltage projects | Utilities, EPCs, grid operators |
| Distribution upgrades | Feeder expansion and reliability programs | Distribution utilities |
| Renewable connection | Solar/wind interconnection capacity | Renewable developers, utilities |
| Substation modernization | Substation CAPEX and switchgear upgrades | Utilities, industrial operators |
| Replacement demand | Asset age, failure rates, inspection results | Utility maintenance teams |
Electric Insulator Market by Material
Material choice is often a practical utility decision rather than a simple technology trend. Porcelain remains attractive where long operating records, mechanical strength, and existing maintenance knowledge matter. Glass can be favored where visual inspection helps field crews identify damage quickly. Composite and polymer units are useful when lower weight, easier installation, contamination resistance, or reduced maintenance is a priority. In harsh environments, the decision may also depend on salt fog, dust, ultraviolet exposure, industrial pollution, rainfall, temperature swings, and the mechanical load carried by each tower or support structure.
Material choice is one of the most important market segmentation points because utilities do not buy insulators only by price. They compare operating history, mechanical strength, dielectric performance, pollution behavior, weight, installation labor, inspection needs, and long-term maintenance. Porcelain, glass, and composite/polymer products each have a defensible position, and the market is best explained as a performance-based mix rather than a simple substitution trend.
Material-performance and adoption benchmarks
• Porcelain insulators remain important because utilities value proven strength, long operating history, and familiarity across substations and overhead lines.
• Glass insulators remain useful where visual inspection, dielectric performance, and transmission-line applications support continued use.
• Composite and polymer insulators are growing because they are lighter, easier to install, and often better suited to polluted, coastal, or contamination-prone environments.
• Future Market Insights places the composite insulator market at USD 3.8 billion in 2025 and USD 7.1 billion by 2035, indicating stronger growth than some broader market averages.
• Silicone rubber housings and fiberglass cores support polymer insulator demand in applications where hydrophobicity and weight reduction matter.
• Ceramic and porcelain products retain demand in substations, industrial equipment, and utility networks where durability and thermal performance are prioritized.
• Material substitution is likely to be project-specific because utilities balance lifetime performance, qualification history, handling cost, and grid reliability standards.
• Harsh-environment grids can favor composite or coated designs because contamination, salt fog, desert dust, moisture, and industrial pollution can influence flashover risk.
| Material | Key strength | Common use | Market direction |
|---|---|---|---|
| Porcelain | Proven strength and durability | Substations and overhead lines | Stable utility demand |
| Glass | Visual inspection and dielectric performance | Transmission lines | Region-specific demand |
| Composite/Polymer | Lightweight and contamination resistant | High-voltage and harsh environments | Strong growth opportunity |
| Ceramic | Heat and electrical reliability | Industrial and power equipment | Steady specialist demand |
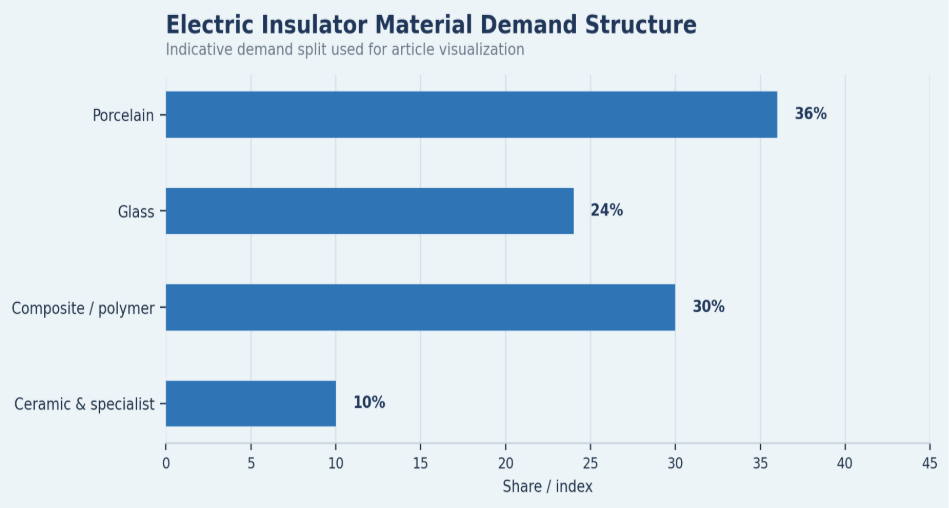
Figure 3. Material demand should be read through performance needs, because utilities choose insulators based on voltage, contamination exposure, weight, installation conditions, and operating history.
Electric Insulator Market by Voltage Level
Voltage level changes the market story because low-voltage, medium-voltage, high-voltage, extra-high-voltage, and ultra-high-voltage systems use different products, face different reliability standards, and follow different project cycles. Large transmission projects receive attention because they are capital intensive, but distribution and medium-voltage systems can create large recurring demand through urbanization, industrial growth, EV charging, and reliability programs.
Voltage-level benchmarks
• High-voltage insulator demand is tied to long-distance transmission, bulk power transfer, renewable evacuation, and interregional grid corridors.
• Grand View Research valued the high-voltage insulator market at about USD 1.99 billion in 2023 and expected a 5.2% CAGR from 2024 to 2030.
• Future Market Insights placed the high-voltage electric insulator segment at USD 2.1 billion in 2025 and forecast about USD 3.8 billion by 2035.
• Medium-voltage insulator demand grows with distribution feeders, industrial facilities, data centers, utility upgrades, and local grid strengthening.
• Extra-high-voltage and ultra-high-voltage projects create specialized demand where mechanical loading, electrical stress, pollution, and long spans influence product specification.
• Low-voltage applications remain relevant in local distribution, building power systems, and equipment-level insulation, though they attract less market-report attention.
| Voltage level | Main infrastructure use | Demand signal |
|---|---|---|
| Low voltage | Local power systems and smaller equipment | Building and local distribution demand |
| Medium voltage | Distribution feeders and industrial facilities | Urbanization and industrial reliability |
| High voltage | Transmission lines and substations | Long-distance power transfer |
| Extra-high voltage | Bulk power transmission | Renewable evacuation and interregional grids |
| Ultra-high voltage | Large grid corridors | National-scale transmission expansion |
Electric Insulator Market by Application
Application segmentation shows how electric insulator demand connects to real infrastructure. Transmission lines, distribution networks, substations, rail electrification, renewable projects, industrial power systems, data centers, and power equipment all create demand, but they do not buy the same product mix. Application data keeps the article practical because it links statistics to the physical grid assets where insulators are installed.
Application demand benchmarks
• Transmission lines create visible transmission-voltage demand through suspension, strain, disc, long-rod, and line-post insulators.
• Distribution networks create large recurring demand because local feeders, rural lines, urban upgrades, and reliability programs use pin, shackle, post, and line-post products.
• Substations use post and equipment insulators to support busbars, switchgear, transformers, breakers, and high-voltage switching systems.
• Renewable projects require insulators in collector systems, substations, interconnection lines, and power evacuation infrastructure.
• Rail electrification uses insulators in overhead catenary systems, traction substations, and switching infrastructure.
• Industrial power users require insulation systems for high-load electrical equipment, medium-voltage networks, and specialized operating environments.
• Data centers are becoming an indirect demand driver because power reliability, dedicated substations, grid upgrades, and transmission capacity can be needed to support load growth.
• Equipment manufacturers use insulators and bushings in switchgear, transformers, breakers, surge arresters, and other grid hardware.
| Application | Insulator role | Growth driver |
|---|---|---|
| Transmission lines | Separates conductors from towers | Long-distance power transfer |
| Distribution networks | Supports local power delivery | Urban and rural grid expansion |
| Substations | Supports busbars and equipment | Grid modernization |
| Rail electrification | Supports overhead catenary systems | Transport electrification |
| Renewable projects | Enables grid connection | Solar and wind expansion |
| Industrial power | Protects high-load electrical systems | Manufacturing and heavy industry demand |
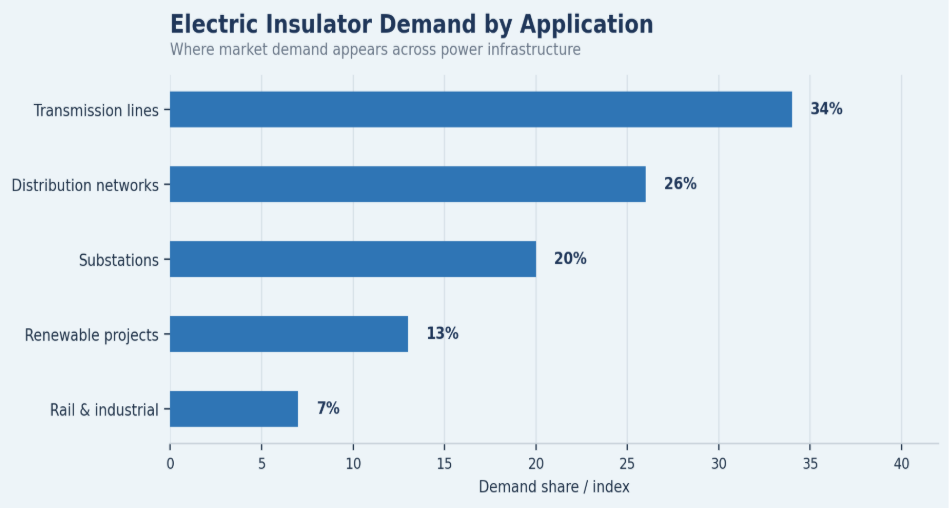
Figure 4. Transmission projects create large visible demand, while distribution, substations, and replacement cycles create recurring insulator demand.
Regional Electric Insulator Market Intelligence
Regional demand should be read through infrastructure timing. A region with strong power demand may still show uneven purchases if grid projects are delayed by permitting, financing, land access, or supply constraints. Another region may grow faster because utility procurement, manufacturing capacity, renewable project approvals, and transmission construction align at the same time. This is why regional statistics are most useful when they connect market share to grid activity, not only to population or energy consumption. The sections below separate replacement-led markets from expansion-led markets and show why country-level planning remains important.
Regional data is one of the highest-value parts of an electric insulator market review because grid cycles differ sharply by geography. Asia-Pacific is shaped by grid expansion, manufacturing scale, urbanization, electrification, and renewable integration. North America and Europe are shaped more by modernization, replacement, interconnection delays, and reliability programs.
North America
North America demand is driven by aging grid assets, renewable interconnection queues, transmission bottlenecks, utility upgrade programs, data center load growth, and electrification. The region is not only a new-build market. It is also a replacement and grid-hardening market, especially where severe weather, wildfire risk, reliability targets, and high load growth require stronger power networks.
• North America is expected to grow quickly during the forecast period because of modernization and high reliability requirements.
• The United States remains a high-interest country because renewable interconnection queues and transmission bottlenecks create demand for line and substation equipment.
• Data centers, EV charging, electrified industry, and grid resilience programs add pressure to distribution and substation infrastructure.
• Replacement demand matters because old grid components can require inspection, refurbishment, and upgrade cycles even without new line construction.
Europe
Europe demand is strongly linked to renewable integration, offshore wind connection, cross-border transmission, energy-security priorities, and grid congestion. The European market is less about simple electrification and more about reinforcing a grid that must handle decentralized generation, offshore generation, interconnector flows, and stronger local distribution requirements.
• The Europe transmission line market is estimated at USD 22.64 billion in 2025 and grows with renewable integration and grid modernization.
• Offshore wind creates demand for export infrastructure, substations, and high-voltage grid assets that rely on specialized insulation systems.
• Germany, the United Kingdom, France, Italy, Spain, the Netherlands, and Nordic markets each have different grid reinforcement priorities.
• Cross-border power flows and energy security investments add long-term relevance to transmission and substation equipment demand.
Asia-Pacific
Asia-Pacific is the strongest regional demand base in most electric insulator narratives because it combines grid expansion, urbanization, electrification, renewable integration, manufacturing capacity, and large country-level transmission programs. China and India carry particular weight, while Southeast Asia adds additional distribution, industrial, and renewable-grid opportunities.
• Asia-Pacific electric insulator market value was estimated at USD 3.26 billion in 2024 and is forecast to reach USD 5.64 billion by 2033.
• Market Data Forecast reported USD 3.47 billion for Asia-Pacific in 2025 with a 6.28% CAGR forecast through 2033.
• China’s high-voltage and ultra-high-voltage grid development supports demand for large-scale transmission insulators and substation equipment.
• India’s electrification, renewable integration, and transmission expansion support demand across both transmission and distribution networks.
Latin America
Latin America demand is project-led. Brazil’s long-distance power transfer, hydropower history, renewable development, and grid expansion make it a key regional country. Mexico, Chile, Colombia, Argentina, and Peru have market relevance where renewable resources, industrial growth, and grid upgrades require better transmission and distribution infrastructure.
Middle East and Africa
The Middle East and Africa combine two different demand patterns: Gulf utility expansion and renewable mega-projects on one side, and African electrification and grid access expansion on the other. Desert conditions, high temperatures, dust, and long transmission distances can make material performance especially important for insulator selection.
| Region | Main demand driver | Market implication |
|---|---|---|
| North America | Aging grids, renewable queues, modernization | Strong replacement and upgrade demand |
| Europe | Renewable integration and grid congestion | Transmission and substation modernization demand |
| Asia-Pacific | Grid expansion, manufacturing, urbanization | Largest demand base |
| Latin America | Renewable growth and long-distance power transfer | Project-based high-voltage demand |
| Middle East & Africa | Electrification and utility expansion | Growing demand for durable grid components |
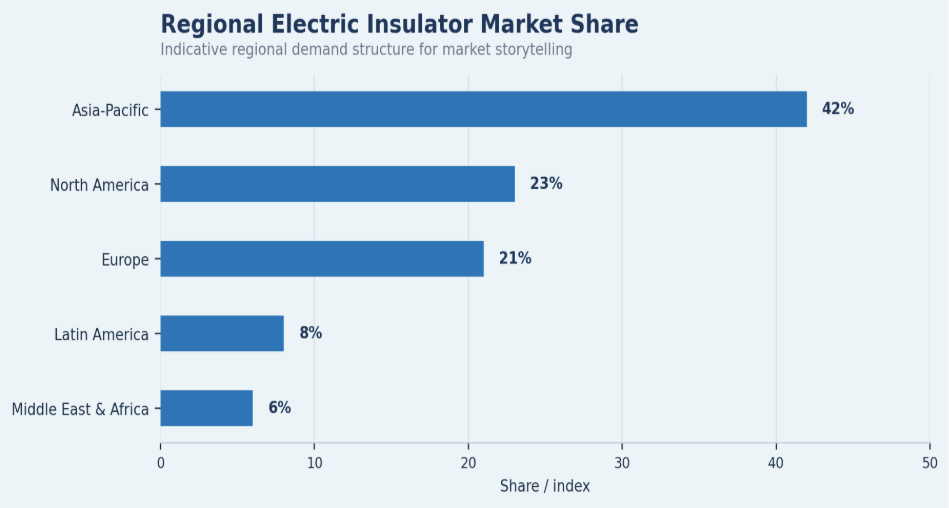
Figure 5. Regional electric insulator demand should be measured by grid investment, not only by market size, because each region has a different infrastructure cycle.
Country-Level Electric Insulator Statistics
Country-level analysis is especially important because electric insulator purchases follow actual network design. China’s ultra-high-voltage corridors, India’s distribution strengthening, the United States’ aging assets, Europe’s renewable reinforcement needs, and Gulf solar projects all create different product mixes. Some countries need long strings for overhead transmission. Others need substation post insulators, compact line designs, or pollution-resistant polymer units. For suppliers, this means opportunity is not defined only by total market size. It is also defined by voltage class, local standards, approved vendor lists, project timing, climate exposure, and whether investment is focused on new construction or replacement.
Country-level data adds depth because electric insulator demand follows grid investment more closely than GDP alone. A country building new transmission corridors has a different demand profile from a country replacing old substations, connecting offshore wind, strengthening rural networks, or expanding desert solar infrastructure. The following countries are the most useful to include in a market-statistics article because they represent different demand patterns.
• China is important because ultra-high-voltage transmission, renewable capacity growth, industrial load, and grid-scale manufacturing create large transmission-voltage demand.
• India is important because electrification, transmission expansion, renewable integration, and distribution reliability create demand across voltage levels.
• The United States is important because aging grid assets, renewable interconnection delays, and load growth from data centers and electrification create upgrade demand.
• Germany is important because renewable integration, grid reinforcement, and north-south power-transfer requirements affect transmission planning.
• The United Kingdom is important because offshore wind connection, transmission reinforcement, and grid upgrade programs create high-voltage infrastructure demand.
• Brazil is important because hydropower, renewables, and long-distance transmission corridors support high-voltage line and substation equipment demand.
• Saudi Arabia and the UAE are important because solar projects, utility expansion, desert-grid conditions, and high-temperature operating environments influence material and product selection.
• Japan and South Korea are important because reliability standards, industrial demand, and grid resilience requirements favor high-quality power components.
| Country | Grid/power driver | Electric insulator market relevance |
|---|---|---|
| China | UHV lines and renewable expansion | Large-scale high-voltage insulator demand |
| India | Electrification and T&D expansion | Transmission and distribution demand |
| United States | Aging grid and renewable queues | Replacement and modernization demand |
| Germany | Renewable transition | Grid reinforcement demand |
| United Kingdom | Offshore wind connection | Transmission and substation demand |
| Brazil | Long-distance power transfer | High-voltage line demand |
| Saudi Arabia | Solar and utility expansion | Heat-resistant grid component demand |
Renewable Energy and Grid-Connection Demand
Renewable growth changes the geography of grid demand. Solar and wind projects are often built where resources are strongest, not necessarily where electricity consumption is highest. That creates a need for collector substations, interconnection equipment, transmission extensions, switching yards, and sometimes long-distance high-voltage lines. Insulators enter the project as part of that enabling infrastructure. When renewable queues grow, the market signal is not only future generation capacity; it is also delayed demand for grid hardware that must be installed before those projects can deliver power reliably.
Renewable energy is one of the strongest long-term demand signals for electric insulators because solar and wind capacity does not become useful electricity until it is connected, transmitted, and distributed. Insulators enter the renewable supply chain through collector systems, project substations, high-voltage interconnection lines, grid reinforcement, export infrastructure, and switching equipment.
Renewable-grid benchmarks
• IEA reported 1,650 GW of advanced-stage wind, solar PV, and hydropower projects waiting for grid connections by July 2024.
• The queue increased from around 1,500 GW in 2023, showing that grid connection remains a major bottleneck even as renewables expand.
• Utility-scale solar projects require substations, interconnection lines, switching systems, and medium- or high-voltage insulation equipment.
• Onshore wind projects often need remote transmission corridors, line upgrades, and substations to move power from resource areas to demand centers.
• Offshore wind projects require export infrastructure, offshore and onshore substations, and specialized high-voltage grid equipment.
• Hybrid renewable and storage projects add grid-connection complexity because energy must flow through substations, conversion systems, and network protection equipment.
• Grid congestion and curtailment can turn infrastructure investment into a policy priority, supporting longer-term demand for transmission and substation components.
| Renewable segment | Grid requirement | Insulator demand link |
|---|---|---|
| Utility solar | Interconnection lines and substations | Medium/high-voltage insulators |
| Onshore wind | Remote transmission corridors | Overhead line insulators |
| Offshore wind | Export infrastructure and substations | Specialized high-voltage insulation |
| Energy storage | Grid connection and switching systems | Medium/high-voltage equipment insulation |
| Hybrid projects | Substations and control systems | Substation and equipment insulators |
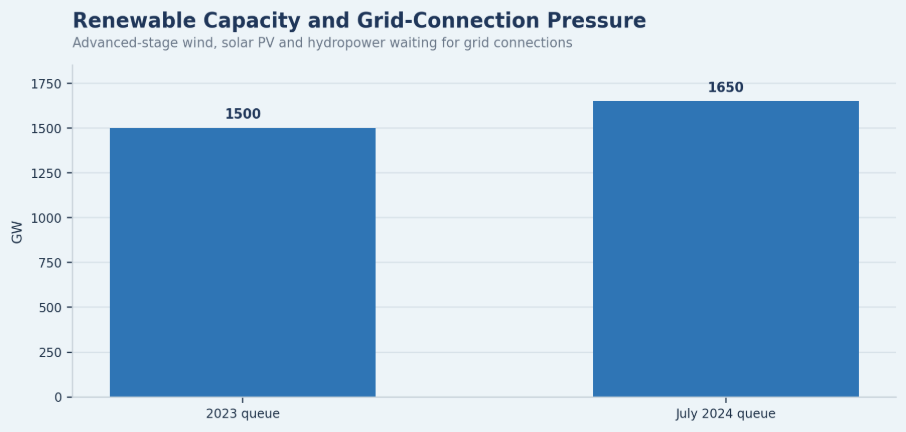
Figure 6. Renewable energy increases demand for substations, transmission corridors, and grid-connection equipment before generated power can reach customers.
Transmission, Distribution, and Substation Demand
Transmission, distribution, and substations also create different purchasing patterns. Transmission demand is closely tied to line length, voltage class, tower design, and environmental exposure. Distribution demand depends more on feeder expansion, reliability programs, city growth, and the need to reduce interruptions. Substation demand follows switching, transformation, and protection requirements. A balanced market view should track all three layers because a renewable or industrial project may require new transmission capacity, local distribution reinforcement, and substation equipment at the same time.
Transmission, distribution, and substations are the three core infrastructure categories behind most electric insulator demand. Transmission creates high-voltage line demand. Distribution creates local and recurring network demand. Substations create equipment support demand. All three are affected by electrification, renewables, reliability standards, weather exposure, urbanization, and utility capital planning.
T&D infrastructure benchmarks
• The transmission line market forecast of USD 113.34 billion in 2025 to USD 181.53 billion by 2034 shows the scale of adjacent line infrastructure investment.
• New overhead transmission lines require suspension, strain, line-post, disc, and long-rod insulators depending on line design and voltage.
• Distribution upgrades require pin, post, shackle, and line-post insulators for feeder expansion, reliability improvement, and local power delivery.
• Substation expansion requires post insulators, busbar supports, equipment insulation, and high-voltage component insulation.
• Grid hardening programs create demand for products that can withstand weather, contamination, mechanical stress, and long operating lives.
• Replacement programs create recurring demand when installed insulators age, fail inspection, suffer damage, or no longer meet performance needs.
| Infrastructure area | How it creates insulator demand |
|---|---|
| New transmission lines | Requires suspension, strain, and line-post insulators |
| Distribution upgrades | Requires pin, post, and shackle insulators |
| Substation expansion | Requires post and equipment insulators |
| Grid hardening | Requires durable and weather-resistant insulation |
| Replacement programs | Creates recurring demand from aging assets |
Electric Insulator Market by Product Type
Product type helps translate the market from broad demand into actual utility purchases. The same grid expansion trend can create different demand depending on line design, voltage, tower geometry, mechanical loading, pollution level, maintenance requirements, and substation layout. Product-type segmentation is useful because it shows what the market is likely to buy when a specific infrastructure project moves forward.
Product-type benchmarks
• Pin insulators are commonly associated with distribution lines and lower-voltage overhead systems.
• Suspension insulators are closely tied to high-voltage overhead transmission lines and long-span applications.
• Strain insulators are used where mechanical load is higher, such as dead-end towers, angle towers, and line terminations.
• Shackle insulators are used in lower-voltage distribution systems and local network applications.
• Post insulators are important in substations, switchgear, and equipment support applications.
• Line-post insulators are used in compact line designs and certain overhead distribution or transmission configurations.
• Long-rod insulators are often associated with high-voltage and composite applications where mechanical strength and pollution performance matter.
• Disc insulators remain relevant in transmission strings where modular design and voltage requirements determine string length.
| Product type | Common use | Demand driver |
|---|---|---|
| Pin insulator | Distribution lines | Local grid expansion |
| Suspension insulator | Transmission lines | High-voltage overhead systems |
| Strain insulator | Dead-end and angle towers | Mechanical load management |
| Shackle insulator | Low-voltage distribution | Local networks |
| Post insulator | Substations and switchgear | Substation modernization |
| Long rod insulator | High-voltage transmission | Composite and high-strength applications |
Manufacturing and Competitive Landscape
The supply side of the electric insulator market is quality-sensitive. Utilities usually require long operating life, technical qualification, performance testing, and reliable delivery. That means competition is shaped by more than price. Material expertise, testing capability, local production, logistics, supplier approvals, and utility relationships all affect which manufacturers can participate in high-voltage or mission-critical projects.
Supply-side benchmarks
• Asia-Pacific has a strong manufacturing role because of large domestic demand, established electrical equipment supply chains, and scale in porcelain, glass, and polymer products.
• Porcelain and glass products can carry high logistics costs because heavy units are more expensive to ship and handle than many polymer alternatives.
• Composite products require material expertise in fiberglass cores, silicone rubber housings, end fittings, sealing systems, and long-term aging performance.
• Utility qualification processes can limit suppliers because grid operators often require approved vendor status and evidence of testing history.
• Testing requirements matter most in high-voltage and harsh-environment projects because product failure can create outages, safety issues, and expensive emergency replacement.
• Raw material costs, energy costs, polymer inputs, metal fittings, and freight rates can influence pricing and margins.
| Supply factor | Market impact |
|---|---|
| Utility qualification | Limits suppliers to tested manufacturers |
| Material specialization | Separates porcelain, glass, and polymer competition |
| Regional production | Reduces logistics cost for heavy units |
| Testing requirements | Raises quality expectations |
| Raw material cost | Affects margins and pricing |
Electric Insulator Market Challenges
Another challenge is that insulator performance is judged over long operating periods, while market forecasts often focus on near-term revenue. Utilities are cautious because a low-cost component failure can create outages, maintenance expense, safety risk, and reputational damage. This makes qualification, testing, documentation, and field history important parts of the buying process. Suppliers that can combine competitive pricing with reliable performance, standards compliance, and regional service support are better positioned when utilities move from planning to procurement.
Growth forecasts do not automatically become revenue. Electric insulator demand depends on grid project execution, utility procurement timing, renewable interconnection schedules, permitting, financing, and supply-chain stability. Market challenges should be separated because a delay in transmission construction creates a different risk from material-cost inflation or product quality failure.
Challenges worth separating
• Grid project delays can push insulator demand into later periods even when long-term market fundamentals remain strong.
• Permitting and land-access delays can slow transmission corridors, substations, and renewable interconnection infrastructure.
• Raw material volatility can affect porcelain, glass, polymer, silicone rubber, metal hardware, and freight cost structures.
• Low-cost supplier competition can pressure margins, but utility qualification standards may limit purely price-driven substitution.
• Quality failures can cause outages, flashovers, emergency maintenance, penalties, and reputational damage for suppliers.
• Harsh environments such as coastal, desert, polluted, icy, or storm-prone regions require specialized material performance.
• Procurement cycles can slow revenue conversion because utilities often require technical approval, tendering, testing, and delivery milestones.
• Supply-chain disruptions can affect lead times for fittings, polymers, ceramic inputs, glass products, and transportation.
| Challenge | Why it matters |
|---|---|
| Grid project delays | Pushes demand into later periods |
| Raw material costs | Affects pricing and margins |
| Quality failures | Can cause outages and utility penalties |
| Harsh environments | Require specialized material performance |
| Procurement cycles | Slow supplier revenue conversion |
Electric Insulator Market Demand Diagnostic
A useful market diagnostic keeps the analysis focused on decision-making. Each statistic should answer a business question: where is grid infrastructure being built, upgraded, replaced, localized, or modernized?
| Demand area | Core signal to measure | Market meaning |
|---|---|---|
| New transmission | Line-km additions and high-voltage projects | Drives suspension and strain insulators |
| Distribution upgrades | Feeder expansion and reliability programs | Drives pin, post, and line-post insulators |
| Substation investment | New and upgraded substations | Drives post and equipment insulators |
| Renewable integration | Solar/wind interconnection capacity | Drives high-voltage grid equipment |
| Replacement demand | Aging assets and failure rates | Creates recurring purchases |
| Regional growth | Country grid investment | Shows where demand is concentrated |
90-Day Electric Insulator Market Research Plan
Statistics become more useful when they are translated into a research process. A practical market review can be organized into a 90-day cycle that starts with global and regional baselines, moves into country-level and infrastructure comparisons, and finishes with product, material, and supplier implications.
| Timing | What to do | Output |
|---|---|---|
| Days 1-30 | Capture market size, regional share, grid investment, and material data | Baseline market map |
| Days 31-60 | Compare country-level grid expansion, renewable integration, and utility modernization | Regional opportunity matrix |
| Days 61-90 | Review product types, voltage levels, supplier landscape, and replacement demand | Article-ready market framework |
Metrics Electric Insulator Market Analysts Should Track
The final market scorecard should be detailed enough to locate demand without becoming crowded. Analysts should track revenue forecasts, infrastructure activity, material adoption, voltage-level demand, replacement cycles, and country-level utility investment together.
| Metric | Why it matters |
|---|---|
| Global market size | Shows total revenue opportunity |
| CAGR | Shows expected growth speed |
| Regional share | Shows where demand is concentrated |
| Country grid investment | Identifies high-opportunity markets |
| Transmission line additions | Indicates high-voltage insulator demand |
| Distribution upgrades | Indicates medium-voltage and local network demand |
| Substation investment | Indicates post and equipment-insulator demand |
| Renewable interconnection capacity | Shows future grid component demand |
| Material share | Tracks porcelain, glass, and composite demand |
| Replacement rate | Shows recurring demand from aging grid assets |
Electric Insulator Market Statistics FAQ
Common questions
• What is the size of the global electric insulator market?
Spherical Insights valued the market at USD 13.2 billion in 2023 and forecast USD 22.4 billion by 2033, while other forecasts use narrower or broader insulator categories.
• What is the expected CAGR of the electric insulator market?
Most available forecasts sit in a mid-single-digit range, including 5.4% from 2023 to 2033, 5.3% from 2026 to 2034, and 6.0% from 2025 to 2032.
• Which region leads the electric insulator market?
Asia-Pacific is the strongest demand base because China and India combine grid expansion, manufacturing scale, urbanization, renewable integration, and high-voltage infrastructure development.
• Which material segment is growing fastest?
Composite and polymer insulators are gaining share because they are lightweight, contamination resistant, easier to install, and useful in harsh environments. FMI projects the segment from USD 3.8 billion in 2025 to USD 7.1 billion by 2035.
• Why are electric insulators important for renewable energy?
Solar and wind projects need substations, transmission lines, interconnection equipment, switching systems, and grid reinforcement before generated electricity can reach customers.
• What are the main applications of electric insulators?
The main applications are transmission lines, distribution networks, substations, railway electrification, renewable projects, industrial power systems, data centers, and power equipment.
• What is driving replacement demand?
Aging grids, severe weather, pollution exposure, salt fog, desert dust, UV exposure, voltage stress, mechanical loading, and utility reliability programs all support replacement demand.
Final Takeaway
The article’s statistics also show why a single global CAGR is not enough. Electric insulator demand has to be read by market layer: new transmission, local distribution, substations, renewable interconnection, product replacement, and material substitution. Each layer has a different buyer, project cycle, risk profile, and product requirement. That is why the strongest market opportunities will often appear where several signals overlap, such as renewable capacity growth, grid congestion, utility capital spending, and approved high-voltage construction.
Electric insulator market statistics point to one conclusion: the market is growing because power systems are expanding, aging, and becoming more complex at the same time. Demand comes from grid expansion, renewable-energy integration, transmission and distribution modernization, material-performance needs, and country-level infrastructure investment.
The strongest opportunities appear where those forces overlap. A country adding high-voltage transmission, connecting renewable projects, modernizing substations, and replacing aging distribution assets can create several layers of insulator demand at once. Asia-Pacific shows expansion-led demand, while North America and Europe show modernization and replacement pressure.
For manufacturers, suppliers, and analysts, the next step is to track where grid construction is happening, which voltage levels are expanding, which materials utilities prefer, and which countries are turning electrification goals into real transmission and distribution projects.


