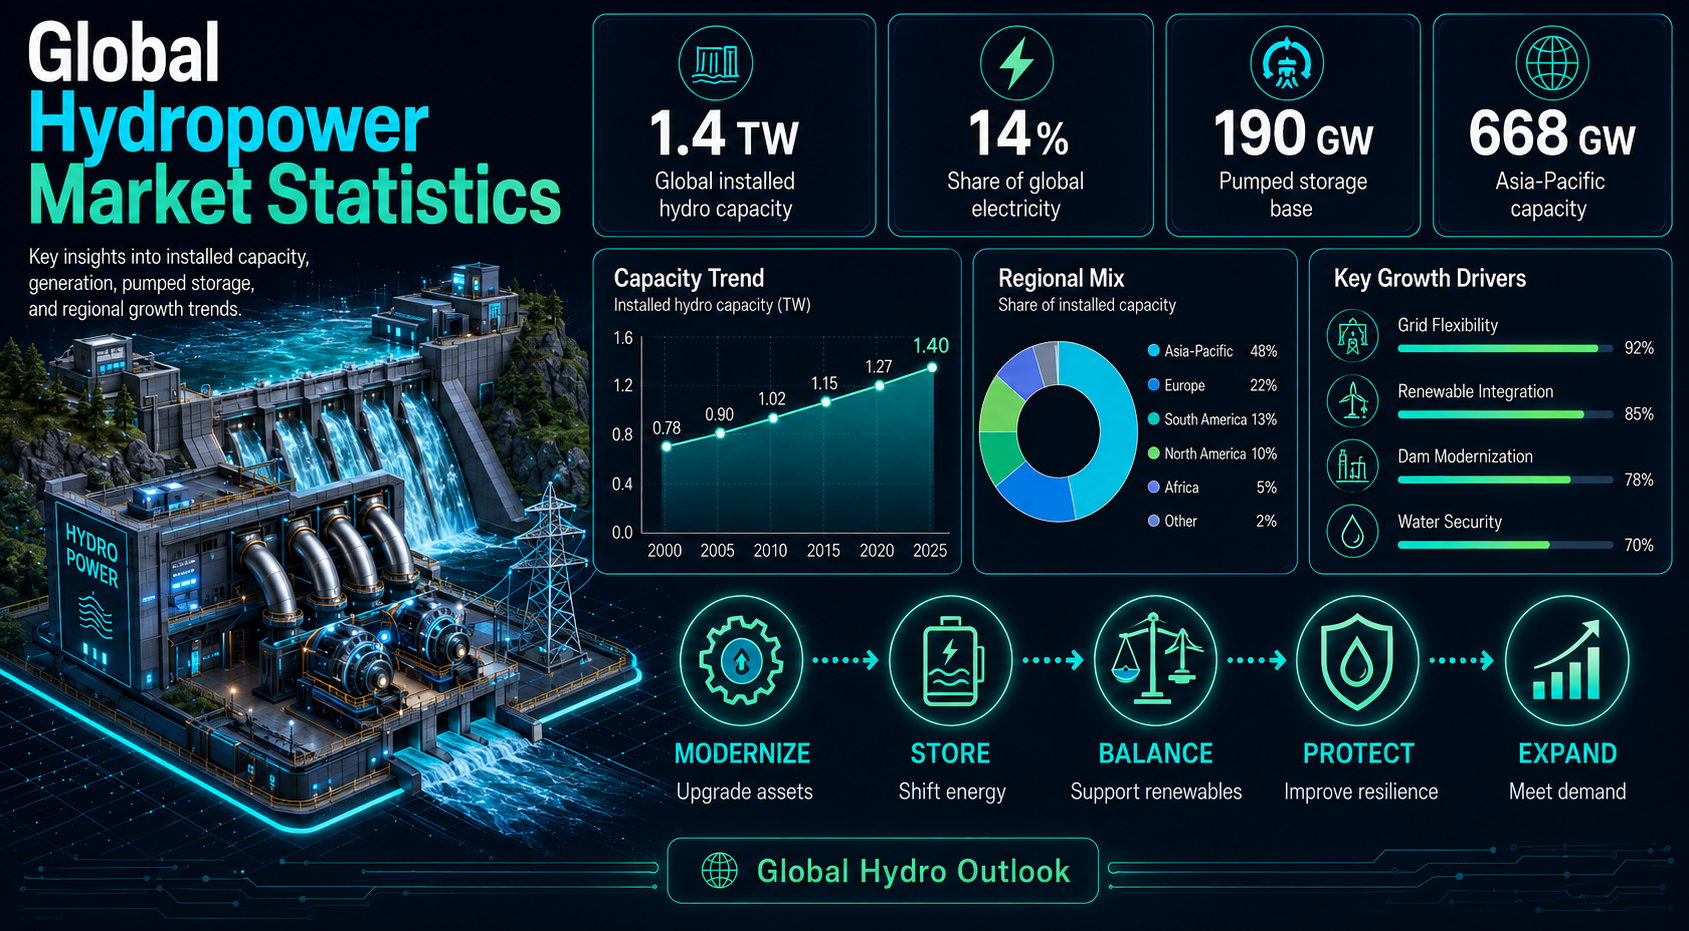
Hydropower remains one of the world’s largest renewable electricity systems. It is older than modern solar and wind markets, but it still supplies major renewable generation, supports grid reliability, and anchors electricity systems in countries where rivers, reservoirs, and pumped storage shape power planning.
The market is also changing. Hydropower is no longer only a conversation about large dams and installed megawatts. The sector now includes pumped storage, modernization of aging assets, climate-risk planning, environmental compliance, small hydro, and country-level energy security.
global capacity, annual generation, pumped storage, regional growth, country-level dependence, investment signals, climate pressure, modernization needs, and planning metrics.
Executive Hydropower Benchmarks
These headline statistics frame the market. They show the scale of installed infrastructure, the importance of annual generation, the rise of pumped storage, and the difference between hydropower as capacity and hydropower as delivered electricity.
The numbers that define the hydropower market
- IRENA capacity statistics show global hydropower capacity reached 1.46 million MW in 2025, up from 1.36 million MW in 2021.
- Global hydropower capacity rose by about 28.7 GW between 2024 and 2025 in the latest reported capacity data.
- IEA reports hydropower generated around 4,500 TWh of electricity in 2024.
- IEA also places hydropower at about 14% of global electricity generation in 2024, keeping it among the largest power-generation sources worldwide.
- IHA reported 24.6 GW of new hydropower capacity in 2024, split between 16.2 GW of conventional hydropower and 8.4 GW of pumped storage.
- IRENA’s 2026 capacity highlights show pure pumped storage hydropower at 160 GW at the end of 2025, while IHA reports a broader pumped storage hydropower base of 189 GW in 2024 depending on classification.
- Asia reached 668.3 GW of hydropower capacity in 2025 in the latest reported capacity data, making it the largest regional base in the data.
- Africa reached 48.9 GW in 2025, after rising from 37.5 GW in 2021.
- China reached 448.0 GW of hydropower capacity in 2025, making it the largest country-level capacity market in the latest reported capacity data.
- India reached 56.3 GW in 2025, while Japan recorded 50.1 GW.
- Ethiopia recorded 9.2 GW in 2025 and remains one of Africa’s most important hydropower growth stories.
- IEA expects more than 150 GW of new hydro capacity to come online by the end of the decade, mostly in emerging and developing economies.
- IEA expects hydropower generation to increase by about 7% between 2025 and 2030, even as hydro’s share of global generation is likely to edge down because solar and wind are growing faster.
Why Hydropower Still Carries Global Energy Weight
Hydropower still matters because it combines renewable electricity with operational value. Solar and wind can scale quickly where resources are strong, but reservoir hydropower can also deliver dispatchable output, spinning reserve, and flexibility when demand is high.
Market-size figures are useful because small performance changes matter at large scale. A single percentage-point improvement in output, availability, or storage use can affect power reliability, fuel displacement, and revenue in hydro-heavy markets.
Market-scale and renewable-system benchmarks
- Global installed hydropower capacity reached 1,455.6 GW in 2025 in the latest reported capacity data.
- Hydropower generated around 4,500 TWh in 2024, according to IEA’s hydropower overview.
- Hydropower supplied about 14% of global electricity in 2024, according to IEA.
- Renewables collectively supplied about one-third of global electricity in 2024, with hydro still the largest renewable electricity source in IEA’s global review.
- IHA reported global hydropower capacity growth of 24.6 GW in 2024.
- IRENA reported total hydropower capacity of roughly 1,456 GW at the end of 2025 when pure pumped storage is included.
- The global hydropower base is slower-growing than solar and wind, but it provides dispatchability and storage value that variable renewables cannot provide alone.
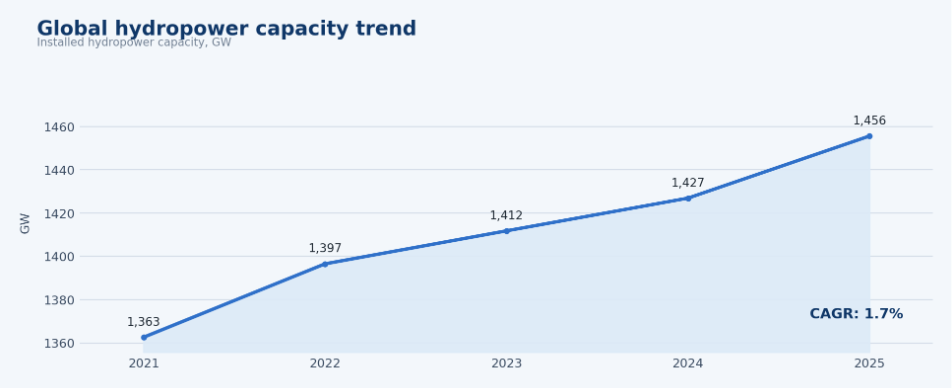
Figure 1. Capacity and generation should be reviewed together because installed megawatts do not always show utilization, drought exposure, or grid value.
Global Hydropower Capacity Statistics
Capacity statistics show the size of the installed asset base, but they should not be treated as the only market measure. Hydropower plants differ by design, reservoir storage, river flow, operating rules, modernization status, and grid role.
The latest capacity data shows steady growth in global capacity between 2021 and 2025. The increase is meaningful, but it is not as explosive as solar capacity growth. That slower pace reflects the physical and regulatory nature of the sector: projects require hydrological studies, environmental review, land and water planning, grid connection, civil works, and long-term financing.
Capacity benchmarks worth separating
- World hydropower capacity increased from 1.36 million MW in 2021 to 1.46 million MW in 2025.
- The latest capacity data records 1.40 million MW in 2022 and 1.41 million MW in 2023, showing a steady upward trend.
- Capacity reached 1.43 million MW in 2024 before rising to 1.46 million MW in 2025.
- IHA reported 16.2 GW of conventional hydropower additions in 2024.
- IHA reported 8.4 GW of pumped storage additions in 2024.
- IEA says more than 150 GW of new hydro capacity is set to come online by 2030.
- The most important capacity questions are not only how many megawatts exist, but how much can be upgraded, how much is flexible, and how much is exposed to drought or seasonal inflow risk.
| Metric | Latest Value | Market Meaning |
|---|---|---|
| Total installed hydropower capacity | 1,455.6 GW | The global infrastructure base. |
| Hydropower electricity generation | 4,500 TWh in 2024 | Real annual electricity contribution. |
| Hydropower share of global electricity | 14% in 2024 | System-level importance. |
| New hydropower additions | 24.6 GW in 2024 | Current expansion pace. |
| Conventional hydropower additions | 16.2 GW in 2024 | New generation capacity. |
| Pumped storage additions | 8.4 GW in 2024 | Storage and flexibility momentum. |
Hydropower Generation and Electricity Share
Generation statistics show what hydropower actually delivers to the electricity system. Capacity shows the asset base; generation shows how water availability, reservoir operations, seasonal demand, and dispatch rules translate that asset base into electricity.
In 2024, hydropower generation recovered globally after drought-affected output in earlier periods. IEA reported roughly 4,500 TWh of hydroelectric generation and around 14% of global electricity. That makes hydropower a core electricity source, not a niche renewable technology. At the same time, hydro’s share can decline over time if solar and wind grow faster, even when hydro generation itself increases.
Generation and electricity-share benchmarks
- IEA reports hydropower generated around 4,500 TWh in 2024.
- IEA places hydropower at about 14% of global electricity generation in 2024.
- IEA’s 2025 global review says renewables collectively accounted for about one-third of global electricity generation in 2024, led by hydropower.
- IEA reported hydropower generation increased by about 190 TWh in 2024.
- IEA expects hydropower generation to rise by about 7% between 2025 and 2030.
- High hydro-dependence countries need drought planning because a low-water year can reduce output even when installed capacity is unchanged.
- Generation data should be reviewed by month and season, not only by annual total, because dry-season output can be the binding constraint for grid planners.
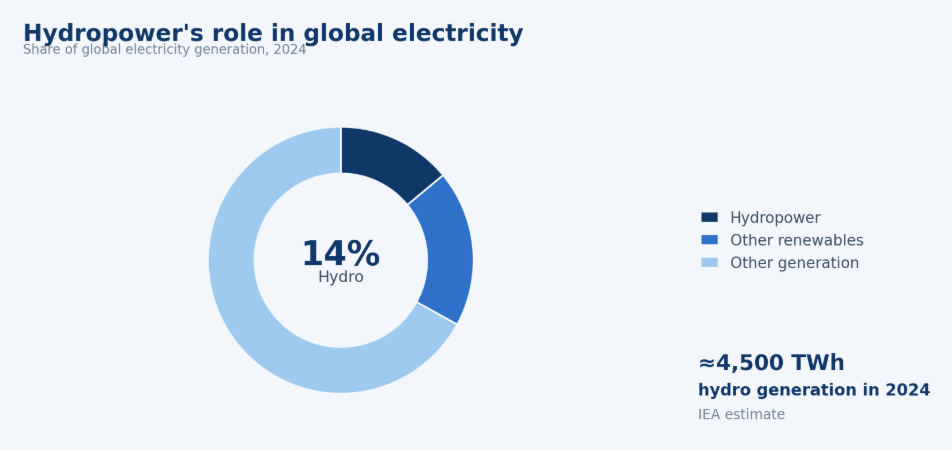
Figure 2. Hydropower’s electricity share shows why generation data matters alongside capacity.
Pumped Storage Hydropower Market Statistics
Pumped storage deserves its own market section because it changes hydropower’s role from generation alone to system flexibility. Instead of only producing electricity from river flow, pumped storage shifts energy across hours, supports peak demand, and helps grids absorb more variable renewables.
The rise of solar and wind makes this function more valuable. Solar output can peak before evening demand, wind output can change quickly, and grids need flexible resources that can ramp, store, and stabilize electricity. Pumped storage is capital-intensive and slow to develop, but it can provide multi-hour storage, grid services, peak power, reserve capacity, and long asset life.
Pumped storage and flexibility benchmarks
- IHA reported 8.4 GW of pumped storage hydropower additions in 2024.
- IHA reported global hydropower additions of 24.6 GW in 2024, meaning pumped storage represented about one-third of that annual addition figure.
- IRENA’s 2026 capacity highlights report pure pumped storage hydropower at 160 GW at the end of 2025.
- IHA reports a broader pumped storage installed base of 189 GW in 2024, reflecting source and classification differences.
- The latest capacity data records China with 58.69 GW of pumped storage capacity in 2024 and 7.75 GW of pumped storage additions that year.
- Reuters coverage of IHA data reported more than 200 GW of pumped storage under construction in China and a potential 130 GW outlook by 2030.
- Pumped storage is most useful when it is evaluated with renewable curtailment, evening peak demand, grid congestion, reserve needs, and price volatility.
| Pumped Storage Role | What It Supports | Why It Matters |
|---|---|---|
| Grid balancing | Wind and solar variability | Stabilizes renewable-heavy power systems. |
| Peak power | Evening and seasonal demand | Reduces reliance on fossil peaker plants. |
| Long-duration storage | Multi-hour energy shifting | Supports reliability when variable renewables drop. |
| Ancillary services | Frequency and voltage control | Improves grid quality and operating resilience. |
| Emergency reserve | Backup flexibility | Strengthens energy security during stress events. |
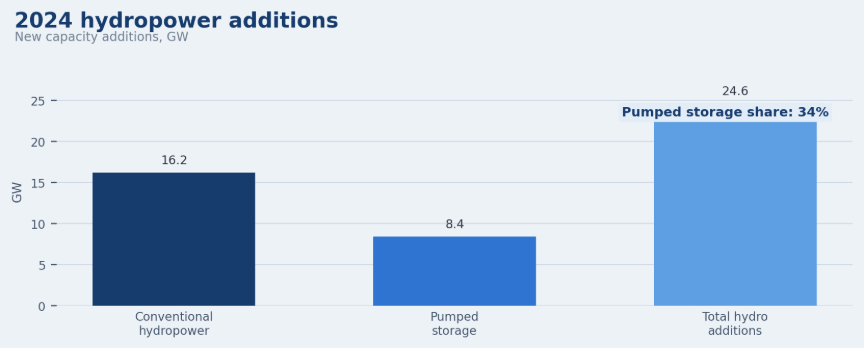
Figure 3. Pumped storage additions show hydropower’s storage and flexibility role in 2024.
Regional Hydropower Market Intelligence
Regional data is one of the most useful parts of hydropower market analysis because water resources, electricity needs, climate exposure, permitting rules, and project economics differ sharply by geography. A global average can hide very different market realities.
Asia-Pacific
Asia is the largest hydropower region in the latest reported capacity data, with 668.3 GW of installed capacity in 2025. China dominates the regional picture with 448.0 GW, while India reached 56.3 GW and Japan reached 50.1 GW. The region combines large conventional hydropower, rapid pumped storage expansion, mountain-river systems, and fast-growing electricity demand.
- China’s hydropower capacity increased from 390.9 GW in 2021 to 448.0 GW in 2025.
- India’s capacity increased from 51.6 GW in 2021 to 56.3 GW in 2025.
- Japan remained a major hydro and pumped storage market with 50.1 GW in 2025.
- Lao PDR recorded 10.4 GW in 2025, reflecting the importance of hydro exports and regional power trade in parts of Southeast Asia.
Europe
Europe is a mature hydropower region where the main market story is less about a new wave of large dams and more about modernization, pumped storage, ecological compliance, and flexibility. Norway, Sweden, Switzerland, Austria, Italy, France, Spain, and Türkiye all show how hydro can support grid reliability, but permitting and river-ecology constraints make new projects more complex.
The European opportunity is to extract more value from existing assets. Turbine upgrades, digital controls, sediment management, dam-safety investment, and pumped storage expansion can improve energy value without requiring every market to build large new reservoirs. Europe also needs storage and flexibility as wind and solar grow, which makes existing hydro reservoirs and pumped storage stations strategically important.
North America
North America has a large legacy hydro fleet. Canada relies heavily on hydropower in several provinces, while the United States has a broad base of conventional hydro and pumped storage assets. The market opportunity is modernization, relicensing, environmental upgrades, and selective pumped storage expansion. Western drought risk and river-basin constraints mean generation must be analyzed alongside climate and water-management data.
Latin America
Latin America has some of the world’s most hydro-dependent electricity systems. Brazil is the regional anchor, with hydropower historically central to power supply. Paraguay, Colombia, Peru, Chile, and other countries also rely on hydro resources. The market advantage is large renewable electricity potential, but drought risk is a serious planning issue. Diversification into wind, solar, transmission, and storage helps reduce pressure on hydro output during dry years.
Africa
Africa reached 48.9 GW of hydropower capacity in the latest reported capacity data in 2025, up from 37.5 GW in 2021. The continent has large untapped potential, but development depends on financing, transmission, project execution, regional power trade, and climate-risk planning. Ethiopia, Angola, Democratic Republic of the Congo, Zambia, Nigeria, Egypt, Mozambique, Morocco, Uganda, Ghana, and Cameroon are important country-level markets in the latest reported capacity data.
| Region | Market Position | Main Opportunity | Main Risk |
|---|---|---|---|
| Asia-Pacific | Largest capacity and growth base | New projects and pumped storage | Environmental and social concerns |
| Europe | Mature hydropower system | Modernization and flexibility | Aging assets and ecological limits |
| North America | Large legacy fleet | Upgrades and storage expansion | Relicensing, drought, and permitting |
| Latin America | Hydro-dependent electricity region | Clean power and grid expansion | Drought and rainfall variability |
| Africa | High untapped potential | Energy access and new capacity | Financing and execution barriers |
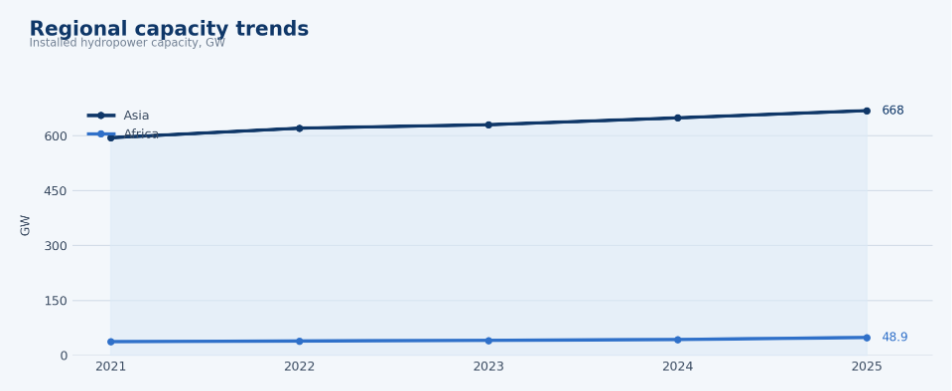
Figure 4. Regional capacity trends show Asia’s scale and Africa’s smaller but strategically important growth base.
Country-Level Hydropower Statistics
Country-level data is essential because hydropower plays different roles in different electricity systems. In one country it may be the backbone of electricity supply. In another, it may be a flexible resource that balances solar and wind. In another, the main market may be rehabilitation of older plants. Global averages cannot show those differences.
China
China is the largest hydropower market in the latest reported capacity data. Its installed hydropower capacity increased from 390.9 GW in 2021 to 448.0 GW in 2025. The country is also the most important pumped storage growth market. The latest capacity data records 58.69 GW of pumped storage capacity in 2024, 7.75 GW of additions that year, and more than 200 GW under construction in 2025. This makes China central to both conventional hydro scale and the storage side of the market.
India
India is a growth market where hydropower supports grid balancing, renewable integration, and regional electricity planning. The latest capacity data records Indian hydropower capacity at 51.6 GW in 2021 and 56.3 GW in 2025. India’s value is not only in capacity additions; it is also in how hydro can support a power system with fast solar and wind growth, rising peak demand, and large regional differences in resource availability.
Japan
Japan remains a significant hydro market, with 50.1 GW recorded in the latest reported capacity data for 2025. Its market is more mature than many Asian expansion markets, so modernization, pumped storage, reliability, and grid balancing matter more than rapid conventional capacity growth. Japan’s experience also shows why hydro assets remain strategically useful even in countries with limited scope for large new dam construction.
Ethiopia
Ethiopia is one of Africa’s most important hydro growth stories, with 9.2 GW recorded in the latest reported capacity data for 2025. Its hydropower capacity is closely tied to energy access, industrial development, regional power trade, and national electricity planning. Ethiopia also shows why African hydropower statistics should be reviewed with transmission, financing, climate, and regional cooperation data.
Angola, DRC, Zambia, and Nigeria
Angola recorded 3.7 GW in 2025, while the Democratic Republic of the Congo recorded 3.2 GW. Zambia and Nigeria also appear among the leading African markets in the latest reported capacity data. These countries represent the development side of the hydropower market: large resources, strong electricity needs, and major potential benefits, but also project-financing, grid-connection, and execution challenges.
Norway, Brazil, Canada, and the United States
Several major hydro countries are important even when their exact values are not expanded in the latest reported capacity table. Norway is a classic hydro-dominant electricity system where reservoirs help anchor national electricity supply. Brazil is a major hydro-dependent system where drought exposure has become a central planning issue. Canada relies heavily on hydropower in multiple provinces and uses hydro as a reliability and export resource. The United States has a large legacy fleet where modernization, relicensing, environmental compliance, and pumped storage are central themes.
| Country | Market Role | Key Hydropower Insight |
|---|---|---|
| China | Largest global market | Leads capacity, generation scale, and pumped storage growth. |
| India | Expansion market | Hydropower supports renewable balancing and peak demand planning. |
| Japan | Mature hydro and storage market | Modernization and pumped storage remain central. |
| Ethiopia | African growth market | Hydropower is tied to energy access and regional power trade. |
| Angola | African capacity base | Large hydro resources support national power development. |
| DRC | Long-term potential market | Resource potential is large, but execution and grid needs are critical. |
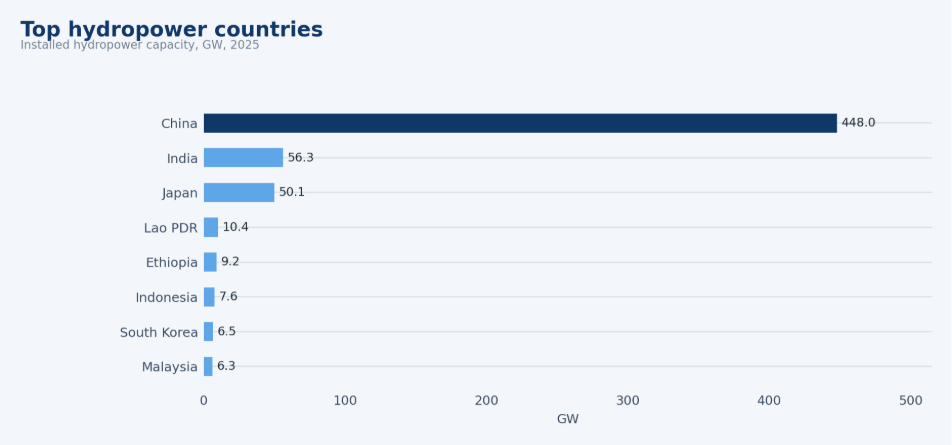
Figure 5. Country-level capacity shows China’s clear lead among selected hydropower markets.
Hydropower Investment, Pipeline, and New Capacity
Investment statistics show where future growth is likely to come from. The hydropower market has three different growth lanes: new conventional projects, pumped storage projects, and modernization of existing plants. These are not the same market. They have different investors, timelines, risks, permitting requirements, and grid benefits.
New conventional hydropower is most important in emerging and developing economies where electricity demand is rising and untapped river resources remain available. Pumped storage is most important in grids that are adding large amounts of solar and wind. Modernization is most important in mature hydro markets where assets are aging but still strategically valuable.
Investment and development benchmarks
- IHA reported 24.6 GW of new hydropower capacity additions in 2024.
- The 2024 additions included 16.2 GW of conventional hydropower and 8.4 GW of pumped storage.
- IEA expects more than 150 GW of new hydro capacity to come online by the end of the decade.
- China is the dominant pumped storage construction market in the latest reported capacity data, with more than 200 GW under construction reported in 2025.
- Africa’s capacity grew from 37.5 GW in 2021 to 48.9 GW in 2025 in the latest reported capacity data, showing visible expansion but from a smaller base.
- Asia’s hydropower capacity reached 668.3 GW in 2025 in the latest reported capacity data, making it the largest regional capacity base listed.
- Modernization opportunities include turbine replacement, generator upgrades, digital controls, dam-safety improvements, fish passage, sediment management, and performance monitoring.
| Growth Source | Where It Matters Most | Why It Matters |
|---|---|---|
| New large hydropower | Asia and Africa | Adds major renewable generation capacity. |
| Pumped storage | China, Europe, India, Australia, U.S. | Supports renewable integration and grid flexibility. |
| Modernization | Europe, North America, Japan | Extends asset life and improves output. |
| Small hydropower | Emerging and rural markets | Supports distributed renewable access. |
| Grid upgrades | Hydro-rich regions | Moves power from resource areas to demand centers. |
Climate, Drought, and Hydropower Reliability Statistics
Hydropower is renewable, but it is water-dependent. That makes climate, rainfall, snowpack, reservoir levels, inflows, and drought planning central to the market outlook. A plant can have the same installed capacity in two different years and still produce very different amounts of electricity if hydrological conditions change.
This is why generation statistics should be reviewed with capacity data. A country that depends heavily on hydropower may have low-carbon electricity in a normal water year but face shortages, imports, fossil backup, or price pressure in a severe drought year. Climate risk does not make hydropower less important; it makes better planning more important.
Reliability and climate-risk benchmarks
- IEA reported hydropower generation increased by about 190 TWh in 2024, showing recovery after drought-affected conditions in earlier periods.
- Annual generation can move even when installed capacity is stable because hydropower depends on inflows and reservoir levels.
- Latin America’s hydro-heavy systems need drought planning because water variability can affect electricity prices, dispatch, and backup generation.
- Western North America faces recurring water-risk concerns that can affect hydro output and reservoir operations.
- African hydropower development needs climate-sensitive reservoir planning because new capacity must remain reliable under changing rainfall patterns.
- Pumped storage can support renewable integration, but it still requires water management, site suitability, grid connection, and long-term operating economics.
| Risk Area | Metric to Track | Why It Matters |
|---|---|---|
| Drought exposure | Reservoir levels and inflows | Shows generation risk before output falls. |
| Seasonal variability | Monthly generation pattern | Helps plan low-water periods. |
| Climate sensitivity | Output changes during dry years | Shows long-term reliability pressure. |
| Aging infrastructure | Plant age and outage rate | Identifies modernization needs. |
| Environmental limits | Water flow and ecosystem rules | Affects operating flexibility. |
Hydropower’s Role in Renewable Energy Systems
Hydropower’s system value is broader than its annual energy output. Reservoir plants can provide dispatchable renewable power. Pumped storage can shift energy across hours. Hydro turbines can support grid stability. In some systems, hydropower provides flexibility that helps absorb more wind and solar without relying as heavily on fossil backup.
That does not mean every hydropower asset has the same value. Run-of-river plants, reservoir plants, small hydro facilities, and pumped storage stations perform different functions. A strong market analysis separates energy production from flexibility, storage, capacity adequacy, ancillary services, and seasonal support.
Renewable-system benchmarks
- Hydropower remained the largest renewable electricity source in IEA’s 2024 global power-generation review.
- IEA reported hydropower at about 14% of global electricity in 2024.
- Pumped storage additions reached 8.4 GW in 2024, according to IHA.
- Pure pumped storage hydropower reached 160 GW by the end of 2025 in IRENA’s capacity highlights.
- Hydropower can reduce renewable curtailment when storage and reservoir flexibility are coordinated with wind and solar output.
- Hydro-rich countries can use reservoirs and interconnections to support seasonal balancing and regional power trade.
| System Value | How Hydropower Helps | Market Importance |
|---|---|---|
| Dispatchable renewable power | Generates when needed | Supports reliability. |
| Storage and flexibility | Pumped storage shifts energy | Balances solar and wind. |
| Grid stability | Provides inertia and ancillary services | Improves power quality. |
| Seasonal support | Reservoirs manage water and energy | Helps during demand peaks. |
| Renewable integration | Complements variable generation | Reduces fossil backup pressure. |
Market Challenges and Modernization Needs
Hydropower faces real market constraints. Large projects can take years to plan and build. Environmental review, community impact, biodiversity, fish passage, sediment, river-flow requirements, dam safety, and land-use issues can all affect timelines and public acceptance. Financing can also be difficult because project costs are high upfront while benefits accrue over long operating lives.
At the same time, the modernization opportunity is large. Many existing plants can deliver more value through turbine upgrades, better controls, improved forecasting, digital monitoring, dam-safety work, sediment-management planning, and environmental retrofits. Modernization is often less visible than building a new dam, but it can improve output, reliability, safety, and ecological performance.
Challenges worth measuring
- Aging infrastructure can reduce availability, efficiency, and safety if reinvestment is delayed.
- Sedimentation can reduce reservoir performance and long-term storage value.
- Environmental permitting can affect project timelines, especially in mature markets with strong river-ecology requirements.
- Fish passage and environmental flow rules can affect how plants operate and how flexible they can be.
- Capital intensity makes long-term financing and policy stability important.
- Climate uncertainty requires better hydrological forecasting and stress testing.
- Digital monitoring and turbine upgrades can improve performance without requiring entirely new projects.
| Challenge | Why It Matters | Market Response |
|---|---|---|
| Aging infrastructure | Reduces efficiency and reliability | Turbine upgrades and digital monitoring. |
| Drought risk | Reduces generation | Forecasting and diversified grids. |
| Environmental impact | Affects permitting and public support | Eco-flow and fish-passage upgrades. |
| High upfront cost | Slows development | Long-term financing and policy support. |
| Long project timelines | Delays new capacity | Better planning and permitting reform. |
| Sedimentation | Reduces reservoir performance | Sediment management and catchment planning. |
Hydropower Market Diagnostic Framework
A useful hydropower statistics article should help energy leaders decide what to measure next. Installed capacity alone cannot show whether a market is growing, exposed to drought, ready for storage expansion, or dependent on modernization.
| Market Area | Core Signals to Measure | Useful Benchmark |
|---|---|---|
| Capacity growth | Installed capacity, additions, pipeline | Shows market expansion. |
| Generation output | Annual generation, capacity factor, seasonal output | Shows real electricity contribution. |
| Storage role | Pumped storage capacity and pipeline | Shows flexibility value. |
| Regional strength | Capacity and generation by region | Shows market leadership. |
| Country dependence | Hydro share of electricity | Shows grid reliance. |
| Climate risk | Drought impact, reservoir levels, inflows | Shows reliability pressure. |
| Modernization | Asset age, upgrade potential, outage rate | Shows investment need. |
This framework keeps the article from becoming a stat dump. Each benchmark should answer a market question: where is hydropower growing, where is it vulnerable, where does pumped storage matter, which countries depend on hydro most, and where can modernization unlock additional value?
90-Day Hydropower Market Review Plan
Hydropower data becomes more useful when it is translated into a review cycle. A 90-day plan can help teams move from headline capacity numbers to a practical market scorecard that compares capacity, generation, storage, climate risk, country dependence, investment pipeline, and modernization needs.
| Timing | What to Do | Output |
|---|---|---|
| Days 1-30 | Review global capacity, generation, project pipeline, and pumped storage data. | Baseline market map. |
| Days 31-60 | Compare regional growth, country dependence, climate risk, and storage demand. | Regional and country opportunity profile. |
| Days 61-90 | Evaluate modernization, investment needs, project economics, and market risks. | Strategic hydropower market scorecard. |
Metrics Energy Leaders Should Track
The final scorecard should be detailed enough to locate the market signal without becoming a vanity dashboard. Hydropower is infrastructure-heavy, water-dependent, and grid-sensitive, so the best metrics connect assets, output, risk, and system value.
| Metric | Why It Matters |
|---|---|
| Installed hydropower capacity | Total infrastructure scale. |
| Annual hydropower generation | Real electricity contribution. |
| Hydropower share of total electricity | National grid dependence. |
| Hydropower share of renewable electricity | Renewable-system importance. |
| Pumped storage capacity | Storage and flexibility value. |
| Annual capacity additions | Current expansion pace. |
| Project pipeline | Future market direction. |
| Reservoir levels and inflows | Drought and reliability risk. |
| Plant age and modernization need | Upgrade opportunity. |
| Environmental compliance indicators | Operating and permitting constraints. |
| Capacity factor | How effectively installed capacity is used. |
| Forced outage rate | Reliability and maintenance pressure. |
How to Read Hydropower Market Statistics
Hydropower statistics are most useful when they are read as a set of connected indicators rather than as isolated numbers. Installed capacity shows the size of the infrastructure base, but generation shows how much electricity that infrastructure actually produced. Pumped storage capacity shows flexibility value, while country-level electricity share shows how dependent a national grid is on river flow, reservoirs, and seasonal water conditions.
This is why the article separates the market into capacity, generation, storage, regional position, country dependence, investment pipeline, and climate exposure. A single global hydropower figure can look stable, but the operating reality may be very different across regions. A mature European plant may need modernization and environmental upgrades, a Chinese pumped storage project may be built mainly for grid balancing, an African project may be tied to electricity access, and a Latin American utility may be focused on drought resilience.
Hydropower numbers worth comparing together
- Capacity should be compared with annual generation because water availability and dispatch rules can change output without changing installed megawatts.
- Generation should be compared with electricity share because a medium-sized hydro fleet can be nationally important if the country has a smaller power system.
- Pumped storage should be separated from conventional hydropower because its market value is tied to flexibility, storage, and renewable balancing rather than only electricity production.
- Regional totals should be checked against country concentration because a single country can dominate a regional capacity base.
- Growth should be measured through new projects, plant upgrades, and pumped storage pipelines rather than new large dams alone.
The strongest hydropower market review therefore works like a layered scorecard. First, it shows the global scale of the sector. Then it explains which regions are expanding, which countries depend most on hydropower, which markets are modernizing older plants, and where pumped storage is becoming more valuable as solar and wind generation increase. That layered approach keeps the statistics practical for energy companies, investors, policy teams, grid planners, and market researchers.
Regional Hydropower Planning Intelligence
Regional and country-level statistics matter because hydropower does not follow one global pattern. Some markets use it as the backbone of electricity supply, while others use it as a flexible resource beside thermal, nuclear, wind, or solar power. Pumped storage adds another layer because it can consume electricity during low-demand periods and return it during higher-value hours.
Planning signals worth separating
- Asia-Pacific should be treated as the main growth and scale region. China has the largest conventional hydropower base and is building pumped storage quickly, while India, Pakistan, Vietnam, Laos, Nepal, Bhutan, and Indonesia connect hydro to renewable balancing, regional trade, and electricity-demand growth.
- Europe and North America are mature hydropower markets. The strongest opportunities often come from asset modernization, turbine upgrades, relicensing, fish passage, pumped storage, and flexibility services rather than new large-dam development.
- Latin America needs separate analysis because several countries rely heavily on hydropower while also facing rainfall and drought variability. Brazil is the largest regional example, while Paraguay, Colombia, Peru, and Chile show why country-level dependence matters.
- Africa should be read through both opportunity and delivery risk. Ethiopia, Angola, the Democratic Republic of the Congo, Zambia, Mozambique, Egypt, Nigeria, and Sudan all appear in hydropower discussions for different reasons, but financing, transmission, governance, climate resilience, and cross-border water management remain critical.
Hydropower Market Segmentation
The market can also be segmented by project type. Large reservoir hydropower usually has the strongest system value where it can store water, shift output, and provide dispatchable renewable electricity. Run-of-river hydropower often has lower storage flexibility, but it can still provide steady renewable generation where river flows are reliable. Small hydropower can support remote grids, rural electrification, industrial sites, and local renewable systems, although its economics and environmental impact vary widely by site.
Pumped storage should be treated as its own segment because it competes less with wind and solar generation and more with other storage and flexibility technologies. As grids add more variable renewable energy, pumped storage becomes valuable for shifting energy across hours, supporting evening peaks, providing reserves, and strengthening system reliability. This is why pumped storage appears repeatedly in the article rather than only as a footnote under hydropower capacity.
Modernization is the third important segment. Many hydropower plants were built decades ago, and their future value depends on maintenance, digital monitoring, turbine efficiency, sediment management, dam safety, and environmental upgrades. Modernization can sometimes add output or flexibility without building a completely new dam. For mature markets, this may be one of the most realistic ways to increase hydropower value while reducing environmental and permitting pressure.
Hydropower Statistics for Investors, Utilities, and Policy Teams
Different readers should use hydropower statistics in different ways. Investors usually need to understand project pipeline, construction timelines, tariff structures, financing models, political risk, environmental approvals, and long-term revenue certainty. Utilities focus more on generation reliability, dispatchability, outage rates, seasonal water availability, reserve margins, and integration with solar, wind, and storage. Policy teams need a broader view that includes electricity access, river-basin planning, climate adaptation, land and community impacts, and national energy-security goals.
For investors, the key question is whether a hydropower project can deliver stable long-term value after construction, permitting, environmental management, debt service, and hydrology risk are included. For utilities, the key question is how the plant improves the power system, not only how much energy it produces in an average year. For policymakers, the key question is whether hydropower strengthens the national electricity mix without creating unmanaged water, social, or environmental risks.
- Investors should compare capital cost, construction risk, tariff certainty, project pipeline, and storage revenue opportunities.
- Utilities should compare generation output, ramping capability, outage risk, pumped storage value, and drought-year performance.
- Grid planners should compare hydropower with solar, wind, batteries, thermal backup, transmission, and demand-side flexibility.
- Policy teams should compare electricity access, energy security, climate resilience, river health, and regional development benefits.
hydropower statistics article should not only repeat capacity totals. It should help the reader decide what the numbers imply for market opportunity, project risk, grid planning, and long-term renewable strategy. A large capacity figure may signal market strength, but it may also signal a mature fleet that needs refurbishment. A high hydropower share may signal clean electricity, but it may also signal drought exposure. A pumped storage pipeline may signal future flexibility, but it may also depend on permitting, grid pricing, and long construction timelines.
Global Hydropower Market Statistics FAQ
Common questions
What is the size of the global hydropower market?
The latest capacity data records global installed hydropower capacity at about 1,455.6 GW in 2025. IEA also reports around 4,500 TWh of hydropower generation in 2024, showing that the market should be measured by both installed capacity and actual electricity output.
Which country has the most hydropower capacity?
China is the largest country-level hydropower market, with 448.0 GW of installed capacity in 2025. It is also the most important pumped storage growth market in the data.
Which region leads the hydropower market?
Asia leads regional capacity data with 668.3 GW in 2025. The region includes China, India, Japan, Lao PDR, Indonesia, South Korea, Malaysia, Bhutan, and other important hydropower markets.
What is pumped storage hydropower?
Pumped storage hydropower stores electricity by pumping water to a higher reservoir when electricity is abundant and releasing it through turbines when electricity is needed. It is one of the most established large-scale storage technologies.
Why is pumped storage important for renewable energy?
Pumped storage helps balance solar and wind by shifting energy across hours, supporting peak demand, providing reserves, and improving grid stability. It becomes more valuable as variable renewable generation grows.
Is hydropower growing faster than solar and wind?
No. Hydropower is growing more slowly than solar and wind because projects are capital-intensive and take longer to permit and build. Its value, however, includes dispatchability, storage, and grid flexibility, not only annual capacity additions.
What are the biggest risks for hydropower?
The main risks include drought, changing rainfall patterns, reservoir pressure, aging infrastructure, environmental permitting, sedimentation, community impacts, high upfront cost, and long project timelines.
Which countries depend most on hydropower?
Hydro dependence varies by country. Norway, Brazil, Canada, Paraguay, Ethiopia, and several other markets use hydropower as a major electricity source, while China and India are important because of scale and growth.
How does drought affect hydropower generation?
Drought reduces inflows and reservoir levels, which can lower electricity generation even if installed capacity is unchanged. This is why capacity data should be reviewed with generation, reservoir, and climate-risk data.
What metrics should hydropower market analysis track?
A strong review should track installed capacity, annual generation, capacity additions, pumped storage capacity, country dependence, regional distribution, reservoir levels, inflows, project pipeline, modernization needs, and environmental performance.
Final Takeaway
Global hydropower statistics point to one conclusion: hydropower remains one of the world’s most important renewable electricity systems, but its market value is broader than installed capacity. The next phase depends on storage, modernization, climate resilience, regional planning, and grid flexibility.
The data shows a large global capacity base, continued annual additions, significant generation output, and rising pumped storage momentum. Asia leads the capacity story, Europe and North America lean toward modernization and flexibility, Latin America must manage hydrology risk, and Africa holds major long-term development potential.
For energy leaders, the practical next step is a hydropower scorecard. Measure installed capacity, generation, pumped storage, reservoir levels, seasonal output, plant age, upgrade potential, environmental constraints, and country dependence together. That is how hydropower statistics become useful for investment, grid planning, climate resilience, and long-term energy security.


