Electric motors are one of the least visible but most important sales markets in industrial and commercial infrastructure. They sit inside pumps, fans, compressors, conveyors, machine tools, elevators, HVAC systems, refrigeration equipment, vehicles, appliances, robotics, and water systems. Because of that, electric motor sales are not only a component-market indicator. They also show where factories are investing, where buildings are being upgraded, where transportation is electrifying, and where energy-efficiency rules are changing replacement decisions.
The numbers point to a market that is large, mature, and still expanding. One major source places the global electric motors market at USD 152.2 billion in 2024 and forecasts USD 206.4 billion by 2029, while another source places the broader electric motor market at USD 180.31 billion in 2025 and forecasts USD 363.39 billion by 2035. Those headline figures matter because they show both near-term industrial demand and a longer replacement cycle driven by efficient, controlled, and application-specific motor systems.
This article uses electric motor statistics as operating evidence. The goal is not to list every market estimate, but to explain what each number says about sales demand, regional concentration, product mix, end-use industries, and future growth. The strongest signals are consistent across the dataset: Asia Pacific is a major scale center, industrial and transportation uses carry large demand weight, AC motors remain a core category, and efficiency rules are pushing buyers toward better-performing systems.
Executive Electric Motor Sales Benchmarks
The executive picture is straightforward: electric motor sales are expanding because motors are attached to production, mobility, comfort, and energy performance. Unlike markets driven by one consumer trend, motor demand is spread across many high-usage systems. A factory may buy motors for conveyors and compressors. A building owner may replace fan or pump motors. An OEM may buy traction, auxiliary, or servo motors. A utility or municipality may need motors for water, wastewater, or power equipment.
• The global electric motors market was estimated at USD 152.2 billion in 2024.
• The same forecast reaches USD 206.4 billion by 2029, implying a 6.3% CAGR.
• A broader electric motor estimate places the market at USD 180.31 billion in 2025 and USD 363.39 billion by 2035.
• Asia Pacific was estimated at 38.14% of global electric motor market share in 2025 in one regional dataset.
• The U.S. motor-system assessment counted 52.5 million systems of at least 1 hp.
• U.S. industrial and commercial motor systems of at least 1 hp consume 1,079 TWh per year, equal to 29% of grid load in the assessment.
| Benchmark area | Current signal | Why it matters |
|---|---|---|
| Global value | USD 152.2B in 2024 | Shows large sales base |
| 2029 forecast | USD 206.4B | Confirms steady growth |
| Long outlook | USD 363.39B by 2035 | Frames the long-run opportunity |
| Asia Pacific | 38.14% share | Identifies the scale center |
| U.S. installed base | 52.5M systems | Indicates replacement depth |
| Energy use | 1,079 TWh/year | Explains efficiency value |
Market Size and Forecast
Market size is useful only when it explains what is happening behind the number. In electric motors, growth is not coming from one narrow product trend. It is spread across factories replacing older equipment, HVAC systems becoming more efficient, pump and compressor upgrades, automation projects, and transportation electrification. That makes the category more stable than markets that depend on one buyer group or one application cycle.
The near-term forecast gives the first anchor. Market sand Markets places the market at USD 152.2 billion in 2024 and projects USD 206.4 billion by 2029. Instead of reading that as a simple jump in revenue, the stronger interpretation is that buyers are continuing to invest in motor-driven equipment because uptime, efficiency, and automation are becoming everyday operating priorities.
The year-by-year path supports that story. The workbook steps from USD 161.79 billion in 2025 to USD 194.33 billion in 2028, showing a steady build rather than a sudden spike. A broader Precedence Research series reaches USD 255.98 billion in 2030 and USD 363.39 billion in 2035. The scopes are not identical, but the direction is consistent: electric motor demand is expanding because motors sit inside the systems that keep factories, buildings, vehicles, and infrastructure running.
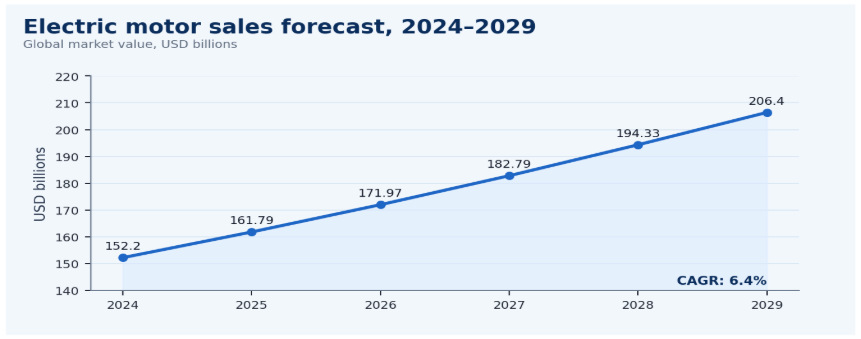
Figure 1. Electric motor sales forecast shows steady growth from automation, HVAC demand, and electrification
| Market signal | What it shows | Why it matters |
|---|---|---|
| Global revenue | Total sales opportunity | Sets the market baseline |
| Forecast CAGR | Growth speed | Supports planning |
| Regional share | Demand geography | Highlights concentration |
| End-use mix | Buyer sectors | Explains application depth |
| Replacement demand | Upgrade cycle | Supports recurring sales |
Motor Type and Product Mix Statistics
Product mix matters because electric motors are not sold as one uniform product. AC motors, DC motors, brushless DC motors, servo motors, stepper motors, fractional horsepower motors, integral horsepower motors, and high-efficiency motors all serve different buyer needs. A standard AC motor may be purchased for a pump or fan. A servo motor may be purchased for precision automation. A brushless DC motor may be purchased for a vehicle, appliance, or electronics system.
• The U.S. dataset identifies AC induction motors with 62.78% market share in 2025.
• The U.S. dataset also places fractional horsepower below 1 HP at 53.85% market share in 2025.
• The global AC electric motor dataset places the category at USD 84.33 billion in 2024 and USD 155.68 billion by 2032.
• The AC electric motor forecast implies an 8.02% CAGR from 2024 to 2032.
• Transportation accounted for 34.1% market share in 2026 in one global electric motor dataset.
• Industrial demand accounted for 41.6% share in 2025 in one AC motor market dataset.
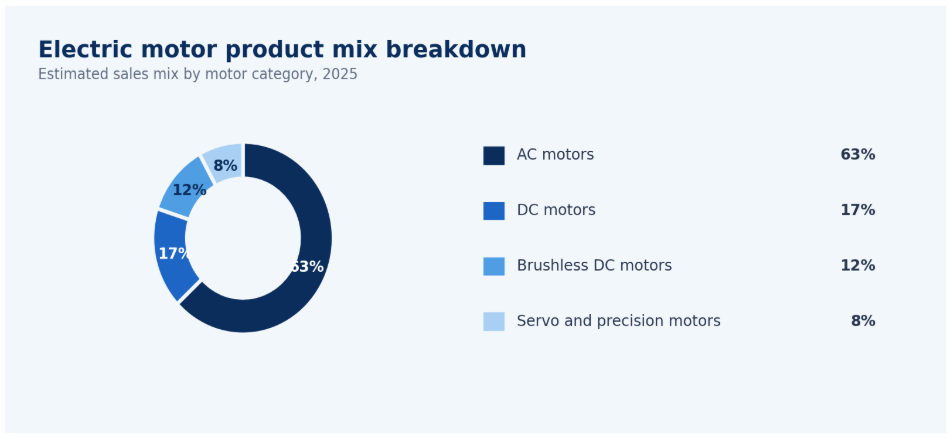
Figure 2. Product mix shows where standard volume and premium growth differ.
| Motor type | Main demand source | Sales implication |
|---|---|---|
| AC motors | Pumps, fans, compressors | Core volume |
| DC motors | Vehicles and electronics | Electrified systems |
| BLDC motors | EVs, appliances, robotics | Efficiency growth |
| Servo motors | Automation and robotics | Premium control |
| Fractional HP | HVAC and appliances | Broad demand |
| Integral HP | Heavy industry | Replacement value |
Industrial Demand: Pumps, Fans, Compressors, and Automation
Industrial demand remains one of the clearest ways to read the motor market. Motors are deeply embedded in plant operations. They run pumps, fans, blowers, compressors, conveyors, extruders, mixers, mills, machine tools, and process equipment. Because many of these assets run for long hours, replacement decisions are shaped by reliability, energy cost, downtime risk, and compatibility with modern controls.
The U.S. motor-system assessment shows why this category matters. U.S. industrial motor systems consume 546,963 GWh per year and represent 69% of sector electricity consumption. The same assessment says the top six industrial subsectors account for 62% of motor electricity consumption. Within industrial motor use, materials processing represents 29%, pumps represent 21%, and fans and blowers also represent 21%. These numbers explain why industrial buyers focus so strongly on efficiency and uptime.
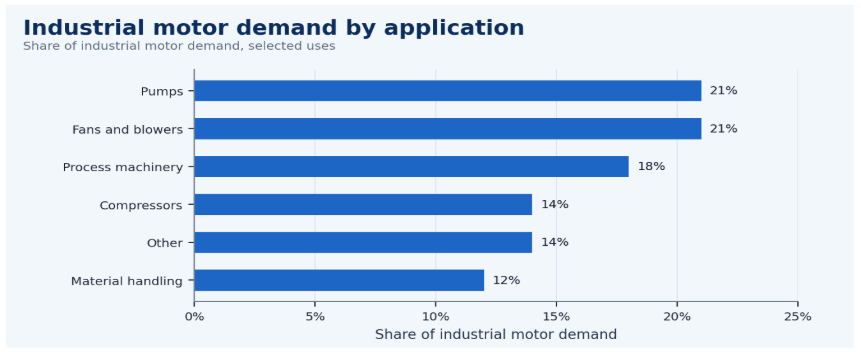
Figure 3. Industrial demand is concentrated in pumps, fans, compressors, and automation.
| Application | Sales signal | Why it matters |
|---|---|---|
| Pumps | 21% motor electricity share | Replacement demand |
| Fans/blowers | 21% motor electricity share | Building and plant link |
| Materials processing | 29% motor electricity share | Heavy industrial load |
| 1-500 hp systems | 75% motor electricity share | Large upgrade pool |
| Top six subsectors | 62% motor electricity share | Concentrated opportunity |
| Machine tools | Precision production | Servo demand |
Efficiency Rules and Replacement Demand
Efficiency rules are one of the strongest hidden drivers of electric motor sales. The purchase price of a motor is only one part of the lifecycle cost. For high-usage motors, electricity consumption over the operating life can exceed the initial purchase price by a wide margin. That is why regulations, utility programs, internal energy targets, and maintenance reviews can all trigger replacement demand.
The statistics show the size of that opportunity. U.S. industrial and commercial motor systems of at least 1 hp consume 1,079 TWh per year in the assessment. Industrial motor systems account for 69% of industrial sector electricity consumption, while commercial motor systems account for 43% of commercial sector electricity consumption. In the commercial sector, refrigeration compressors account for 48% of motor electricity consumption, and compressors, fans, blowers, and pumps together account for 94%.
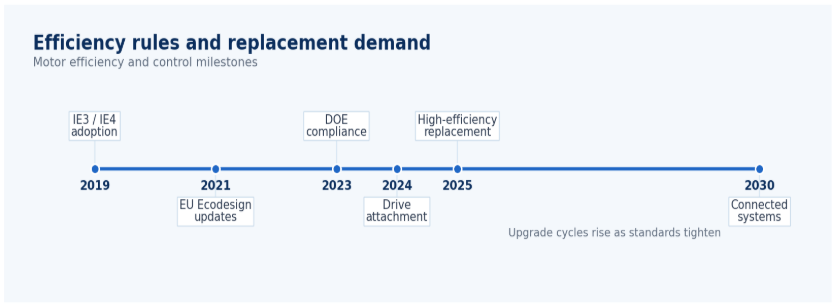
Figure 4. Efficiency rules and variable-speed control turn replacement into a lifecycle-cost decision.
| Efficiency signal | What it changes | Why it matters |
|---|---|---|
| IE3/IE4 rules | Minimum performance | Pushes replacement |
| NEMA Premium | Higher efficiency | Premium demand |
| Variable-speed drives | Better control | Cuts energy use |
| Replacement cycles | Old motor removal | Recurring sales |
| Energy prices | Savings value | Improves payback |
Regional Electric Motor Sales Intelligence
Regional statistics are essential because the electric motor market does not behave the same way everywhere. Asia Pacific is shaped by manufacturing scale, industrial infrastructure, China’s production base, India’s expansion, Japan’s robotics strength, and South Korea’s electronics and automotive supply chains. North America is shaped by replacement demand, HVAC upgrades, energy-efficiency rules, and process industries. Europe is shaped by regulation, factory automation, sustainability targets, and high-efficiency replacement.
• Asia Pacific accounted for 38.14% of global electric motor market share in 2025 in one dataset.
• Asia Pacific electric motor market size was estimated at USD 59.03 billion in 2024 and USD 63.34 billion in 2025 in another dataset.
• The Europe electric motor market was estimated at USD 42.8 billion in 2025 and forecast at USD 79.6 billion by 2035.
• The Europe forecast implies a 6.4% CAGR from 2025 to 2035.
• North America derived market-size signals in the workbook move from USD 61.69 billion in 2026 to USD 102.35 billion in 2033.
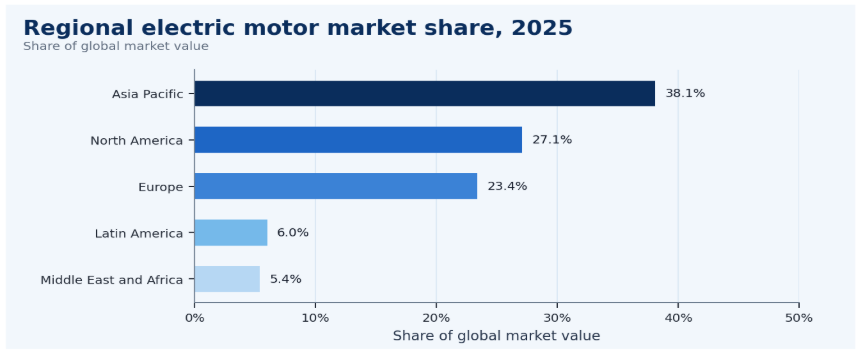
Figure 5. Regional signals show where motor sales are concentrated.
| Region | Sales implication |
|---|---|
| Asia Pacific | Largest demand pool from manufacturing and infrastructure |
| North America | Replacement, HVAC, and efficiency-led demand |
| Europe | Regulation and automation drive premium upgrades |
| Latin America | Mining, automotive, and water systems support steady demand |
| Middle East & Africa | HVAC, utilities, oil/gas, and infrastructure drive sales |
Country-Level Sales Signals
Country-level statistics make the article stronger because electric motor sales follow local industry structure. A country with large automotive production will show different motor demand than a country driven by mining, food processing, water infrastructure, or precision manufacturing. Country data also helps separate replacement-led markets from expansion-led markets.
• The U.S. electric motor market was estimated at USD 24.35 billion in 2025 and forecast at USD 33.39 billion by 2031.
• The U.S. forecast implies a 5.41% CAGR from 2025 to 2031.
• Japan’s electric motor market was estimated at USD 9.7 billion in 2025 and forecast at USD 48.7 billion by 2034.
• Germany represented 31.2% of Europe’s electric motor market in 2025 in the country-share dataset.
• France represented 18.7% of Europe’s market, while the United Kingdom represented 16.4% in the same 2025 country-share dataset.
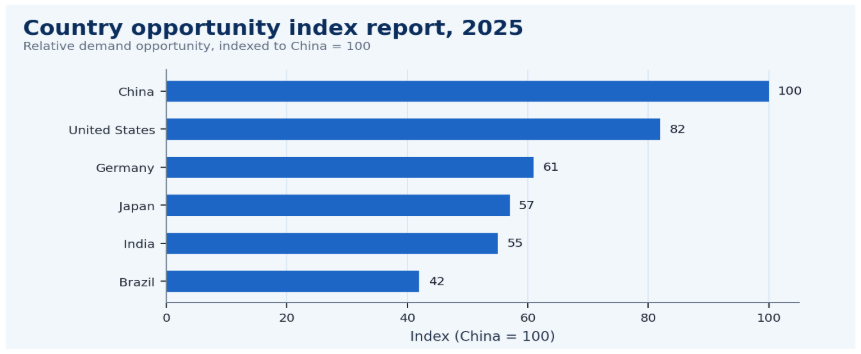
Figure 6. Country-level signals show how local industry structure changes demand.
| Country | Market signal | Why it matters |
|---|---|---|
| United States | USD 24.35B in 2025 | Mature upgrade market |
| China | Manufacturing scale | Large demand base |
| India | Industrialization | Expansion market |
| Japan | USD 9.7B in 2025 | Precision and robotics |
| Germany | 31.2% of Europe | Automation strength |
| Mexico | Automotive manufacturing | Supply-chain demand |
| Brazil | Mining and agriculture | Heavy-duty use |
| Saudi Arabia | Infrastructure and oil/gas | Process demand |
End-Use Industries: Where Motors Are Actually Sold
End-use segmentation prevents the article from becoming a generic market-size post. Electric motors are purchased because a specific system must move air, move water, compress refrigerant, drive a conveyor, rotate a machine tool, power a vehicle, or control a robotic axis. Each use case has different sales logic. Some are replacement-led. Some are OEM-led. Some are regulatory. Some are tied to capital spending.
The end-use numbers are useful because they show where motors are actually doing work. Transportation holds 34.1% market share in 2026 in one global dataset, while industrial applications account for 41.6% share in 2025 in one AC motor dataset. The operating burden is just as important: U.S. commercial motor systems represent 43% of commercial-sector electricity consumption, and industrial motor systems represent 69% of industrial-sector electricity consumption. Refrigeration compressors alone account for 48% of commercial motor electricity use, which explains why building-system upgrades matter so much.
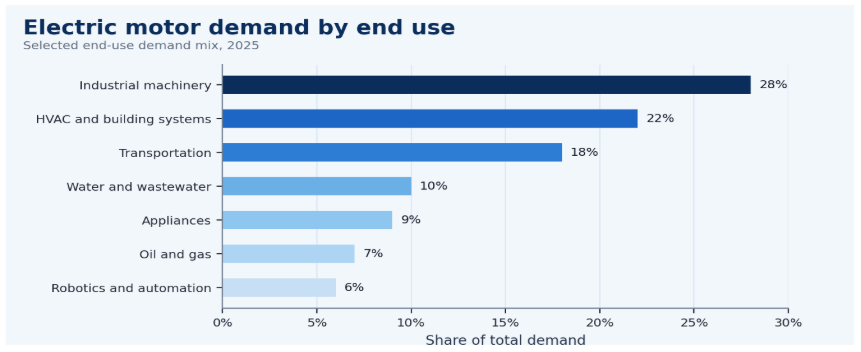
Figure 7. End-use indicators connect motor demand to uptime, comfort, mobility, and infrastructure.
| End-use sector | Motor sales driver | Sales implication |
|---|---|---|
| Industrial machinery | Factory output | Core demand |
| HVAC | Comfort and efficiency | Recurring market |
| Automotive | Electrification | Faster growth |
| Water systems | Pumps and treatment | Infrastructure demand |
| Oil and gas | Pumps and compressors | Heavy-duty demand |
| Appliances | Fractional HP | High volume |
| Robotics | Servo motors | Premium segment |
Automotive and EV Motor Demand
Automotive demand adds a faster-growth layer to the electric motor market. Traditional vehicles already use many small motors for windows, seats, pumps, fans, steering, braking, cooling, and comfort systems. EVs and hybrids increase the value and performance requirements of motor systems because traction motors, e-axles, thermal-management motors, and auxiliary systems become central to vehicle design.
• Transportation represented 34.1% market share in 2026 in one global electric motor dataset.
• Derived transportation motor market size rises from USD 52.99 billion in 2026 to USD 87.92 billion in 2033 in the workbook series.
• The U.S. permanent-magnet synchronous motor segment shows a forecast 10.96% CAGR from 2026 to 2031.
• U.S. medium-voltage motors from 250 to 3,000 HP show a forecast 9.98% CAGR from 2026 to 2031.
• Brushless motor demand is tied to compact design, energy efficiency, vehicle electrification, and robotics.
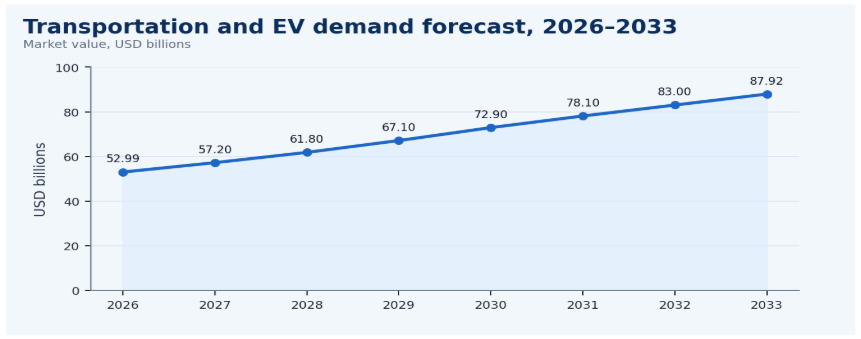
Figure 8. Transportation motor demand adds a faster-growth layer to the market.
| Automotive signal | What it shows | Why it matters |
|---|---|---|
| EV traction motors | Powertrain electrification | High-value demand |
| Auxiliary motors | More motors per vehicle | Raises content value |
| Hybrid vehicles | Transitional demand | Multiple categories |
| E-axles | Integrated drivetrain | Compact design |
| Magnet supply | Material dependency | Cost risk |
HVAC, Pumps, Compressors, and Building Systems
Building systems create recurring motor demand because fans, pumps, and compressors run for long hours. In many commercial buildings, motor-driven systems are part of energy bills, comfort performance, maintenance schedules, and equipment replacement planning. That makes HVAC and mechanical systems a practical sales channel for efficient motors and variable-speed controls.
The U.S. commercial motor-system data shows how concentrated building demand can be. Commercial motor systems consume 532,016 GWh per year and represent 43% of commercial sector electricity consumption. Refrigeration compressors account for 48% of commercial motor electricity consumption, and refrigeration compressors, fans, blowers, and pumps together account for 94%. The assessment also says 1-50 hp systems account for 80% of commercial motor electricity consumption.
| System | Motor role | Why it matters |
|---|---|---|
| HVAC fans | Air movement | Large building demand |
| Compressors | Cooling and refrigeration | High energy use |
| Pumps | Water movement | Core infrastructure |
| Heat pumps | Efficient heating/cooling | Adds demand |
| Variable-speed systems | Better control | Lowers cost |
Competition, Channels, and Market Risks
Electric motor sales are shaped by product makers, automation suppliers, regional manufacturers, distributors, OEM relationships, service providers, and replacement channels. Large global suppliers compete on reliability, efficiency, product range, service coverage, and system integration. Automation suppliers often sell motors together with drives and controls. Regional manufacturers may compete on cost, availability, and local relationships.
The competitive landscape includes companies such as ABB, Siemens, WEG, Nidec, Regal Rexnord, TECO, Toshiba, Johnson Electric, Wolong, Schneider Electric, Rockwell Automation, and Yaskawa. The most important sales question is not only who makes motors. It is who controls the route to the buyer: OEM specification, distributor availability, installed-base service, drive-and-control bundles, and replacement timing.
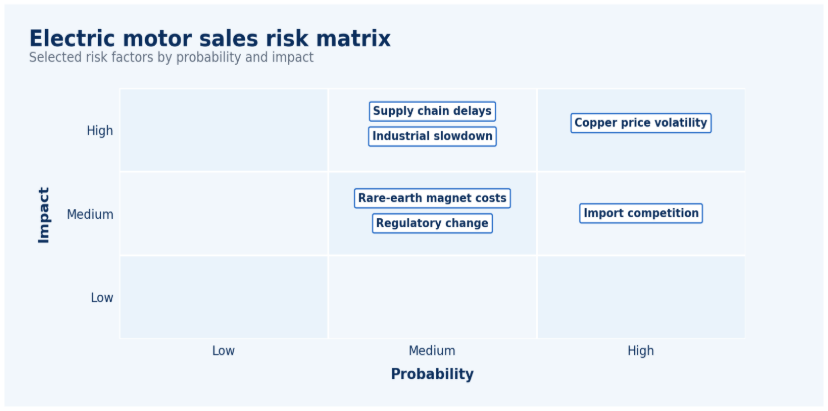
Figure 9. Sales risk matrix shows how materials, capex, and supply chains can slow demand.
| Risk area | Warning signal | Why it matters |
|---|---|---|
| Copper cost | Higher winding cost | Raises prices |
| Rare earth magnets | Supply pressure | Affects premium motors |
| Industrial slowdown | Delayed capex | Weakens orders |
| Low-cost imports | Price pressure | Compresses margins |
| Regulation cost | Compliance burden | Raises development cost |
| Supply chain delays | Longer lead times | Affects OEM supply |
Electric Motor Sales Forecast and 2030 Outlook
The 2030 outlook is less about selling standard motors and more about efficient, controlled, connected, and application-specific systems. The growth path is supported by industrial automation, high-efficiency replacement, EV and hybrid systems, HVAC upgrades, pump and compressor modernization, and rising demand for motor-drive packages. The broader Precedence Research series places the market at USD 255.98 billion in 2030, while the MarketsandMarkets series reaches USD 206.4 billion in 2029. Different scopes create different totals, but both point to continued expansion.
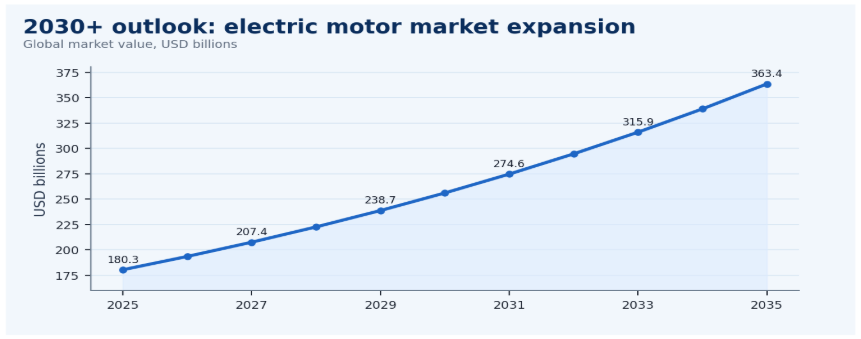
Figure 10. Electric motor sales outlook shows the shift from standard motors to efficient, controlled systems.
| Outlook area | Expected direction | Key question |
|---|---|---|
| Global sales | Continued growth | Which applications grow fastest? |
| Efficiency motors | Higher share | How fast are old motors replaced? |
| Asia Pacific | Remains largest | How much comes from China and India? |
| Automotive | Faster growth | How quickly does electrification scale? |
| Drives and controls | More integrated | Are motors sold as systems? |
| Services | Larger aftermarket | How much revenue comes from maintenance? |
Electric Motor Market Metrics to Track
A statistics article becomes useful when it turns the market into a measurement system. Electric motor manufacturers, distributors, OEM suppliers, and service firms should track the numbers that connect sales value to actual demand. The right scorecard should not stop at global market size. It should include product mix, regional share, end-use demand, efficiency adoption, motor-drive integration, and replacement timing.
| Metric | Why it matters |
|---|---|
| Global market value | Sets the overall revenue baseline |
| CAGR | Measures forecast momentum |
| Regional share | Identifies demand concentration |
| AC vs DC mix | Clarifies product demand |
| Fractional vs integral HP | Separates small and heavy-duty uses |
| Industrial demand | Links sales to factory activity |
| HVAC demand | Captures building-system replacement |
| Efficiency class adoption | Signals premium upgrade potential |
| EV motor demand | Tracks electrification growth |
| Drive attachment rate | Reveals system-level sales potential |
Sales Channels and Aftermarket Revenue
The aftermarket is especially important because the installed base is large and motor-driven systems operate for long hours. The U.S. assessment counted 52.5 million systems of at least 1 hp, which gives the replacement market a measurable base. When motors fail, lose efficiency, become incompatible with controls, or fall behind regulatory expectations, buyers do not always wait for a new equipment cycle. They replace or retrofit systems to reduce downtime, energy cost, and maintenance risk.
• OEM channels matter because motors are often specified inside pumps, compressors, HVAC units, vehicles, and machinery.
• Distributor channels matter because replacement buyers often need fast availability, cross-references, and service support.
• Service channels matter because many motor sales start with a reliability problem, not with a planned procurement cycle.
• Drive-and-control bundles matter because buyers increasingly evaluate the motor as part of a system.
• Aftermarket revenue matters because a large installed base turns maintenance, repair, replacement, and retrofits into recurring demand.
| Channel | Sales signal | Why it matters |
|---|---|---|
| OEM supply | Motors built into equipment | Creates design-in demand |
| Distribution | Replacement availability | Supports urgent orders |
| Service providers | Repair and retrofit | Captures installed base |
| System integrators | Motor + drive packages | Raises project value |
| Direct sales | Large industrial accounts | Supports specification control |
How to Read Electric Motor Statistics Without a Stat Dump
A statistics article works best when each number has a job. Global market value explains scale. CAGR explains speed. Regional share explains where demand is concentrated. Country-level data explains local industry structure. Motor type explains product mix. End-use data explains why buyers purchase motors. Energy-use statistics explain why efficiency matters. Risk statistics explain what can slow sales. Without that interpretation, even strong statistics feel mechanical.
For electric motor sales, the most useful approach is to group statistics by decision area. A manufacturer needs to know which motor types and regions are growing. A distributor needs to know which replacement categories move frequently. An industrial buyer needs to know where energy savings justify upgrades. A market analyst needs to compare product mix, region, country, and end use without confusing different market definitions.
• Market value should answer how large the opportunity is.
• Forecast CAGR should answer how quickly the opportunity is moving.
• Regional share should answer where sales concentration is strongest.
• End-use share should answer which industries are creating demand.
• Energy-use data should answer why replacement and efficiency upgrades matter.
• Risk signals should answer what can slow orders, compress margin, or delay projects.
| Statistic type | Best use in article | Avoid this mistake |
|---|---|---|
| Market size | Establish scale | Treating it as the whole story |
| CAGR | Explain speed | Ignoring forecast period |
| Regional share | Show geography | Mixing incompatible sources |
| Product mix | Explain sales quality | Assuming all motors grow equally |
| Energy use | Support replacement logic | Leaving it without operational context |
| Risk data | Balance the outlook | Only showing growth signals |
90-Day Electric Motor Sales Benchmark Plan
The first step is to compare the major market-size estimates and choose one scope for internal planning. For example, one dataset places the market at USD 152.2 billion in 2024 and USD 206.4 billion in 2029, while another places it at USD 180.31 billion in 2025 and USD 363.39 billion in 2035. Both are useful, but a team should not mix them without explaining the difference in scope and forecast period.
• Days 1-30: Build the baseline using market value, CAGR, regional share, product mix, and end-use demand.
• Days 31-60: Review application demand across pumps, fans, compressors, HVAC, automotive, water systems, and automation.
• Days 61-90: Build a market action scorecard covering target regions, channels, product categories, margins, and replacement triggers.
• Monthly review: Compare new orders against end-use demand, drive attachment, efficiency class, and service revenue.
• Quarterly review: Check whether material costs, lead times, capex delays, or regulatory changes are changing the forecast.
| Timing | What to review | Output |
|---|---|---|
| Days 1-30 | Market value, CAGR, region, product mix | Demand baseline |
| Days 31-60 | Applications, channels, end users, efficiency rules | Opportunity map |
| Days 61-90 | Country risk, channel strategy, margin pressure | Action scorecard |
| Monthly | Orders by product and end use | Sales pulse |
| Quarterly | Costs, lead times, regulation, capex | Risk update |
Source and Data Handling Notes
• Use one primary global forecast for the main market-size chart.
• Use regional and country rows as supporting signals, not as replacements for the global forecast.
• Use U.S. DOE/NEMA-style energy rows to explain replacement and efficiency demand.
• Use product-type rows to explain sales mix and premium-growth areas.
• Use source URLs in the Excel workbook as the traceable evidence base.
| Data area | Recommended use | Article treatment |
|---|---|---|
| Global forecast | Main market scale | Use in executive and forecast sections |
| Regional data | Demand geography | Use with careful source notes |
| Country data | Local industry structure | Use as signals, not rankings only |
| Installed-base energy | Efficiency logic | Use to explain replacement value |
| Product segments | Sales mix | Use to compare standard and premium demand |
Buyer Decision Factors Behind Electric Motor Sales
Electric motor purchases usually come from one of four decision moments: new equipment design, planned replacement, emergency failure, or efficiency retrofit. Each moment creates a different sales conversation. OEM design is focused on performance, size, reliability, cost, and supply continuity. Planned replacement is focused on downtime avoidance, compatibility, and energy savings. Emergency replacement is focused on availability and speed. Efficiency retrofit is focused on lifecycle cost, rebates, controls, and measurable payback.
This is why statistics about energy consumption are so useful. When U.S. industrial and commercial motor systems consume 1,079 TWh per year, the market is not only buying motors as hardware. It is buying operating efficiency. When industrial motor systems represent 69% of industrial sector electricity consumption, the buyer decision often moves beyond procurement into engineering, finance, sustainability, and operations. A replacement motor may be justified because it reduces power consumption, prevents downtime, improves control, or helps a facility meet internal energy targets.
• New equipment buyers focus on specification, reliability, cost, and supply continuity.
• Replacement buyers focus on compatibility, availability, downtime risk, and service support.
• Efficiency buyers focus on lifecycle cost, power use, utility savings, and drive control.
• Automotive and automation buyers focus on compact design, precision, weight, responsiveness, and supply security.
• Industrial buyers focus on uptime, duty cycle, harsh environments, and long-term maintenance cost.
Regional Electric Motor Sales Signals
Regional strategy should not use the same message everywhere. Asia Pacific is a scale and OEM-demand region, North America is a replacement and efficiency region, Europe is a regulation and automation region, and emerging markets are more infrastructure-led.
The numbers support that split. Asia Pacific accounts for 38.14% of global market share in 2025. Europe is an upgrade market, with the workbook showing USD 42.8 billion in 2025 and USD 79.6 billion by 2035. The United States is a mature replacement market, with USD 24.35 billion in 2025 and USD 33.39 billion by 2031. Japan’s path from USD 9.7 billion in 2025 to USD 48.7 billion by 2034 reflects a different country-level growth model and source scope.
Across regions, the same motor category can carry different sales meaning. A pump motor in North America may represent a replacement-and-efficiency decision, while the same category in an emerging infrastructure market may represent new capacity. That difference is why regional statistics need to be paired with application, channel, and replacement context.
Channel and Replacement Demand Signals
Electric motor sales depend on how the buyer enters the market. OEM demand is planned around specifications, production schedules, supplier reliability, and platform design. Replacement demand is more urgent because it is shaped by installed-base age, service access, downtime risk, compatible inventory, and the ability to pair the motor with a drive or control upgrade.
The installed-base numbers make this section important. A market with 52.5 million U.S. motor systems of at least 1 hp has a deep replacement pool even when new equipment demand slows. In practice, maintenance teams compare repair cost, energy loss, downtime exposure, and replacement availability before deciding whether to repair, replace, resize, control, or upgrade a system.
Pricing, Margin, and Service Signals
Pricing discipline is another important way to read electric motor statistics. A high-growth category does not always create the strongest margin if buyers treat the motor as a commodity part. Better margin potential appears when the sale includes specification support, efficiency justification, drive compatibility, emergency availability, application engineering, or service coverage.
Material exposure also shapes the economics. Copper, steel, rare-earth magnets, electronics, and logistics can change true margin performance. When input costs rise, suppliers with stronger application knowledge, documentation, and service support are often in a better position than suppliers competing only on price.
The strongest electric motor companies usually connect three layers: installed base, replacement trigger, and value-added upgrade. The installed base defines the opportunity pool. The replacement trigger explains why the buyer acts now. The value-added upgrade explains why the order can move beyond a basic motor sale toward a higher-efficiency, drive-ready, service-supported, or system-level solution.
What Stronger Channel Signals Mean
Channel signals help explain why a mature electric motor market can still create meaningful growth. Replacement-heavy demand may not expand as quickly as EV or automation categories, but it can produce steady orders when service teams know which applications are aging, which frame sizes move quickly, and which customers need faster repair options.
Suppliers should compare account quality with order volume. Buyers that need technical documentation, efficiency proof, duty-cycle guidance, and service support may create more lifetime value than buyers focused only on the lowest upfront price. That is especially true in pumps, compressors, HVAC equipment, refrigeration, conveyors, water systems, and process machinery, where downtime and energy use shape the buying decision.
The result is a cleaner forecast view: fewer generic orders, clearer service triggers, and better separation between volume growth and value growth. That distinction keeps the sales story practical, measurable, and easier to update.
Electric Motor Sales Market Statistics FAQ
How big is the electric motor sales market?
One major dataset places the global electric motors market at USD 152.2 billion in 2024 and forecasts USD 206.4 billion by 2029. A broader dataset places the electric motor market at USD 180.31 billion in 2025 and forecasts USD 363.39 billion by 2035. The difference reflects scope, but both show a large market with continued expansion.
What is the expected CAGR for electric motor sales?
The near-term forecast used in this workbook shows a 6.3% CAGR from 2024 to 2029. Another broader forecast shows a 7.26% CAGR from 2025 to 2035. The useful reading is that growth remains steady because electric motors are tied to industrial systems, building upgrades, transportation electrification, and energy-efficiency replacement.
Which region leads electric motor sales?
Asia Pacific is one of the strongest scale regions. One dataset places Asia Pacific at 38.14% global share in 2025, and another places Asia Pacific electric motor market size at USD 63.34 billion in 2025. Manufacturing scale, infrastructure spending, China’s production base, India’s industrial expansion, and Japan’s automation demand all support the region.
What industries use the most electric motors?
The largest use cases are industrial machinery, HVAC, pumps, fans, compressors, transportation, appliances, water systems, oil and gas, and robotics. Industrial motor systems are especially important because U.S. industrial motor systems consume 546,963 GWh per year and account for 69% of industrial sector electricity consumption in the assessment.
Are AC motors or DC motors larger in sales?
AC motors remain a core category because they are widely used in pumps, fans, compressors, conveyors, and industrial equipment. The U.S. dataset places AC induction motors at 62.78% market share in 2025, while a global AC electric motor dataset places the category at USD 84.33 billion in 2024 and USD 155.68 billion by 2032.
How do efficiency regulations affect motor sales?
Efficiency regulation raises minimum performance expectations and encourages replacement of older systems. Motor buyers also evaluate lifecycle cost, because electricity consumption over a motor’s operating life can exceed the original equipment cost. That is why IE3, IE4, NEMA Premium, EU Ecodesign, DOE rules, and variable-speed drives matter for sales.
Why are HVAC and pump motors important?
HVAC and pump motors are important because they run for long hours and appear in large installed bases. U.S. commercial motor systems consume 532,016 GWh per year, while refrigeration compressors, fans, blowers, and pumps together account for 94% of commercial motor electricity consumption in the assessment.
How does EV growth affect electric motor sales?
EVs and hybrids raise both the number and value of motors used in vehicles. Traction motors, e-axles, thermal-management systems, pumps, fans, and auxiliary motors all contribute. In the workbook, derived transportation motor market size rises from USD 52.99 billion in 2026 to USD 87.92 billion in 2033.
Which companies lead the electric motor market?
The competitive landscape includes global industrial and automation suppliers such as ABB, Siemens, WEG, Nidec, Regal Rexnord, TECO, Toshiba, Johnson Electric, Wolong, Schneider Electric, Rockwell Automation, and Yaskawa. Sales channels include OEM specifications, distributors, service providers, replacement channels, and motor-drive bundles.
What is the electric motor sales outlook through 2030?
The outlook is positive because demand is supported by automation, HVAC replacement, industrial modernization, EVs, efficiency rules, and motor-drive integration. By 2030, the market is likely to focus more on efficient, controlled, connected, and application-specific systems than on standard motor replacement alone.
The final reading should stay practical: market size explains scale, while replacement timing, channel behavior, service needs, and system-level upgrades explain where value is created.
Market value explains scale, while applications, replacement timing, channel behavior, and service economics explain where suppliers can protect margins and build repeatable account value.
Final Takeaway
Electric motor sales statistics point to one clear conclusion: this is a mature market with a large installed base, but it is still being reshaped by efficiency, automation, electrification, and regional manufacturing scale. The headline market values are large, with one dataset moving from USD 152.2 billion in 2024 to USD 206.4 billion by 2029, and another moving from USD 180.31 billion in 2025 to USD 363.39 billion by 2035. Those numbers show a category with both stable replacement demand and longer-term growth.
The deeper story is product and application mix. AC motors remain a core installed-base category, while BLDC, servo, permanent-magnet, variable-speed, and high-efficiency systems show where premium demand is increasing. Industrial systems, HVAC equipment, pumps, compressors, refrigeration, water systems, and transportation all use motors differently, so the strongest sales strategies connect the motor to the application problem: uptime, energy savings, comfort, mobility, automation, or infrastructure reliability.
For market leaders, the next step is measurement. Track market value, CAGR, regional share, product mix, end-use demand, efficiency adoption, EV motor demand, drive attachment, replacement cycles, and service revenue. The strongest companies will not only sell motors. They will connect motor sales to operating cost, reliability, controls, automation, electrification, and aftermarket support.


