Food trucks have moved from occasional street vendors into a measurable foodservice market. The model sits between restaurants, catering, events, tourism, nightlife, campuses, breweries, and neighborhood dining. A food truck can test a menu without a full dining room, follow high-traffic locations, serve private events, and build a local brand with a smaller fixed footprint than many brick-and-mortar restaurants.
The strongest statistics show why the category deserves its own scorecard. Grand View Research values the global food trucks market at USD 5.79 billion in 2025 and forecasts USD 7.87 billion by 2030. Technavio expects the category to add about USD 2.28 billion from 2026 to 2030, while BLS data shows U.S. mobile food services employment reached 44,119 workers in 2024, about ten times its 2000 level. IBISWorld reports the U.S. food truck market at about USD 2.8 billion, making the country one of the clearest mature markets.
The useful way to read food truck statistics is to separate market size, operating economics, location strategy, menu mix, payments, regulation, labor, regional demand, and country-level rules. A growing market does not automatically make a profitable truck. The better benchmark is whether a mobile food operator can turn route access, event demand, menu speed, compliance, and repeat customers into reliable daily revenue.
Executive Food Truck Benchmarks
These benchmarks frame the article at a glance. They show the size of the market, the pace of forecast growth, the scale of U.S. activity, and the operating constraints that shape whether growth becomes profit.
The numbers that define the food truck market
• Grand View Research places the global food trucks market at USD 5.79 billion in 2025.
• The same forecast expects global revenue to reach USD 7.87 billion by 2030.
• The global market is expected to grow at a 6.3% CAGR from 2025 to 2030.
• Technavio projects a USD 2.28 billion increase in the food trucks market from 2026 to 2030.
• Technavio places growth momentum at a 7.6% CAGR and identifies Europe as a major contributor to forecast expansion.
• IBISWorld reports the U.S. food truck market at about USD 2.8 billion in 2024 and 2025.
• Grand View Research values the U.S. food truck services market at USD 2.01 billion in 2025 and forecasts USD 3.56 billion by 2033.
• BLS reports 44,119 U.S. mobile food services employees in 2024.
• BLS says U.S. mobile food services employment increased 907% from 2000 to 2024.
• IBISWorld counts 92,257 U.S. food truck businesses in 2025, up 16.9% from 2024.
• Food trucks benefit from events, festivals, concerts, parades, brewery partnerships, office districts, campuses, and tourism zones.
• The largest risks are not only demand-related; operators must manage permits, parking, food safety, fire rules, labor, fuel, repair downtime, and event fees.
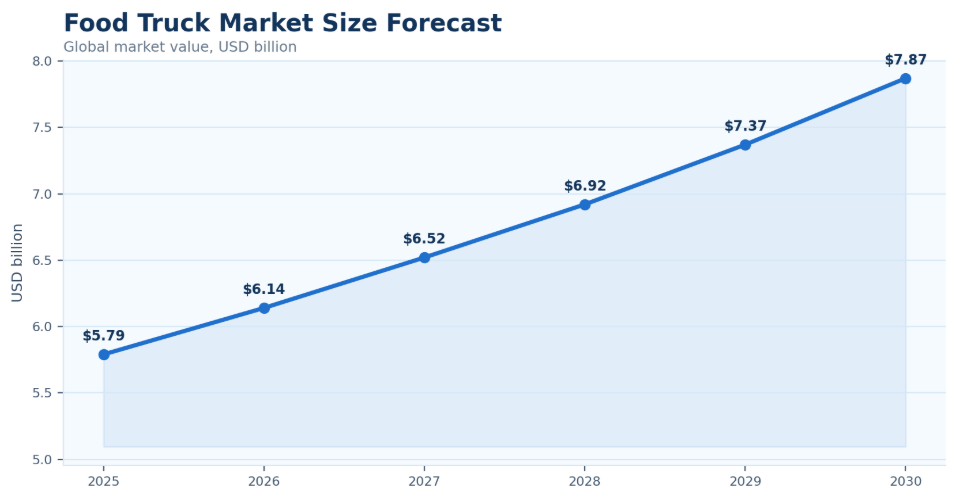
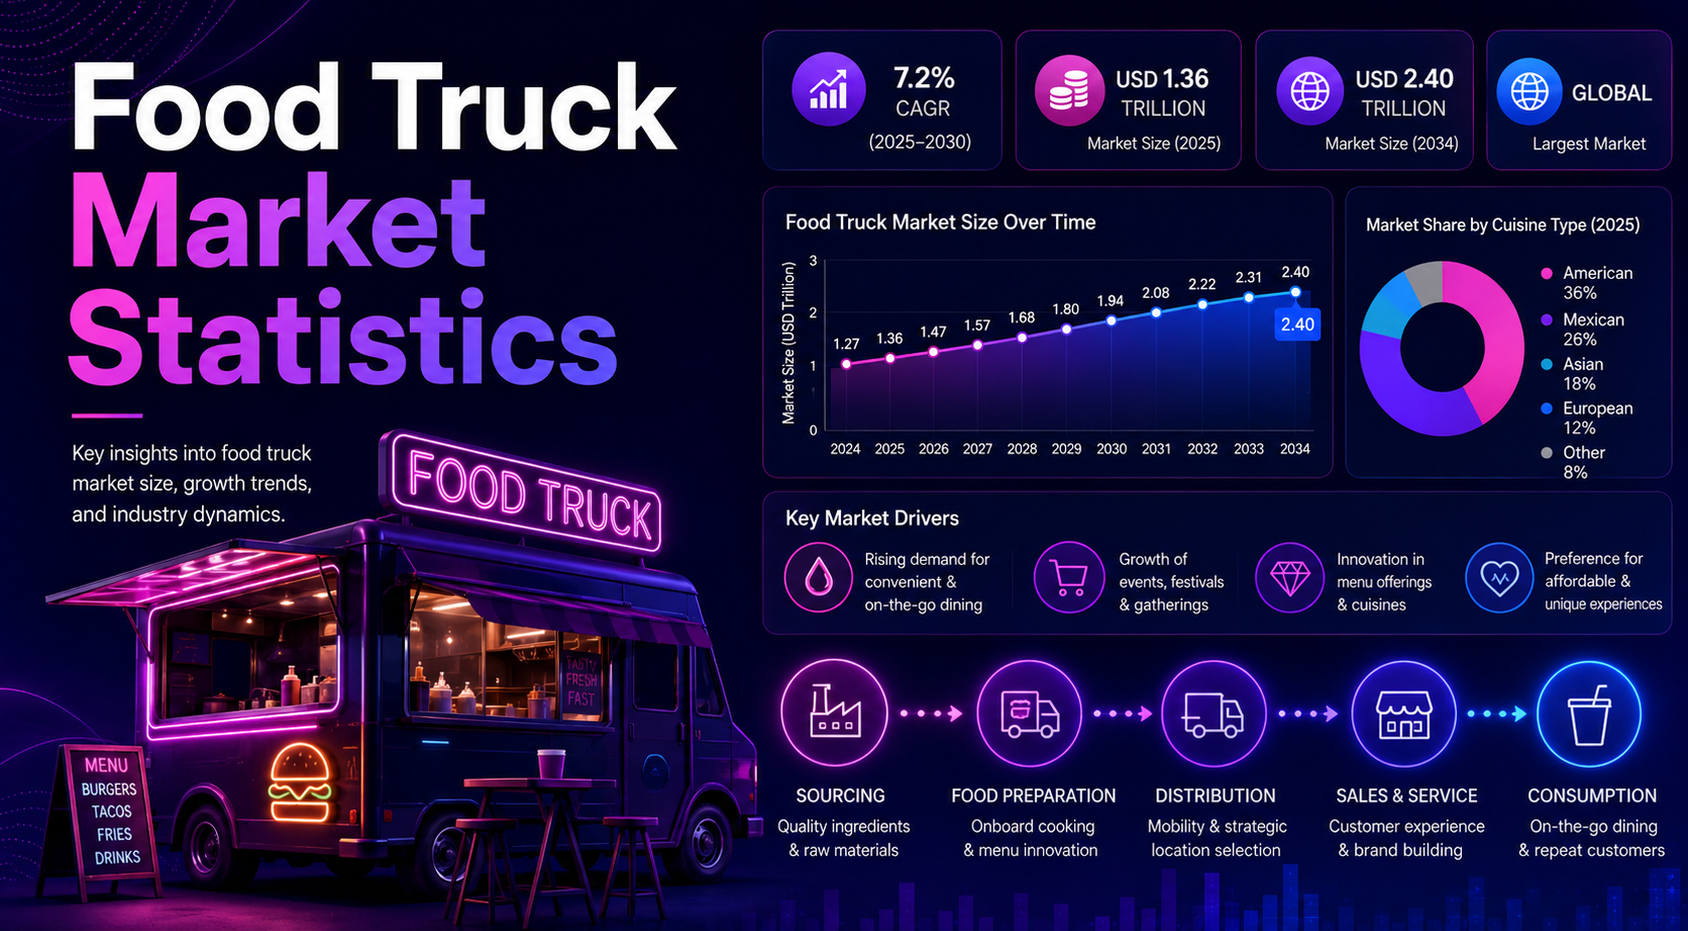
Figure 1. Food truck market size and forecast show how mobile foodservice is becoming a measurable foodservice category rather than only a small-business niche.
Editorial readout:
Food truck growth is not only a street-food story. The market is driven by mobile real estate, events, low-format flexibility, local regulation, labor economics, and consumers looking for faster, local, and experience-led foodservice.
Why Food Trucks Carry Foodservice Market Value
Food trucks carry market value because they convert mobility into foodservice access. A restaurant is tied to one lease, one street, and one surrounding demand pool. A truck can move across lunch routes, festivals, farmers markets, business parks, breweries, private events, campuses, and late-night districts. That flexibility gives operators a different way to reach demand, but it also creates a different operating discipline.
The value of the model comes from a smaller footprint and more flexible route design. A truck can start as a single-unit concept, test a menu, build a local following, and then expand into catering, a second truck, a food hall stall, or a permanent restaurant. For cities, trucks can add food diversity without requiring new restaurant space. For event organizers, trucks add fast, modular food capacity without building permanent kitchens.
At the same time, food truck value is not automatic. The business works only when operating windows are dense enough to offset travel, setup, commissary, staffing, fuel, parking, and compliance costs. A truck that misses the right lunch rush or pays too much for event access may struggle even in a growing market. That is why food truck statistics should be read through both market growth and daily operating quality.
| Scale driver | What it shows | Implication |
|---|---|---|
| Lower fixed footprint | Less dependence on permanent restaurant real estate | Supports entry, testing, and small-format expansion |
| Event demand | Sales tied to festivals, concerts, campuses, and private gatherings | Creates high-volume windows but adds fee and weather risk |
| Urban dining | Demand concentrated where people work, study, travel, or gather | Makes route planning as important as menu planning |
| Menu innovation | Trucks can test cuisines and limited menus quickly | Supports differentiation and lower inventory complexity |
| Brewery partnerships | Taprooms use trucks to add food without kitchens | Creates recurring location partnerships |
| Regulation and permits | City rules decide where trucks can operate | Turns compliance into a market-access variable |
Editorial readout:
Food trucks protect flexibility only when location access, permits, prep, staffing, and service speed work together. The truck is mobile, but the business still depends on reliable demand windows.
Food Truck Market Size and Forecast Statistics
Market-size statistics need careful reading because food truck reports use different boundaries. Some estimates focus on food truck services, while others include mobile foodservice, street vending, truck platforms, vehicle outfitting, franchise formats, and related equipment. These definitions can change the size of the reported market without changing the underlying direction: demand is expanding in major cities, events, and informal dining occasions.
The most useful pattern is steady growth rather than one perfect number. Grand View Research provides a service-market view. Technavio emphasizes forecast expansion and regional contribution. Global Market Insights uses a broader food truck market framing that produces a higher long-range total. IBISWorld and BLS add U.S. evidence through revenue, business count, and employment. Together, those statistics show both demand and operating activity.
Market-size and forecast benchmarks
• The global food trucks market is valued at USD 5.79 billion in 2025.
• Global food truck revenue is forecast to reach USD 7.87 billion by 2030.
• The market is expected to grow at a 6.3% CAGR from 2025 to 2030.
• An alternate market estimate places global food truck value at USD 6.1 billion in 2024.
• That broader estimate expects the market to reach USD 11.9 billion by 2034.
• Technavio projects USD 2.2785 billion in market growth from 2026 to 2030.
• Technavio places market momentum at a 7.6% CAGR for 2025 to 2030.
• The U.S. food truck services market is valued at USD 2.01 billion in 2025 and is projected to reach USD 3.56 billion by 2033.
• Different benchmarks should be compared by scope, because service revenue, truck businesses, employment, and vehicle ecosystems are not identical measures.
| Market definition | Scope | How to use it |
|---|---|---|
| Food truck services | Revenue from operators selling food from mobile units | Use for service-market sizing and forecast framing |
| Mobile food services | Food trucks, carts, and related mobile preparation/serving formats | Use for employment and labor trend analysis |
| Street food vehicles | Trucks, trailers, carts, and location-based street vending | Use for urban demand and informal competition analysis |
| Event food trucks | Trucks serving festivals, concerts, weddings, campuses, and corporate events | Use for high-volume demand-window analysis |
| Franchise food trucks | Mobile units attached to franchise or multi-unit concepts | Use for scalability and brand expansion analysis |
| Food truck ecosystem | Vehicles, outfitting, platforms, equipment, services, and operators | Use carefully because it can produce broader market totals |
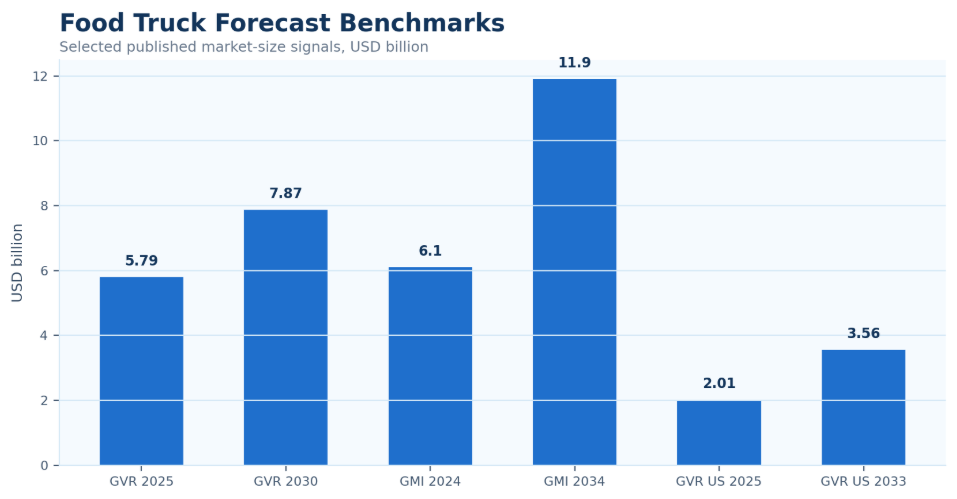
Figure 2. Forecast benchmarks show why food truck market size should be read by scope, region, and service definition.
Editorial readout:
Market-size estimates should be used by definition. A food truck services estimate is not the same as a vehicle, equipment, platform, or full street-food ecosystem estimate.
U.S. Food Truck Market Statistics
The United States is one of the clearest mature food truck markets because it combines large metropolitan demand, festival culture, private events, breweries, campuses, tourism districts, and a visible mobile-food business base. U.S. data is especially useful because employment and business counts show that mobile foodservice is more than a small culinary trend.
The U.S. market also shows the importance of regulation. Cities can differ sharply in permit availability, parking rules, distance rules near restaurants, commissary requirements, fire inspections, and service hours. A truck can perform well in one city and face major barriers in another. For that reason, national market growth should be paired with local operating analysis.
U.S. market and employment benchmarks
• IBISWorld reports the U.S. food truck market at USD 2.8 billion in 2024.
• IBISWorld also indicates U.S. industry revenue is expected to reach about USD 2.8 billion in 2025.
• The U.S. food truck industry grew at an annualized 13.2% rate over the five years to 2025 in one IBISWorld benchmark.
• IBISWorld counts 92,257 food truck businesses in the United States in 2025.
• The U.S. business count increased 16.9% from 2024 to 2025 in the same benchmark.
• Grand View Research values the U.S. food truck services market at USD 2.01 billion in 2025.
• Grand View Research forecasts the U.S. food truck services market to reach USD 3.56 billion by 2033.
• The U.S. services market is expected to grow at a 7.5% CAGR from 2026 to 2033.
• BLS reports 44,119 employees in U.S. mobile food services in 2024.
• BLS says mobile food services employment was about 10 times its 2000 level and increased 907% from 2000 to 2024.
| U.S. operating signal | Signal | Why it matters |
|---|---|---|
| Business count | Number of food truck businesses operating in the market | Market participation and competition |
| Employment | Workers in mobile food services | Expansion in operating activity |
| Revenue per operator | Sales divided by business or truck base | Helps separate growth from overcrowding |
| Permit access | Availability and cost of local permits | Determines whether trucks can reach demand |
| Event bookings | Private and public event sales windows | Can stabilize revenue beyond street routes |
| Labor availability | Ability to staff prep and service windows | Controls operating hours and service speed |
| Fuel and repairs | Truck, generator, and maintenance cost | Controls uptime and margin |
| Food safety inspections | Health and handling compliance | Protects consumer trust and operating license |
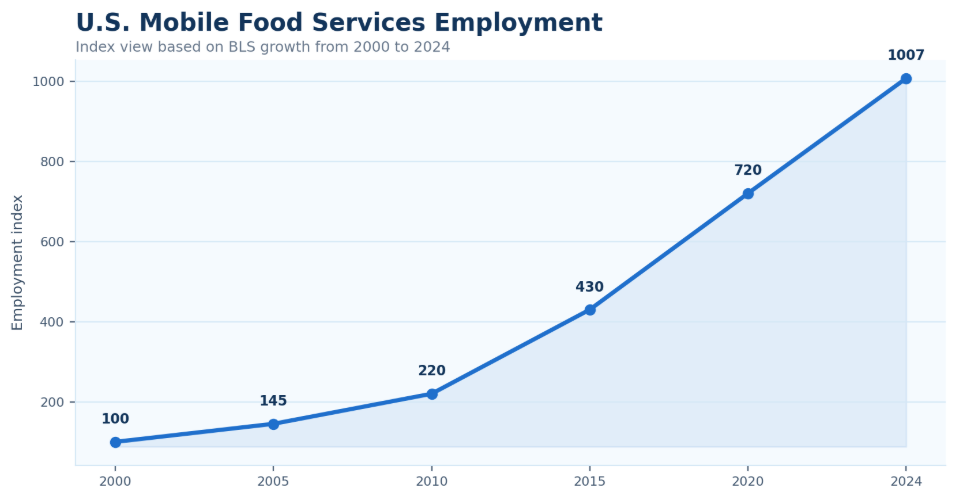
Figure 3. U.S. mobile food services employment growth shows how food trucks and related mobile formats have moved from niche activity into a measurable labor category.
Editorial readout:
The U.S. food truck market is large, but not uniform. A truck serving festival routes faces a different business model from one serving office lunches, campuses, residential events, or late-night entertainment districts.
Startup Cost and Operating Economics
Food truck economics are different from restaurant economics. The model can reduce rent exposure, but it replaces that fixed footprint with truck acquisition, outfitting, fuel, maintenance, commissary access, parking, event fees, permits, labor, and route planning. Operators also need enough uptime to use the truck as a revenue-producing asset rather than a repair-heavy vehicle.
Startup cost depends heavily on whether the operator buys a new custom truck, leases a vehicle, purchases a used truck, converts a trailer, or begins with a smaller cart or pop-up model. New builds can support better workflow, equipment compliance, and reliability. Used trucks can reduce entry cost but may increase repair risk, downtime, and layout limitations. The cheapest truck is not always the lowest-risk truck.
Operating margin depends on how quickly the truck can serve orders during high-demand windows. A menu with slow prep or too many SKUs can reduce order throughput. Event fees can be worth paying if the event produces high traffic, but they can also erase profit when weather, crowd flow, or competition is weaker than expected. For that reason, food truck operators should measure cost per sales window, not just monthly expenses.
Cost benchmarks food truck owners should separate
• Truck purchase, lease, or conversion cost is the largest visible startup category for many operators.
• Kitchen equipment, ventilation, refrigeration, water systems, generators, and fire safety features can materially change buildout cost.
• Permits, business licenses, health approvals, fire inspection, insurance, and commissary access are not optional operating inputs.
• Recurring costs include food inventory, labor, fuel, repairs, commissary rent, event fees, parking, payment processing, and marketing.
• Used trucks may lower entry cost while raising maintenance and downtime risk.
• Private events and catering can reduce dependence on daily street traffic and weather-sensitive walk-up sales.
• Food truck profitability depends on route quality, order speed, menu margin, staffing efficiency, repeat customers, and low downtime.
| Cost category | Track | Why it matters |
|---|---|---|
| Truck acquisition | Purchase, lease, financing, conversion, depreciation | Sets entry cost and future flexibility |
| Kitchen equipment | Cooking, cooling, ventilation, water, power, safety | Determines menu capability and compliance |
| Permits and licenses | Business, vending, health, fire, event approvals | Controls where and when the truck can sell |
| Commissary fees | Prep, storage, water, waste, parking support | Adds recurring overhead and compliance support |
| Fuel and maintenance | Fuel, generator, tires, repairs, inspections | Protects uptime and daily route reliability |
| Labor | Prep, cooks, service, driver, owner hours | Controls speed, hours, and service quality |
| Food cost | Ingredients, waste, inventory shrink | Determines menu margin |
| Event fees | Application, booth, revenue share, vendor fees | Must be compared with event sales potential |
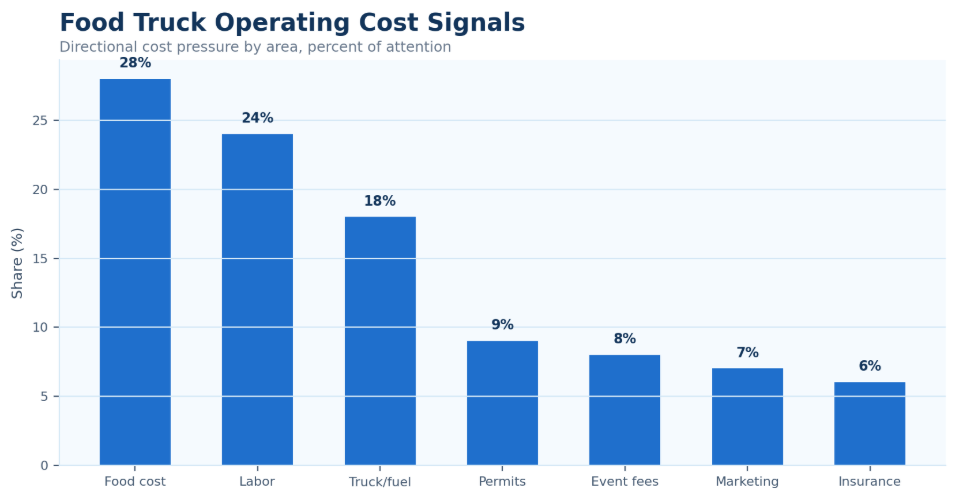
Figure 4. Food truck cost pressure should be measured across food cost, labor, truck uptime, permits, event fees, insurance, and marketing rather than only vehicle cost.
Editorial readout:
Food truck profitability depends less on headline market size and more on route quality, event access, menu margin, labor control, uptime, and repeat demand.
Cuisine and Menu Segment Statistics
Cuisine mix is one of the most important operating variables in food trucks because menu design determines prep complexity, service speed, food cost, storage needs, equipment choices, and customer positioning. A truck with a small, focused menu can often serve faster and control inventory better than a truck trying to behave like a full restaurant kitchen.
Fast food, tacos, sandwiches, burgers, barbecue, Asian fusion, coffee, desserts, pizza, vegan meals, and gourmet fusion concepts are all visible food truck formats. The best format is not simply the trendiest one. A strong menu has enough appeal to draw customers, enough speed to handle queues, enough margin to cover location fees, and enough simplicity to fit a compact kitchen.
Events often require a different menu from daily street routes. A festival menu may need fewer SKUs, faster prep, more handheld items, and strong signage. A corporate lunch route may reward meal combos and predictable ticket times. A brewery route may favor shareable, salty, or late-afternoon items. Menu statistics should therefore be interpreted through the sales occasion.
Food truck segment benchmarks
• Fast food and street food remain core food truck categories because they match quick service and high foot traffic.
• Tacos, burgers, sandwiches, barbecue, pizza, Asian fusion, desserts, and coffee are common scalable truck menus.
• Limited menus help operators control speed, prep, inventory, storage, and waste.
• High-margin beverages and desserts can improve average order economics when equipment and traffic fit the concept.
• Specialty cuisine helps trucks differentiate in crowded urban markets and event environments.
• Private event menus often need simple, fast, and predictable options compared with daily street service.
• Menu mix should be evaluated by food cost, ticket size, prep time, order speed, waste, and repeat purchase behavior.
| Cuisine format | Where it works | Implication |
|---|---|---|
| Tacos and Mexican food | Street routes, festivals, nightlife, campuses | Strong handheld format and flexible price points |
| Burgers and sandwiches | Office lunch, events, brewery routes | High familiarity but needs speed and heat control |
| Barbecue | Events, festivals, destination routes | Strong demand but prep and holding complexity matter |
| Asian fusion | Urban routes, food truck parks, campuses | Differentiates menu but may require ingredient planning |
| Coffee and beverages | Mornings, campuses, markets, business districts | Can support recurring routes and high-margin add-ons |
| Desserts and frozen treats | Festivals, family events, tourism zones | Seasonality and weather sensitivity matter |
| Vegan and health-focused | Urban and campus markets | Clear positioning, but demand depends on neighborhood fit |
| Gourmet fusion | Events and destination locations | Premium pricing possible but menu complexity must be controlled |
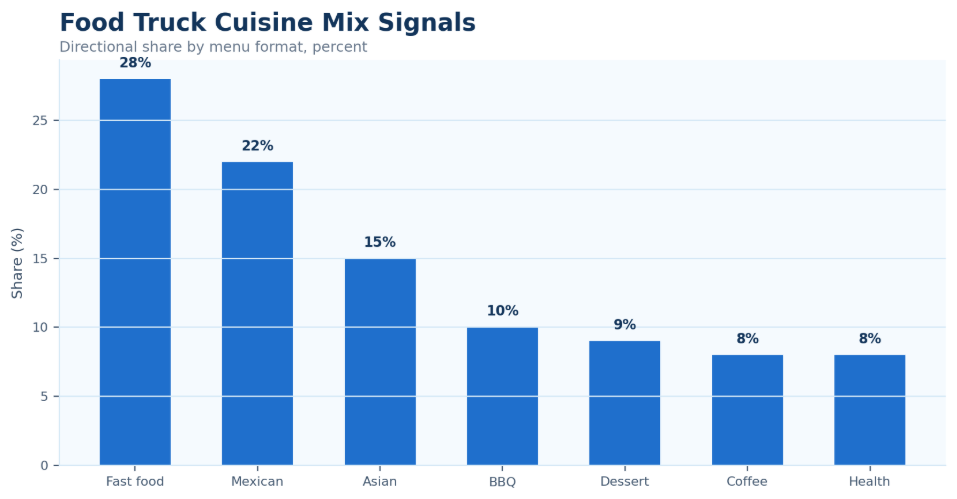
Figure 5. Cuisine mix data should be read with menu speed, ticket size, food cost, and event suitability.
Editorial readout:
Menu strategy is an operating statistic. The best-selling concept is not always the most profitable concept if prep time, waste, ticket speed, or labor complexity rises.
Consumer Demand and Location Statistics
Food trucks perform best where food occasions, foot traffic, and dwell time overlap. A crowd is not enough if people are moving too quickly, already fed, or unable to stop. A successful truck needs the right time of day, enough visibility, a clear menu, short wait times, and permission to operate in the location where demand exists.
Location strategy is the closest food truck equivalent to restaurant real estate. Office districts can support weekday lunch demand. Campuses can support recurring student traffic. Breweries can create evening and weekend partnerships. Festivals can produce large sales windows but carry weather and vendor-fee risk. Residential communities and private events can stabilize revenue when street traffic is inconsistent.
Food truck parks and night markets create destination demand, but they can also increase direct competition. The advantage is that customers arrive expecting multiple truck options. The risk is that trucks compete side by side and sales depend on placement, cuisine mix, wait times, and event marketing. Operators should measure each location by sales per hour, gross margin, event fee share, customer reviews, and repeat booking potential.
Where food truck demand concentrates
Food trucks perform best where foot traffic, dwell time, and eating occasions overlap.
Events can generate high-volume sales but may include vendor fees, weather risk, and direct competition.
Breweries and taprooms often use food trucks as flexible foodservice partners without building kitchens.
Food truck parks create destination demand but require strong differentiation and reliable speed. Office districts can support lunch demand, while entertainment zones can support evening and late-night demand.
Private events, weddings, corporate gatherings, and catering can stabilize revenue beyond street routes.
Location strategy often matters more than total city population because demand is hyperlocal and time-sensitive.
| Location type | Demand signal | Risk / constraint |
|---|---|---|
| Office district | Weekday lunch demand and repeat customers | Remote work and short lunch windows can reduce traffic |
| College campus | Recurring student demand and event calendars | School seasonality and permit rules matter |
| Festival | High-volume crowds and event discovery | Weather, fees, and competition can erase margin |
| Brewery or taproom | Recurring partnership and evening traffic | Menu must fit beverage occasion and crowd size |
| Food truck park | Destination traffic and customer variety | Direct competition is high |
| Tourist area | Strong foot traffic and impulse demand | Permits, seasonality, and pricing sensitivity matter |
| Residential community | Neighborhood loyalty and private bookings | Demand may be too small without schedule consistency |
| Private event | Pre-booked revenue and predictable headcount | Requires logistics, staffing, and menu planning |
Editorial readout:
A food truck is mobile, but revenue is still location-dependent. The strongest operators treat routes, event calendars, and partnerships as their real estate strategy.
Technology, Payments, and Ordering
Technology helps food trucks behave more like data-led restaurants. A mobile POS system can track sales by location, time, item, and staff member. Digital payments reduce cash handling and can speed up ordering. Online preorders can reduce queues, while social media tells customers where the truck is parked. These tools matter because a truck often has fewer hours to capture demand than a fixed restaurant.
Technology also changes customer expectations. Consumers increasingly expect card, wallet, and contactless payment options. They may search social media or maps before visiting. They may check menus, reviews, event calendars, or ordering links. A truck that is difficult to find online may lose sales even if the food is strong.
The best technology stack is not the most complex. It is the stack that improves location visibility, order speed, menu clarity, repeat visits, and margin. Delivery apps can expand reach, but fees may reduce profitability. Preordering can improve service flow, but timing must be managed carefully because trucks have limited space and small crews.
Technology benchmarks operators should track
• Digital payments reduce cash handling and help speed service during short demand windows.
• POS data helps operators compare locations, peak hours, average ticket size, and item-level margin.
• Social media remains central because customers need to know where the truck will be and when it is open.
• Online preorders can reduce queues, but they can create pickup timing pressure in small kitchens.
• Delivery apps can expand reach but may reduce margin through commissions and operational complexity.
• Loyalty programs work best for recurring locations such as office parks, campuses, neighborhoods, and breweries.
• QR menus and digital menu boards help trucks change menus faster than printed signage.
| Technology area | Improves | Measure |
|---|---|---|
| POS system | Sales tracking, item performance, payment speed | Average ticket, orders per hour, item margin |
| Digital payments | Customer convenience and faster transactions | Payment mix, queue time, failed payments |
| Online ordering | Preorders and reduced wait time | Pickup timing, order accuracy, kitchen load |
| Social media | Location visibility and event promotion | Followers, reach, route response, repeat visits |
| Loyalty tools | Repeat customer behavior | Return rate, offer redemption, visit frequency |
| Delivery platforms | Off-site reach and order volume | Commission cost, delivery accuracy, net margin |
| Inventory tools | Ingredient control and waste reduction | Waste, stockouts, food cost variance |
| Event booking platforms | Access to private and public events | Booking value, event fee, conversion to repeat work |
Editorial readout:
Technology helps food trucks behave more like data-led restaurants, but the best tools are the ones that improve speed, repeat visits, location visibility, and margin.
Regional Food Truck Market Intelligence
Regional food truck data matters because global averages hide very different operating systems. North America is scale-led and business-count rich. Europe is event, festival, and urban-market led. Asia Pacific combines street-food culture, urbanization, and high mobile-dining familiarity. Latin America blends affordability, local cuisine, and urban events. Middle East and Africa demand often depends on malls, tourism, outdoor dining seasons, and event partnerships.
Technavio identifies Europe as a major contributor to food truck market growth, while also listing countries across North America, Europe, Asia Pacific, Latin America, and Middle East and Africa as key markets. That regional list is important because food truck success is highly local. The same truck format can face different rules, different competition, different weather, and different consumer expectations by country and city.
Regional benchmarks and market signals
• Europe is identified by Technavio as contributing 39.7% of forecast market growth in its food truck market model.
• North America remains one of the clearest scale regions because the United States has large market revenue, business count, and employment evidence.
• Canada supports food truck activity in major cities, festivals, seasonal markets, and private events.
• Mexico combines a strong street-food culture with formal and informal mobile food competition.
• Asia Pacific demand is shaped by urbanization, younger consumers, tourism, street-food culture, and large city density.
• Mordor Intelligence identifies Asia Pacific as the fastest-growing region in one food truck market forecast, with a 10.50% CAGR through 2031.
• Latin America is shaped by affordability, local cuisine, food events, tourism zones, and urban casual dining.
• Middle East and Africa food truck demand is shaped by tourism, malls, entertainment districts, climate, and event permissions.
| Region | Signal | Market implication |
|---|---|---|
| North America | Large U.S. market, strong events, breweries, campuses, and private catering | Scale exists, but city regulation and competition vary sharply |
| Europe | Street-food markets, festivals, tourism, and urban dining events | Event access and city rules shape market development |
| Asia Pacific | Street-food culture, urbanization, tourism, and mobile-first consumers | High growth potential, but formats vary by country |
| Latin America | Local cuisine, affordability, events, and informal competition | Price, permits, and cultural fit matter |
| Middle East & Africa | Malls, tourism, entertainment districts, outdoor events, and climate constraints | Seasonality, heat, and partnership access are important |
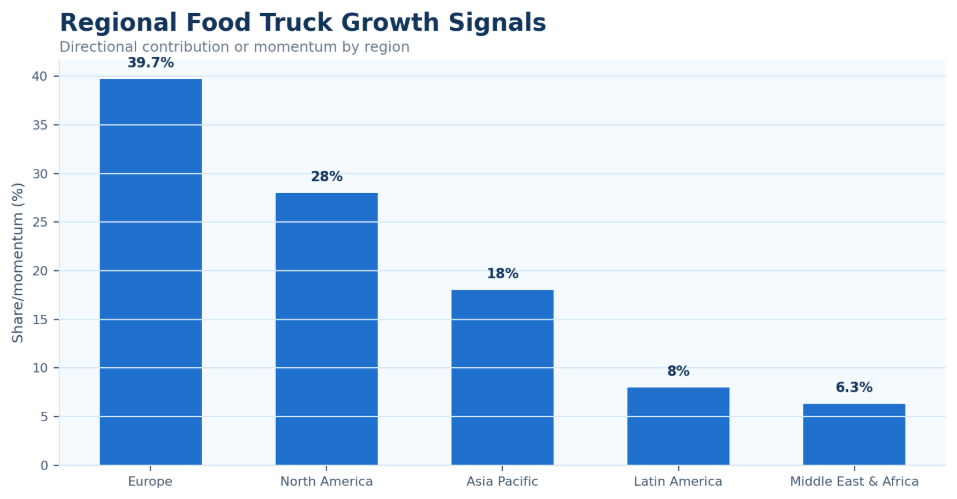
Figure 6. Regional food truck growth differs by city regulation, street-food culture, event density, climate, and consumer dining behavior.
Editorial readout:
gional food truck data should be read as an operating map. North America is scale-led, Europe is event-led, Asia Pacific is street-food and urbanization-led, Latin America is affordability-led, and Middle East and Africa demand depends heavily on events, tourism, and climate.
Country-Level Food Truck Statistics
Country-level food truck analysis turns global growth into operating decisions. A country with strong dining demand may still be difficult for food trucks if permits are limited, vending locations are restricted, or informal street-food competition is intense. Another country may have smaller total market size but strong event demand, tourism zones, or mall partnerships that support premium trucks.
The United States is the clearest mature market, but it is not the only important country. Canada, Mexico, the United Kingdom, Germany, France, Italy, Spain, the Netherlands, China, Japan, India, South Korea, Australia, Indonesia, Brazil, Argentina, Chile, Saudi Arabia, the UAE, South Africa, Turkey, and Israel all appear in relevant market-country coverage. Each country requires a different reading of permits, food culture, consumer price points, and event access.
Country analysis is especially useful for operators, franchise systems, manufacturers, and suppliers. A mobile-food brand may be scalable in one market because truck parks and festivals are common. It may need a different format in another market because carts, kiosks, night markets, or delivery platforms already dominate mobile food behavior. The operating question is not only whether consumers like street food; it is whether the truck format has legal access and profitable selling windows.
| Country | Food truck signal | Market implication |
|---|---|---|
| United States | Mature mobile-food market with strong event and metro demand | Permits, locations, labor, and uptime drive results |
| Canada | Major-city, festival, and seasonal demand | Weather windows and local vending rules matter |
| Mexico | Strong street-food culture and urban food demand | Formal trucks compete with established vendors |
| United Kingdom | Urban food markets, festivals, and office districts | Event access and city permissions shape sales |
| Germany | Street-food festivals and regulated urban events | Compliance and event approvals are important |
| France | Tourism, markets, and local food culture | Concept fit and permits influence adoption |
| India | Large street-food base and urban growth | Affordability and local rules shape formal trucks |
| Japan | Convenience, quality, and compact food formats | Precision, location access, and service speed matter |
| Australia | Markets, festivals, outdoor dining, and events | Seasonality and route distance affect planning |
| Brazil | Large urban dining culture and event demand | Price, permits, and location access matter |
| UAE | Tourism, malls, events, and premium concepts | Heat, venue partnerships, and timing shape demand |
| South Africa | Urban events and entertainment districts | Security, location access, and event density matter |
Editorial readout:
Country-level data prevents one-size-fits-all strategy. A food truck needs the right city rules, event access, cuisine fit, climate window, and customer habit before global growth becomes local revenue.
Regulation, Permits, and Food Safety
Regulation is one of the strongest forces in the food truck market because it determines where a truck can operate, how long it can park, what equipment it needs, how food must be stored, and which inspections are required. Unlike some restaurant rules that are relatively standardized, mobile vending rules are often city-specific. A truck operator must manage business licensing, mobile vending permits, health inspections, commissary requirements, parking rules, fire safety, wastewater disposal, and event permits.
Food safety is especially important because a food truck is a compact mobile kitchen. The truck must manage refrigeration, hot holding, cross-contamination, handwashing, wastewater, cleaning, and temperature control in a small space. Fire safety also matters because trucks may use propane, generators, fryers, grills, and electrical systems. Compliance protects consumers, but it also protects the operator’s ability to keep serving.
Permit scarcity can become a market barrier. A city may have strong demand but limited legal vending locations or a long waiting list for mobile food permits. A festival may attract thousands of customers but require high vendor fees, proof of insurance, and strict setup rules. Regulation should therefore be treated as a market-access statistic, not simply an administrative task.
Compliance benchmarks food truck operators must track
• Food truck regulation is usually local, not only national, which makes city-level compliance central.
• Cities may limit parking locations, vending hours, distance from restaurants, and access to high-demand districts.
• Health inspections are central because food is prepared, transported, held, and served in a mobile kitchen.
• Fire safety rules matter for propane systems, generators, fryers, ventilation, and onboard equipment.
• Commissary kitchen rules can affect prep, storage, water refill, cleaning, waste disposal, and parking.
• Event permits can create high-volume sales access but add paperwork, fees, insurance, and scheduling pressure.
• Compliance cost should be included in startup and operating economics because it can directly affect margin and expansion.
| Regulatory area | What it affects | Market impact |
|---|---|---|
| Mobile vending permits | Legal ability to sell in public or assigned areas | Controls location access and competition |
| Health inspection | Food handling, storage, sanitation, and temperature rules | Protects consumers and operating approval |
| Fire safety | Propane, fryers, generators, electrical systems, ventilation | Reduces risk and protects event access |
| Parking and zoning | Where and how long a truck can operate | Determines route quality |
| Commissary kitchen | Prep, storage, cleaning, water, and waste support | Adds cost but supports compliance |
| Wastewater disposal | Handling of water and waste from the truck | Protects sanitation and local approval |
| Insurance | Liability, vehicle, workers, event coverage | Often required for events and partnerships |
| Event permits | Festival and private-event access | Can unlock revenue but raises cost and complexity |
Editorial readout:
Regulation is not a side issue in food trucks. It determines where a truck can sell, how long it can operate, what equipment it needs, and whether the concept can scale across cities.
Laboure, Employment, and Owner Economics
Labor is one of the clearest signs that mobile foodservice has become a serious operating category. BLS data shows mobile food services employment reached 44,119 workers in 2024, about ten times the 2000 level. This growth reflects more than a small number of owner-operated trucks. It shows a broader category of cooks, cashiers, prep staff, drivers, event workers, and owner-managers.
Food trucks often look lean because crews are small, but a small crew can become a constraint. A two-person truck may control payroll, but it may also struggle with long lines, complex orders, event volume, and prep requirements. Larger crews can improve speed, but they raise labor cost and scheduling complexity. The right staffing model depends on order volume, menu complexity, sales window length, and event type.
Owner economics are also important. Owner-operated trucks can protect margin because the owner absorbs labor hours, but that can hide the real workload required to keep the business running. Multi-truck operators need more formal systems for training, route scheduling, commissary prep, maintenance, purchasing, payroll, and compliance. Employment growth shows the category is expanding, but profitability still depends on how many labor hours are needed for each selling window.
Mobile food services employment benchmarks
• U.S. mobile food services employment reached 44,119 workers in 2024.
• Employment was about 10 times the 2000 level.
• Mobile food services employment increased 907% from 2000 to 2024.
• Food trucks require cooks, cashiers, prep staff, drivers, owners, event staff, and support labor.
• Small crews reduce payroll but can limit order speed and service capacity.
• Labor shortages can restrict operating hours, event availability, and menu complexity.
• Owner-operated trucks can protect cash margin while increasing personal workload.
• Multi-truck operators need structured staffing, maintenance, prep, and management systems.
| Labor signal | What it shows | Why it matters |
|---|---|---|
| Employment growth | More workers in mobile food services | Shows category expansion |
| Crew size | Number of people needed per service window | Controls speed and payroll |
| Owner-operator share | How much labor is absorbed by owners | Can hide true workload and margin pressure |
| Prep labor | Work needed before service begins | Affects commissary time and inventory |
| Event staffing | Extra crew for high-volume events | Determines whether events can be served profitably |
| Training | Consistency in food quality and service | Protects reviews and repeat demand |
| Turnover | Staff churn and replacement cost | Can disrupt speed and schedule reliability |
| Service speed | Orders served per hour | Connects labor to revenue capacity |
Editorial readout:
Food trucks may look lean, but labor still controls speed, menu quality, opening hours, event capacity, and customer wait time.
Food Truck Growth-Leak Diagnostic
A food truck benchmark should help operators identify where market growth is leaking. A growing category can still produce weak returns if the truck has poor route access, a slow menu, high event fees, high repair downtime, weak social visibility, or inconsistent staffing. The diagnostic model below connects statistics to practical operating decisions.
| Problem area | Core signals to measure | Benchmark signal |
|---|---|---|
| Market scale | Market value, CAGR, country growth, business count | Global market grows through 2030 and U.S. business activity remains visible |
| Location quality | Route sales, foot traffic, events, daily sales window | Events, cities, campuses, and breweries drive demand |
| Menu economics | Ticket size, food cost, prep time, order speed | Limited menus can improve speed and inventory control |
| Regulation | Permits, inspections, parking rules, event requirements | Local rules shape market access |
| Labor | Crew size, service speed, turnover, owner hours | Mobile food-services employment has grown sharply |
| Technology | POS, social media, preorders, digital payments | Digital tools support visibility and repeat demand |
| Seasonality | Weather, tourism, event calendar, school calendar | Revenue varies by climate and location type |
| Truck uptime | Maintenance, repairs, fuel, generator reliability | Downtime can erase sales even when demand exists |
Editorial readout:
This diagnostic keeps food truck statistics practical. A growing market does not protect a weak route, slow menu, poor permit access, high repair cost, or inconsistent staffing.
90-Day Food Truck Benchmark Plan
Statistics become more useful when they are translated into a short measurement cycle. A 90-day food truck benchmark plan should compare external market data with the operator’s real routes, menu margin, staffing pattern, event fees, and compliance exposure.
| Timing | What to do | Output |
|---|---|---|
| Days 1-30 | Capture the baseline by route, city, cuisine, daily sales, event type, labor, food cost, fuel, permits, and customer traffic. | Food truck benchmark map |
| Days 31-60 | Compare menu margin, average ticket, location performance, event fees, prep time, and service speed. | Opportunity and risk matrix |
| Days 61-90 | Prioritize best routes, events, menu items, staffing model, technology upgrades, and maintenance routines. | Repeatable food truck scorecard |
Editorial readout:
Food truck operators should not chase every market trend. They should compare external benchmarks against their own route economics, menu margin, permit access, and repeat-customer behavior.
Metrics Food Truck Leaders Should Track
The strongest food truck scorecard connects market growth with daily operating discipline. Revenue alone is not enough because a truck can show high sales at an event while losing margin to fees, labor, waste, and travel. A practical scorecard should show where demand is coming from, how fast the truck converts demand into orders, and whether each sales window is profitable.
| Metric | Why it matters |
|---|---|
| Daily revenue | The sales baseline by route and event |
| Average ticket size | Whether menu bundles and upsells are working |
| Orders per hour | Measures service speed and revenue capacity |
| Food cost percentage | Ingredient margin and waste exposure |
| Labor cost percentage | Whether staffing fits sales volume |
| Fuel and maintenance cost | Truck uptime and route efficiency |
| Event fee percentage | Whether event access is worth the cost |
| Location conversion | Compares sales by route, time, and foot traffic |
| Repeat-customer rate | Route loyalty and brand strength |
| Social media engagement | Whether customers can find the truck |
| Permit and compliance cost | Regulatory pressure by city |
| Weather impact | Exposure to seasonal and outdoor demand risk |
| Downtime | Measures lost selling windows from repairs or setup issues |
| Catering revenue | Stability from private bookings |
| Customer wait time | Connects kitchen speed to customer experience |
Editorial readout
The strongest food truck scorecard connects revenue, route quality, menu margin, labor, event fees, customer repeat behavior, truck uptime, and compliance cost.
Food Truck Market Statistics FAQ
Common questions
• What is the food truck market?
The food truck market includes mobile food businesses that prepare and sell meals, snacks, beverages, desserts, and specialty food from trucks, trailers, carts, or other mobile units. It overlaps with street food, quick-service dining, catering, events, and mobile food services.
• How large is the global food truck market?
Grand View Research values the global food trucks market at USD 5.79 billion in 2025 and forecasts USD 7.87 billion by 2030. Other definitions produce different totals, including broader market estimates that include additional formats and ecosystem activity.
• Is the food truck market growing?
Yes. Growth is supported by events, urban dining, street-food demand, lower-format flexibility, brewery and venue partnerships, and mobile food services employment growth. Technavio projects the market will add about USD 2.28 billion from 2026 to 2030.
• Which country has the strongest food truck market?
The United States is one of the clearest mature food truck markets because it has visible revenue, business-count, and employment data. Other important countries include Canada, Mexico, the United Kingdom, Germany, France, India, China, Japan, Australia, Brazil, the UAE, and South Africa.
• What are the biggest food truck costs?
Major costs include truck purchase or lease, kitchen equipment, permits, commissary fees, labor, food inventory, fuel, maintenance, insurance, payment processing, marketing, and event fees. The cost mix changes by city, menu, route, and truck age.
• What makes a food truck profitable?
Profitability depends on strong route access, high-margin menu items, fast service, repeat customers, private events, labor control, reliable equipment, food cost discipline, digital visibility, and clean permit compliance.
• What metrics should food truck owners track?
Food truck owners should track daily revenue, average ticket size, orders per hour, food cost, labor cost, fuel and maintenance, event fees, route performance, repeat customers, social engagement, wait time, downtime, and catering revenue.
Final Takeaway
Food truck market growth depends on five systems working together: location access, menu economics, operating discipline, regulation, and consumer demand. The statistics show that food trucks are no longer only a novelty format. They are a measurable part of mobile foodservice, supported by global market growth, U.S. employment expansion, event demand, and consumers who continue to seek fast, local, and experience-led food options.
The practical goal is not only to know that the market is growing. The stronger benchmark is readiness. A food truck operator needs the right city, route, permits, menu, crew, event strategy, cost controls, technology, and truck reliability to turn mobility into profit. A weak location, slow menu, high event fee, or repair-heavy truck can erase the benefit of broader market expansion.
For foodservice leaders, the best reading of food truck statistics is operational. Market value shows demand potential. Employment and business counts show activity. Cuisine and location data show where sales happen. Regulation shows where access can be blocked. Metrics such as orders per hour, average ticket, food cost, labor cost, downtime, and repeat customers show whether the business model works. The strongest food truck strategies use data to move beyond novelty and build a repeatable, compliant, and profitable mobile food system.