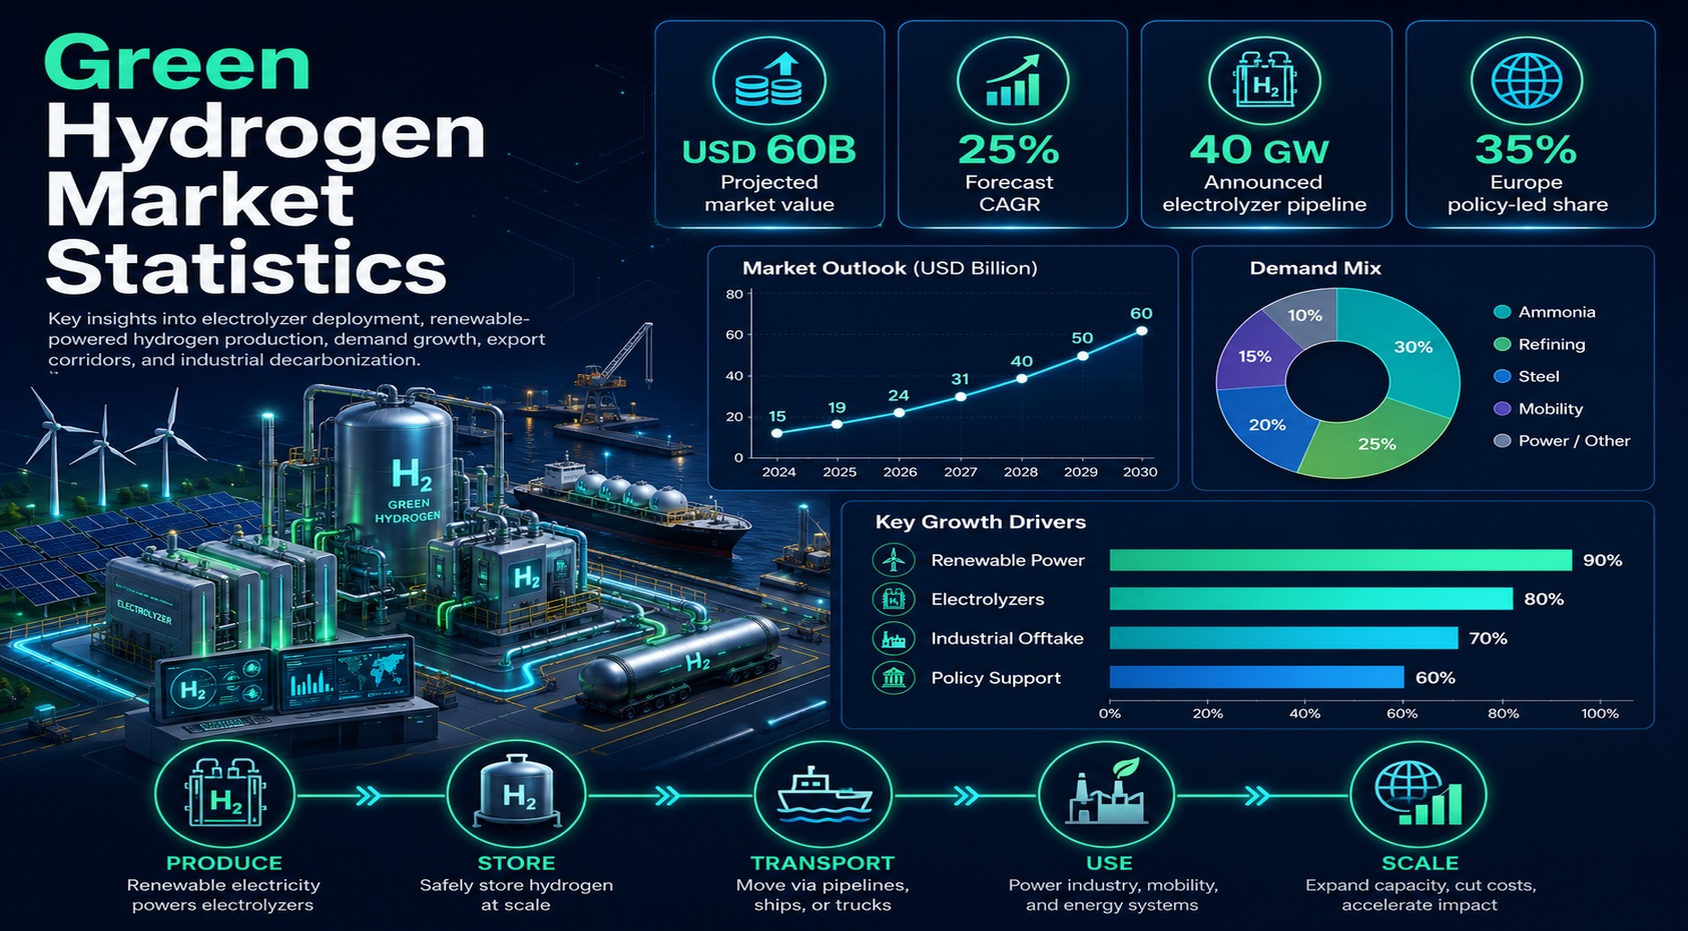
Green hydrogen is moving from a climate-policy promise into an industrial, energy, and infrastructure market. It is made by splitting water with renewable electricity, so its growth depends on two physical systems advancing together: low-cost renewable power and installed electrolyze capacity. That makes green hydrogen different from many clean-energy categories. It is not only a fuel, not only a technology, and not only a market forecast. It is a production chain that links power generation, electrolyze, water, storage, pipelines, ports, end-use demand, and long-term offtake contracts.
The strongest statistics show why the topic now deserves its own scorecard. Precedence Research places the global green hydrogen market at USD 12.31 billion in 2025 and USD 231.32 billion by 2035, implying a 34.09% CAGR. IEA data shows global water electrolysis capacity reached 2 GW in 2024, while announced low-emissions hydrogen projects could reach 37 Mtpa by 2030. Hydrogen Council data shows more than USD 110 billion in committed investment and around 1,700 announced hydrogen projects worldwide, but the same data also shows why execution matters: committed clean hydrogen capacity is still much smaller than the announced pipeline.
This report is built for quick scanning. Each section opens with context, then moves into benchmark statistics, tables, figures, and short readout boxes that explain what the numbers mean for investors, project developers, electrolyze makers, utilities, policymakers, and industrial buyers.
Executive Green Hydrogen Benchmarks
These are the statistics that frame the market. They show the size of the growth opportunity, the pace of electrolyze deployment, the gap between announcements and operating supply, and the regional policy forces shaping demand.
The numbers defining the green hydrogen market
• The global green hydrogen market is estimated at USD 12.31 billion in 2025.
• The market is projected to reach USD 55.86 billion by 2030 and USD 231.32 billion by 2035.
• The 2026-2035 path implies a 34.09% CAGR.
• Wind-based green hydrogen held 47.75% of source-segment revenue in 2025.
• Solar-based green hydrogen held 31.22% of source-segment revenue in 2025.
• PEM electrolyze held 26.43% of electrolyze-segment revenue in 2025.
• Alkaline electrolyze held 25.21% of electrolyze-segment revenue in 2025.
• Refining was the largest end-use segment with 41.9% revenue share in 2025.
• Asia Pacific held 47.4% of green hydrogen market revenue in 2025.
• Asia Pacific is estimated at USD 5.84 billion in 2025 and USD 112.79 billion by 2035.
• Global hydrogen production reached about 100 Mt in 2024; low-emissions hydrogen was only about 1% of supply.
• Global installed water electrolysis capacity reached 2 GW in 2024.
• Announced low-emissions hydrogen could reach 37 Mtpa by 2030, while firmer projects point to about 4 Mtpa.
• China accounted for about 60% of global electrolyze manufacturing capacity in 2025.
• Hydrogen Council data shows more than USD 110 billion in committed investment and about 500 mature projects.
Why Green Hydrogen Market Growth Now Matters
Green hydrogen matters because many industrial emissions are hard to solve through direct electrification alone. Fertilizers, refining, methanol, steel, shipping fuels, aviation e-fuels, and long-duration storage all need low-carbon molecules, not just cleaner power.
Market-growth and energy-transition benchmarks
• Global hydrogen production reached 100 Mt in 2024.
• Low-emissions hydrogen represented only about 1% of global hydrogen production in 2024.
• Announced low-emissions hydrogen could reach 37 Mtpa by 2030.
• Announced 2030 production potential was revised from 49 Mtpa to 37 Mtpa.
• Operational, FID, and construction-stage projects point to about 4 Mtpa of 2030 production.
• Almost-certain or strong-potential projects represent about 10 Mt of 2030 production.
• Installed water electrolysis capacity reached 2 GW in 2024.
• Another 1 GW of electrolysis capacity was added through July 2025.
• China represented about 65% of installed electrolysis capacity and FID-stage capacity in 2025.
• Electrolyze demand was about 2 GW in 2024.
• Committed clean hydrogen capacity reached 6 Mtpa in 2025.
• Binding offtake covered about 3.6 Mtpa in 2025.
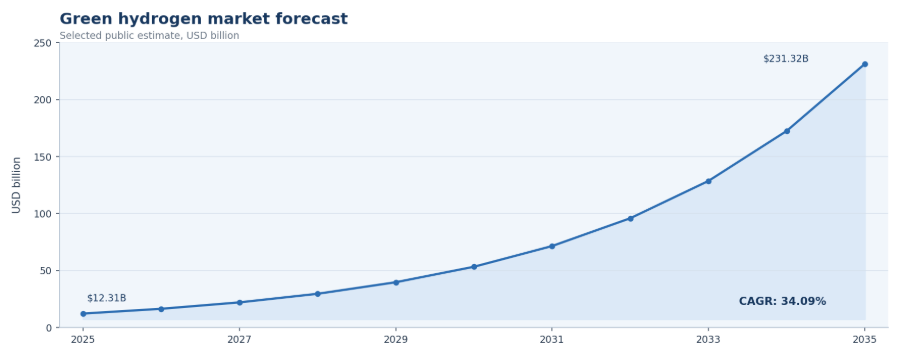
Figure 1. Green hydrogen market growth should be read with electrolyze scale and renewable power availability.
Global Green Hydrogen Market Size and Forecast
The global forecast should be read as a directional growth range rather than a single exact number. Green hydrogen is still early-stage, so forecasts are sensitive to power prices, electrolyze costs, policy support, offtake contracts, and project execution.
Global forecast benchmarks
• The market starts at USD 12.31 billion in 2025.
• The forecast rises to USD 17.28 billion in 2026.
• The market reaches USD 23.17 billion in 2027 and USD 31.07 billion in 2028.
• The forecast reaches USD 41.66 billion in 2029.
• By 2030, the global market reaches USD 55.86 billion.
• The 2031 forecast is USD 74.91 billion.
• By 2032, the market crosses USD 100.44 billion.
• The 2033 forecast is USD 134.68 billion.
• By 2034, the market reaches USD 180.60 billion.
• The 2035 forecast reaches USD 231.32 billion.
• The market index rises from 100 in 2025 to more than 1,879 by 2035.
• Annual market expansion rises from USD 4.97 billion in 2026 to USD 50.72 billion in 2035.
| Year | Market value | YoY increase | Market meaning |
|---|---|---|---|
| 2025 | USD 12.31B | Base year | Early commercial scale |
| 2026 | USD 17.28B | USD 4.97B | Acceleration begins |
| 2030 | USD 55.86B | USD 14.20B | Market enters larger infrastructure phase |
| 2032 | USD 100.44B | USD 25.54B | Forecast crosses USD 100B |
| 2035 | USD 231.32B | USD 50.72B | Large-scale industrial market |
Electrolyze Capacity Statistics
Electrolyze are the physical backbone of green hydrogen supply. Strategies and project announcements matter, but production cannot scale unless electrolyze capacity is installed, powered by renewables, and used at commercially viable utilization rates.
Electrolyze deployment and technology benchmarks
• Global installed water electrolysis capacity reached 2 GW in 2024.
• A further 1 GW was added through July 2025.
• China held about 65% of installed and FID-stage electrolysis capacity in 2025.
• China accounted for about 60% of global electrolyze manufacturing capacity in 2025.
• China electrolyze manufacturing capacity reached 20 GW/year in 2024.
• A China-focused dataset places annual production capacity at 25 GW/year in 2024.
• Global electrolyze manufacturing capacity reached about 42 GW/year in 2024.
• PEM electrolyze revenue reached USD 3.25 billion in 2025.
• PEM electrolyze held 26.43% of electrolyze-segment share in 2025.
• Alkaline electrolyze revenue reached USD 3.10 billion in 2025.
• Alkaline electrolyze held 25.21% of electrolyze-segment share in 2025.
• SOEC electrolyze revenue reached USD 2.90 billion in 2025.
• SOEC electrolyze held 23.57% of electrolyze-segment share in 2025.
• Other electrolyze categories reached USD 3.05 billion in 2025.
• PEM electrolyze revenue grew by about 40.46% in 2025.
| Electrolyzer type | 2025 value | 2025 share | Market role |
|---|---|---|---|
| PEM | USD 3.25B | 26.43% | Flexible option for variable renewables |
| Alkaline | USD 3.10B | 25.21% | Mature and widely used technology |
| SOEC | USD 2.90B | 23.57% | Emerging high-efficiency pathway |
| Others | USD 3.05B | 24.79% | AEM and other developing systems |
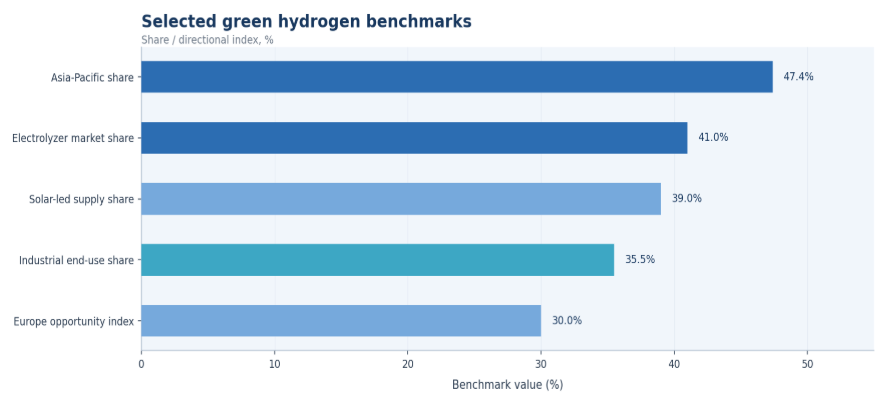
Figure 2. Electrolyze capacity shows whether announced supply is becoming physical production capacity.
Green Hydrogen Cost and Price Statistics
Cost is the central commercial question for green hydrogen. Production economics depend on renewable electricity prices, electrolyze capex, utilization, financing, water, balance-of-plant costs, transport, and storage.
Cost benchmarks and project economics
• Outside China, electrolyze installation cost ranged from USD 2,000/kW to USD 2,600/kW in 2024.
• In China, electrolyze installation cost ranged from USD 600/kW to USD 1,200/kW in 2024.
• China’s low-end electrolyze cost was about 70% below the low end outside China.
• China’s high-end benchmark was about 54% below the high end outside China.
• China renewable hydrogen production cost reached a low benchmark of about EUR 2/kg in 2024.
• Chile targets clean hydrogen prices of USD 0.8/kg to USD 1.1/kg by 2030.
• Chile’s 2030 target price range has a spread of only USD 0.3/kg.
• India funding equals about USD 0.46 billion per Mt of 2030 production target.
• EU funding equals about EUR 0.94 billion per Mt of combined 2030 production and import target.
• Chile public funding equals about USD 8.33 million per supported project.
| Cost driver | Why it matters | Market impact |
|---|---|---|
| Power price | Largest operating input | Controls production economics |
| Electrolyzer capex | Main equipment cost | Shapes project payback |
| Utilization | Spreads fixed costs | Higher use lowers unit cost |
| Financing | Affects bankability | Policy can reduce risk |
| Transport/storage | Adds delivered cost | Favors clusters and nearby buyers |
Production Pathway and Source Segment Statistics
Green hydrogen is part of a wider hydrogen market that still relies mainly on fossil-based production. That distinction matters. Most current hydrogen demand comes from refining, ammonia, methanol, and chemical processes, but the emissions profile changes depending on how hydrogen is produced. Green hydrogen competes with grey hydrogen, blue hydrogen, and direct electrification; it also needs to create new demand in sectors where conventional electrification is difficult.
Source and pathway benchmarks
• Wind-based green hydrogen market value reached USD 5.88 billion in 2025.
• Wind held 47.75% of source-segment revenue in 2025.
• Solar-based green hydrogen market value reached USD 3.84 billion in 2025.
• Solar held 31.22% of source-segment revenue in 2025.
• Other renewable sources reached about USD 2.59 billion in 2025.
• Other sources held about 21.03% of source-segment revenue in 2025.
• Wind source revenue increased by about 40.40% in 2025.
• Solar source revenue increased by about 40.30% in 2025.
• Current hydrogen production reached 100 Mt in 2024.
• Low-emissions hydrogen represented only about 1% of production in 2024.
| Hydrogen type | Production method | Emissions position | Market meaning |
|---|---|---|---|
| Grey | Fossil fuel without capture | Highest | Dominates current supply |
| Blue | Fossil fuel with carbon capture | Lower | Transitional option |
| Green | Renewable electricity + electrolysis | Lowest direct | Core long-term growth segment |
| Pink | Nuclear-powered electrolysis | Low-carbon | Country-specific role |
| Turquoise | Methane pyrolysis | Emerging | Needs commercial validation |
End-Use Demand Statistics
End-use demand plays a major role in determining whether green hydrogen projects can generate stable, long-term revenue. The most promising applications are typically industries where hydrogen is already essential, emissions are challenging to reduce, or companies face increasing regulatory and policy pressure. This makes sectors such as refining, ammonia and methanol production, iron and steel, shipping fuels, and sustainable aviation fuels recurring areas of interest in the market. For businesses and independent professionals working across these projects, a freelance invoice template can also help simplify the management and presentation of service-related costs.
Industrial and transport end-use benchmarks
• Refining held 41.9% of green hydrogen end-use revenue in 2025.
• Refining market value reached USD 5.16 billion in 2025.
• Ammonia held 18.5% of end-use revenue in 2025.
• Ammonia market value reached USD 2.28 billion in 2025.
• Methanol held 15.95% of end-use revenue in 2025.
• Methanol market value reached USD 1.96 billion in 2025.
• Iron and steel held 13.75% of end-use revenue in 2025.
• Iron and steel market value reached USD 1.69 billion in 2025.
• Other end uses held 9.9% of market revenue in 2025.
• Refining remains the largest early-use segment because it already consumes hydrogen.
• Ammonia is important as both a fertilizer feedstock and a hydrogen carrier.
• Iron and steel is important because hydrogen can reduce hard-to-abate process emissions.
| End use | Hydrogen role | Market meaning |
|---|---|---|
| Refining | Replace grey hydrogen | Existing demand base |
| Ammonia | Fertilizer and export fuel | Early anchor demand |
| Methanol | Chemical and shipping fuel pathway | Industrial and fuel demand |
| Iron & steel | Direct reduced iron | Hard-to-abate opportunity |
| Power storage | Long-duration balancing | Useful for renewable-heavy grids |
Regional Green Hydrogen Market Statistics
Regional data is one of the highest-value parts of a green hydrogen market article because global averages hide major differences. Some regions are policy-led buyer markets, some are low-cost renewable production hubs, some are electrolyze manufacturing centers, and others are export-corridor developers. A strong analysis separates each region by its real advantage.
Europe
• Europe green hydrogen market value reached USD 2.86 billion in 2025.
• Europe is projected to reach USD 14.45 billion by 2030.
• Europe’s 2035 market value reaches USD 73.12 billion in the workbook forecast.
• The EU targets 10 Mt of renewable hydrogen production by 2030.
• The EU also targets 10 Mt of renewable hydrogen imports by 2030.
• The EU renewable hydrogen electrolyze target is 40 GW by 2030.
• Available EU green hydrogen project funding totals about EUR 18.8 billion.
• Advanced EU project capacity equals about 5 GW, or 12.5% of the 40 GW target.
• Early-stage EU project capacity totals about 50 GW, or 125% of the 40 GW target.
North America
• The U.S. green hydrogen market reached USD 1.83 billion in 2025.
• The U.S. forecast reaches USD 9.60 billion by 2030.
• The U.S. market reaches USD 50.44 billion by 2035.
• The U.S. Clean Hydrogen Hubs program includes USD 7.0 billion in funding.
• Hydrogen hubs demand-side support adds USD 1.0 billion.
• The U.S. market index rises from 100 in 2024 to more than 3,844 by 2035.
• North American growth depends on hubs, tax incentives, industrial clusters, clean power, and buyers.
Asia-Pacific
• Asia Pacific held 47.4% of global market revenue in 2025.
• Asia Pacific market value reached USD 5.84 billion in 2025.
• Asia Pacific reaches USD 25.67 billion in 2030.
• Asia Pacific reaches USD 112.79 billion in 2035.
• China market value reached USD 1.93 billion in 2025.
• China reaches USD 11.25 billion in 2030 and USD 65.72 billion by 2035.
• India targets 5 Mt of green hydrogen production by 2030.
• India’s mission links the target to 125 GW of renewable capacity additions.
• India targets 500,000 new jobs and 50 Mt CO2e of emissions reduction by 2030.
• India allocated 862,000 tonnes/year of production in 2025 across 19 companies.
Middle East and Africa
• Middle East and Africa growth is shaped by renewables, export positioning, ports, and ammonia projects.
• Saudi Arabia, the UAE, Oman, Egypt, Morocco, Namibia, and South Africa are key project markets.
• Export-led projects need ports, ammonia conversion, shipping routes, buyers, and policy certainty.
• Late-2020s and early-2030s import demand will shape many export projects.
Latin America
• Latin America produced about 60% of its electricity from renewables in 2023.
• Hydropower represented about 40% of Latin America electricity generation in 2023.
• Announced low-emission hydrogen production in Latin America and the Caribbean could reach 7 Mt by 2030.
• Only about 0.1% of the region’s announced projects had reached operation, construction, or FID.
• Latin America hydrogen demand reached about 4 Mt in 2023.
• About 90% of Latin America hydrogen production came from imported natural gas in 2023.
• About 80% of nitrogen-based fertilizer demand in the region was met by imports in 2023.
| Region | Market implication |
|---|---|
| Europe | Policy-led demand, import targets, and industrial decarbonization |
| North America | Incentive-led growth through hubs, tax support, and clusters |
| Asia-Pacific | Scale-led growth from China, India, Japan, Korea, and Australia |
| Middle East & Africa | Export-led development around low-cost renewables and ports |
| Latin America | Renewable-resource-led opportunity led by Chile and Brazil |
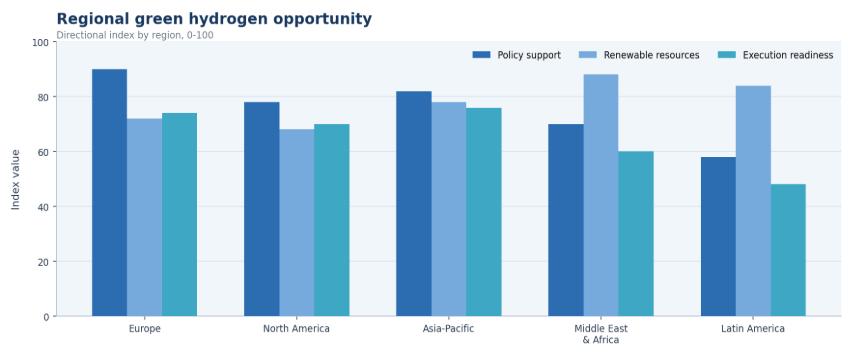
Figure 3. Regional opportunity differs by policy support, renewable resources, buyer demand, and export readiness.
Country-Level Green Hydrogen Market Statistics
Country-level statistics add practical depth because green hydrogen opportunities are shaped by national strategy. Some countries are likely producers, some are buyers, some are equipment suppliers, and some are potential export-corridor hubs. The strongest country analysis separates these roles rather than ranking countries by a single market value.
Country benchmarks
• China renewable hydrogen production capacity reached 104,000 tonnes/year in 2024.
• China had 1,180 MW of installed renewable hydrogen project capacity in 2024.
• China had 94 renewable hydrogen projects in 2024.
• China renewable hydrogen production capacity could reach 10 Mt/year by 2030.
• China electrolysis capacity reached 3.5 GW in 2024.
• China represented about 70% of global electrolysis capacity in 2024 in the Sino-German dataset.
• China projected electrolysis capacity reaches 50 GW by 2030.
• Germany green hydrogen market value reaches USD 872.79 million in 2025.
• Germany reaches USD 4.46 billion in 2030 and USD 22.77 billion in 2035.
• France green hydrogen market value reaches USD 808.56 million in 2025.
• France reaches USD 4.11 billion in 2030 and USD 20.91 billion in 2035.
• Spain’s green hydrogen electrolyze target is 12 GW by 2030.
• Spain’s previous draft target was 11 GW, below the final 12 GW target.
• Chile’s electrolyze target rises from 5 GW in 2025 to 25 GW in 2030.
• Chile’s 2025-2030 electrolyze target therefore grows by 5x.
| Country | Main green hydrogen driver | Market meaning |
|---|---|---|
| United States | Hubs and incentives | Policy-backed industrial clusters |
| Germany | Import demand and heavy industry | Large buyer market |
| China | Electrolyzer manufacturing and deployment | Supply-chain and scale leader |
| India | National Green Hydrogen Mission | Production and export growth |
| Australia | Renewable export projects | Export-led pipeline |
| Saudi Arabia | Green ammonia megaprojects | Large-scale export positioning |
| Chile | Low-cost renewables | Export and mining opportunity |
Policy, Incentive, and Investment Statistics
Policy support is a central reason green hydrogen has moved from concept to project pipeline. In many markets, production costs remain higher than incumbent fossil-based hydrogen, so tax credits, contracts for difference, grants, mandates, hydrogen hubs, and public infrastructure support can determine whether a project reaches construction.
Policy and investment benchmarks
• Hydrogen Council data shows USD 110 billion in committed investment in 2025.
• Committed investment increased by USD 35 billion from the previous year.
• Average committed-investment growth since 2020 was about 50% per year.
• About 1,700 announced hydrogen projects were tracked globally in 2025.
• The announced project pipeline increased by 7.5x from 2020 to 2025.
• About 50 projects were cancelled in the previous 18 months.
• Cancelled projects represented about 3% of the announced project base.
• About 500 projects had reached maturity through FID, construction, or operation.
• Committed clean hydrogen capacity reached 6 Mtpa in 2025.
• Operational clean hydrogen capacity was about 1 Mtpa in 2025.
• Potential 2030 clean hydrogen pipeline capacity ranges from 9 Mtpa to 14 Mtpa.
• Binding offtake covered 3.6 Mtpa in 2025.
• Operational capacity represented about 16.7% of committed clean hydrogen capacity.
• Binding offtake represented about 60% of committed clean hydrogen capacity.
• Committed investment averaged about USD 0.22 billion per mature project.
| Region | Main policy tool | Market impact |
|---|---|---|
| United States | Hubs and tax incentives | Improves project economics |
| European Union | Targets, funding, mandates | Creates production and import demand |
| India | Mission targets and incentives | Builds domestic supply chain |
| Japan/Korea | Import and offtake support | Creates long-term buyer markets |
| Middle East | Industrial zones and megaprojects | Supports export-scale production |
Deployment Quality Benchmarks
Green hydrogen market statistics become more useful when they separate project ambition from project quality. A national strategy or announced gigawatt pipeline shows direction, but construction activity, final investment decisions, electrolyze procurement, renewable power access, storage plans, and signed offtake show whether the market is moving toward bankable supply.
Execution signals worth tracking
• Announced capacity shows ambition, but FID-stage projects show commercial commitment.
• Construction starts are stronger deployment signals than early-stage memorandums.
• Electrolyze orders should be compared with renewable power contracts and grid access.
• Industrial offtake improves bankability when buyers commit to long-term volumes.
• Port, storage, pipeline, ammonia, and methanol infrastructure decide delivered-cost viability.
• Policy support is most useful when it reduces project risk rather than only setting long-term targets.
• Export projects need buyer contracts, certification rules, and shipping-route economics to scale.
• The strongest project scorecards compare cost, supply, demand, policy, infrastructure, and execution timing together.
| Signal | What It Shows | Why It Matters |
|---|---|---|
| FID | Project commitment | Filters announced pipeline |
| Electrolyzer orders | Supply readiness | Links forecasts to equipment demand |
| Offtake contracts | Buyer confidence | Improves bankability |
| Infrastructure | Delivery readiness | Shapes delivered cost |
| Policy awards | Risk support | Helps projects reach construction |
How to compare project quality
• A project with lower headline capacity can be more valuable if it has land, permits, grid access, and a firm buyer.
• A large export plan is weaker if port upgrades, carrier contracts, ammonia conversion, and certification rules remain unresolved.
• A manufacturing announcement should be checked against actual electrolyze shipments, factory utilization, and order backlog.
• A subsidy award is most useful when it is attached to a project with construction milestones and offtake visibility.
• A regional strategy becomes stronger when it connects renewable power zones with industrial users and logistics corridors.
• A cost target should be read with electricity price, utilization rate, financing cost, equipment cost, and delivery route.
• A demand forecast becomes more reliable when it is supported by existing hydrogen users or hard-to-electrify sectors.
• A country-level benchmark is most helpful when it separates domestic use, equipment supply, and export ambition.
This approach keeps the article close to the reference style because every statistic is connected to a practical signal. Instead of treating green hydrogen as one global market, it separates the numbers by project stage, buyer readiness, infrastructure maturity, cost pressure, and policy support. That makes the article more useful for readers who need to understand where the market is actually moving.
It also reduces the risk of overstating the market. Green hydrogen has many large announcements, but only a smaller share of projects has reached advanced development, construction, or operation. A polished statistics article should therefore balance growth forecasts with execution reality, especially when comparing Europe, North America, Asia-Pacific, the Middle East, Africa, Australia, and Latin America.
For buyers, the final question is not only whether green hydrogen can be produced. It is whether the fuel can be delivered at the right cost, with the right certification, through reliable infrastructure, to an end use that can justify a long-term contract.
This is why deployment-quality statistics should remain part of the market story: they help readers separate momentum, readiness, risk, and commercial value before treating a forecast as proof of adoption.
Infrastructure, Storage, and Transport Statistics
Green hydrogen is not only a production market. Once hydrogen is made, it must be compressed, stored, transported, converted, or consumed near production. That makes infrastructure one of the most important differences between successful projects and stranded announcements. Industrial clusters, ports, pipelines, ammonia facilities, storage caverns, and renewable power grids all matter.
Infrastructure and project-readiness benchmarks
• Committed clean hydrogen capacity reached 6 Mtpa in 2025.
• Operational clean hydrogen capacity reached about 1 Mtpa in 2025.
• Binding offtake reached 3.6 Mtpa in 2025.
• The announced project pipeline averaged about 3.4 projects for every mature project.
• Announced 2030 potential is 37 Mtpa, while firmer operational/FID/construction projects point to 4 Mtpa.
• Chile’s six supported projects could add 396 MW of electrolyze capacity.
• Those six Chile projects could produce about 45,000 tonnes/year of clean hydrogen.
• The same Chile package is expected to attract about USD 1.0 billion in investment.
• Chile’s supported-project package averages 66 MW of electrolyze capacity per project.
• Chile’s supported-project package averages 7,500 tonnes/year of hydrogen output per project.
| Infrastructure need | Why it matters |
|---|---|
| Renewable electricity | Powers electrolyze and controls cost |
| Water supply | Required for electrolysis |
| Pipelines | Move hydrogen to users |
| Storage | Balances production and demand |
| Ports | Enable exports as ammonia or derivatives |
| Industrial clusters | Improve offtake and project economics |
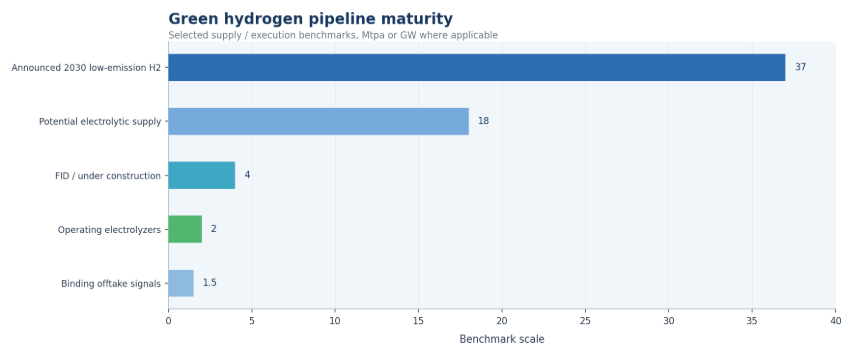
Figure 4. Cost drivers matter because delivered green hydrogen cost depends on power, equipment, finance, and logistics.
Green Hydrogen Market Risks and Bottlenecks
The market has strong momentum, but deployment is not automatic. Many projects still face high cost, weak offtake, grid bottlenecks, permitting delays, unclear policy rules, infrastructure gaps, technology risk, and competition from direct electrification or blue hydrogen. A balanced statistics article should show both the upside and the friction.
Risk and bottleneck benchmarks
• Announced 2030 low-emissions potential was revised from 49 Mtpa to 37 Mtpa.
• Only about 4 Mtpa of 2030 supply is linked to operational, FID, or construction-stage projects.
• Only 1 Mtpa of clean hydrogen capacity was operational in the Hydrogen Council benchmark.
• About 50 projects were cancelled over the previous 18 months.
• Cancelled projects represented about 3% of announced projects.
• Low-emissions hydrogen was only 1% of hydrogen production in 2024.
• Outside China electrolyze installation costs reached USD 2,000/kW to USD 2,600/kW in 2024.
• The EU advanced project capacity of 5 GW is only 12.5% of the 40 GW 2030 target.
• Latin America had 7 Mt of announced 2030 potential, but only 0.1% had reached operation, construction, or FID.
• India had allocated 17.24% of its 5 Mt target by 2025.
| Constraint | What it affects | How buyers respond |
|---|---|---|
| High cost | Adoption and offtake | Use subsidies and long-term contracts |
| Renewable power limits | Production volume | Co-locate with low-cost renewables |
| Infrastructure gaps | Delivered cost | Build clusters and corridors |
| Policy uncertainty | Financing | Use bankable support mechanisms |
| Weak offtake | Project execution | Secure anchor industrial buyers |
Green Hydrogen Market Opportunity Diagnostic
A useful market diagnostic connects statistics to action. Instead of asking only whether the global market is growing, analysts should ask where the growth is most bankable. The best opportunities usually combine low-cost renewable power, strong policy, industrial demand, infrastructure, and credible project sponsors.
| Opportunity area | Core signals to measure | Why it matters |
|---|---|---|
| Electrolyze deployment | Installed capacity, utilization, orders | Shows real supply progress |
| Industrial offtake | Signed contracts and buyer demand | Determines bankability |
| Renewable power | PPA prices and capacity factors | Controls production cost |
| Policy support | Credits, grants, mandates | Improves project economics |
| Export corridors | Ports, pipelines, ammonia terminals | Enables cross-border trade |
| Cost decline | Capex, power cost, financing | Drives competitiveness |
90-Day Green Hydrogen Market Research Plan
Statistics become more useful when they are translated into a repeatable research plan. A practical 90-day review should compare market forecasts with actual deployment signals rather than relying on a single headline CAGR.
| Timing | What to do | Output |
|---|---|---|
| Days 1-30 | Build baseline by market size, region, country, electrolyze capacity, and end use | Clear supply and demand map |
| Days 31-60 | Compare costs, policies, project pipelines, offtake, and infrastructure readiness | Priority opportunity list |
| Days 61-90 | Review financing, country strategy, project execution risk, and buyer commitments | Practical green hydrogen scorecard |
Metrics Green Hydrogen Market Analysts Should Track
A green hydrogen dashboard should separate headline ambition from operational progress. The following metrics are useful because they connect market value, production capacity, project maturity, cost, demand, and infrastructure into one scorecard.
| Metric | Why it matters |
|---|---|
| Global market size | Shows total industry scale |
| CAGR by source | Helps compare forecast assumptions |
| Installed electrolyze capacity | Measures real supply buildout |
| Announced project capacity | Shows future pipeline |
| Final investment decisions | Separates real projects from announcements |
| Renewable electricity cost | Drives production economics |
| Electrolyze capex | Affects project cost |
| Hydrogen production cost | Measures competitiveness |
| Industrial offtake contracts | Supports project bankability |
| Country policies | Shapes deployment speed |
| Export corridor development | Supports global trade |
| Storage and transport capacity | Determines delivered-cost viability |
Project Pipeline and Offtake Statistics
Project-pipeline data is one of the most important ways to separate real market progress from long-term ambition. Announced projects show the size of the opportunity, but the stronger signals are final investment decisions, construction activity, signed offtake, grid connection, electrolyze procurement, and committed public or private capital.
Pipeline and offtake benchmarks
• Announced 2030 low-emissions hydrogen could reach 37 Mtpa.
• Operational, FID, and construction-stage projects point to about 4 Mtpa of 2030 supply.
• Almost-certain or strong-potential projects represent about 10 Mt of 2030 production.
• Committed clean hydrogen capacity reached 6 Mtpa in 2025.
• Binding offtake covered about 3.6 Mtpa in 2025.
• Committed clean hydrogen investment exceeds USD 110 billion across mature projects.
• Around 500 mature clean hydrogen projects are identified globally.
• Industrial clusters connect production, storage, pipelines, ports, and buyers.
• Green ammonia projects can be more bankable because ammonia is easier to ship.
• Long-term offtake contracts are a clear signal of project bankability.
• Projects without buyers, infrastructure, or cheap renewable power remain exposed to delay.
• Strong pipelines combine policy support, renewable power, buyers, and export infrastructure.
| Pipeline Signal | What It Shows | Why It Matters |
|---|---|---|
| Announced capacity | Long-term ambition | Shows market scale but not execution certainty |
| FID / construction | Committed supply | Separates real projects from early announcements |
| Binding offtake | Buyer confidence | Supports financing and bankability |
| Electrolyze orders | Equipment readiness | Links project plans to physical supply |
| Cluster infrastructure | Delivery readiness | Reduces transport, storage, and buyer risk |
Green Hydrogen Trade and Export Corridor Statistics
International trade is becoming a central part of the green hydrogen market because the best renewable resources are not always located near the largest industrial buyers. Some countries are positioned as future producers, while others are likely to be import markets because their steel, chemicals, refining, transport, and power systems need low-carbon molecules at scale.
Trade, import, and export benchmarks
• Europe remains a major import-demand region because industrial needs exceed low-cost domestic supply.
• Germany is a key buyer market because chemicals, refining, and steel create large demand.
• Australia is positioned as an export-led market for Asia-Pacific buyers.
• Saudi Arabia and the Gulf are building export strategies around renewables and green ammonia.
• Oman hydrogen zones link renewables, desalination, production sites, and ports.
• Chile has strong renewable-resource advantages for export and mining-sector demand.
• Morocco, Egypt, Namibia, and South Africa are gaining attention for export-oriented projects.
• Japan and South Korea are key demand markets for imports, ammonia, and industrial decarbonization.
• Green ammonia is an important early export carrier for hydrogen-derived energy.
• E-methanol and synthetic fuels can open additional shipping, aviation, and chemical demand.
• Cross-border trade depends on certification for renewable and low-carbon claims.
• Export corridors work best when power, water, ports, storage, and contracts align.
| Trade Role | Typical Countries | Market Meaning |
|---|---|---|
| Buyer markets | Germany, Japan, South Korea | Need imports and long-term offtake |
| Producer markets | Chile, Oman, Saudi Arabia | Compete on renewables and export logistics |
| Hybrid markets | United States, China, India | Can produce, consume, and build supply chains |
| Export carriers | Ammonia, methanol, e-fuels | Make hydrogen easier to trade over distance |
| Certification systems | EU, Japan, Korea, U.S. | Shape what qualifies as clean or renewable |
Buyer Adoption and Commercial Readiness Statistics
The commercial side of green hydrogen is as important as the production side. A project can have strong renewable resources and modern electrolyze, but it still needs a buyer that can absorb the fuel, pay a premium, meet certification rules, and use the hydrogen in a process where direct electrification is difficult or uneconomic.
Adoption and readiness benchmarks
• Refining is an early demand base because existing hydrogen use can be replaced.
• Ammonia is a strong anchor market because hydrogen is already a core feedstock.
• Steel is a long-term opportunity because hydrogen can support direct reduced iron.
• Shipping demand is likely to develop through green ammonia and e-methanol.
• Aviation demand is more likely to appear through synthetic fuels.
• Heavy transport may use hydrogen where batteries are less practical.
• Power-sector demand is selective, but hydrogen can support long-duration storage.
• Industrial heat can create demand where direct electrification is difficult.
• Buyers need delivered-cost certainty, not only low production-cost estimates.
• Early adopters are usually large industrial buyers with policy support and procurement capacity.
• Commercial readiness improves near industrial clusters, ports, pipelines, storage, and renewables.
• The strongest adoption metric is bankable demand backed by contracts and infrastructure.
| Buyer Signal | What to Check | Why It Matters |
|---|---|---|
| Existing hydrogen use | Refining, ammonia, chemicals | Creates easier substitution demand |
| Hard-to-electrify process | Steel, shipping, aviation fuels | Supports long-term value case |
| Willingness to pay | Contracts and premiums | Determines project bankability |
| Infrastructure access | Pipelines, ports, storage | Controls delivered cost |
| Policy alignment | Mandates, credits, certificates | Improves adoption economics |
|
Commercial readiness readout The strongest markets combine policy, infrastructure, cost visibility, and buyers able to sign bankable long-term demand. |
What Green Hydrogen Buyers Should Watch Next
Green hydrogen buyers should separate market ambition from project execution. Announced capacity, national targets, and export memorandums show interest, but operating capacity, final investment decisions, signed offtake, and infrastructure readiness show whether projects are becoming bankable.
Execution benchmarks worth separating
• Project pipelines should be split into announced, permitted, financed, and operating capacity.
• Final investment decisions show which projects have moved beyond early-stage planning.
• Electrolyze utilization should be reviewed with renewable power availability.
• Industrial offtake is stronger than general demand targets.
• Export projects need ports, conversion facilities, storage, shipping routes, and buyers.
• Policy support should be checked against grid capacity, permitting timelines, and infrastructure readiness.
| Signal | What It Shows | Why It Matters |
|---|---|---|
| FID-stage projects | Real commitment | Separates pipeline from delivery |
| Electrolyze utilization | Production efficiency | Affects hydrogen cost |
| Industrial offtake | Buyer demand | Improves bankability |
| Export infrastructure | Delivery readiness | Supports cross-border trade |
| Policy support | Market confidence | Reduces project risk |
|
Commercial readiness readout The strongest markets combine policy, infrastructure, cost visibility, and buyers able to sign bankable long-term demand. |
Green Hydrogen Market Statistics FAQ
• What is the size of the green hydrogen market?
The market is estimated at USD 12.31 billion in 2025 and projected to reach USD 231.32 billion by 2035.
• How fast is the green hydrogen market growing?
The main forecast path shows a 34.09% CAGR for 2026-2035.
• Which region leads the green hydrogen market?
Asia Pacific leads with 47.4% revenue share in 2025 and a projected USD 112.79 billion value by 2035.
• Why are electrolyze important?
Electrolyzeturn renewable electricity and water into hydrogen; installed capacity reached 2 GW in 2024.
• Is green hydrogen cost-competitive today?
Cost varies by location; China shows lower electrolyzer-cost benchmarks, while Chile targets USD 0.8/kg to USD 1.1/kg by 2030.
• What is driving green hydrogen demand?
Demand is driven by refining, ammonia, methanol, steel, shipping fuels, power storage, and industrial decarbonization.
• What is the biggest risk in green hydrogen?
The biggest risk is execution: announced 2030 potential remains much larger than firm operating or FID-stage supply.
• What metrics should analysts track?
Track market value, installed electrolyze, FID, offtake, renewable power cost, production cost, policies, and infrastructure. This final reading keeps the statistics practical by connecting market growth with cost, policy, supply, infrastructure, and buyer readiness.
Final Takeaway
Green hydrogen statistics point to a market moving from climate ambition into industrial infrastructure. The headline forecast is large, but the practical test is execution: installed electrolyze, renewable power access, final investment decisions, bankable offtake, transport routes, storage, certification, and policy mechanisms that can turn announced capacity into operating supply.
The regional picture is uneven. Europe has strong policy direction and import demand, the United States is shaped by tax credits and hydrogen hubs, China brings manufacturing scale, India is building a production and export platform, and Australia, the Middle East, Chile, and parts of Africa are positioning around low-cost renewables and export corridors.
For analysts, developers, manufacturers, investors, and industrial buyers, the strongest reading is to compare market forecasts with real deployment signals. The best opportunities appear where cheap renewable electricity, electrolyze availability, infrastructure, certification, financing, and committed buyers overlap.


