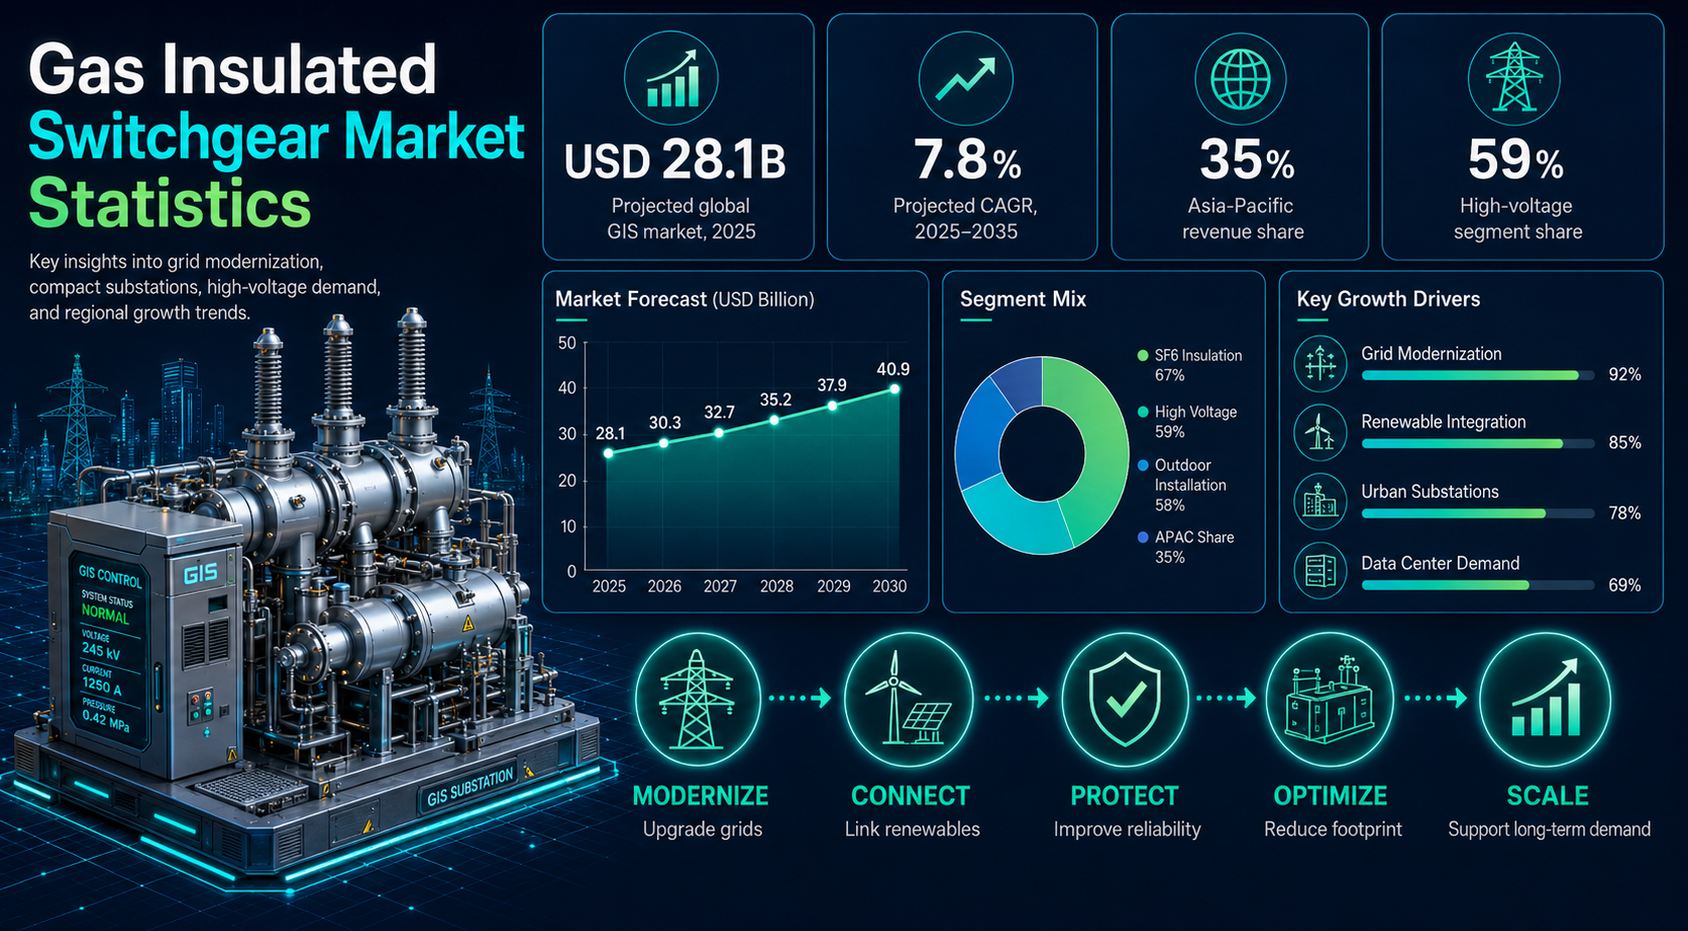
Gas insulated switchgear is becoming a core technology for modern power networks. Utilities, renewable developers, industrial operators, rail systems, data centers, and city planners need compact substations that can handle high-voltage power safely, reliably, and with less land. That makes GIS demand a useful signal for grid upgrade, not only equipment purchasing.
The strongest benchmarks show steady expansion. Future Market Insights places the global GIS market at USD 28.1 billion in 2025 and USD 59.6 billion by 2035, implying a 7.8% CAGR. Global Market Insights reports a 2024 value of USD 26.1 billion and a 2034 forecast of USD 55.8 billion, while segment data shows high-voltage GIS holding 59.0% share, outdoor GIS holding 58.5%, and SF6-insulated GIS holding 67.2% in 2025.
Executive Gas Insulated Switchgear Benchmarks
These are the statistics that frame the market. They show the scale of GIS demand, the expected growth path, the importance of high-voltage applications, the regional concentration in Asia-Pacific, and the demand pressure coming from grid upgrade, renewables, electricity growth, and high-load infrastructure.
The numbers defining the GIS market
• The global gas insulated switchgear market is estimated at USD 28.1 billion in 2025 and is projected to reach USD 59.6 billion by 2035.
• The 2025-2035 forecast implies a 7.8% CAGR.
• Global Market Insights places the market at USD 26.1 billion in 2024 and forecasts USD 55.8 billion by 2034.
• MarketsandMarkets projects the market from USD 28.00 billion in 2026 to USD 38.36 billion in 2031, with a 6.5% CAGR.
• Precedence Research estimates USD 34.35 billion in 2025 and USD 67.72 billion by 2035.
• Asia-Pacific is the largest regional GIS market with 35.0% revenue share in 2025.
• Asia-Pacific GIS revenue is estimated at USD 12.02 billion in 2025 and USD 24.12 billion by 2035.
• The United States GIS market is estimated at USD 6.4 billion in 2024, USD 6.84 billion in 2025, and USD 10.8 billion by 2032.
• India GIS market value is estimated at USD 1.55 billion in 2024 and USD 1.66 billion in 2025.
• High-voltage GIS is expected to hold 59.0% market share in 2025.
• The >72 kV to <=150 kV GIS range is expected to hold 34.0% market share in 2025.
• Outdoor GIS accounted for 58.5% of the market in 2025.
• SF6-insulated GIS captured 67.2% market share in 2025.
• Global electricity consumption increased by 1,080 TWh in 2024, and demand grew by 4.3% that year.
• Global data center electricity consumption is projected to reach around 945 TWh by 2030.
Why GIS Market Growth Now Carries Grid-Scale Importance
Gas insulated switchgear demand rises when power networks become more complex. A utility that needs to connect renewable generation, reinforce a dense city grid, replace aging substations, or support high-load industrial customers often has to solve for reliability and space at the same time. GIS is valuable because it places high-voltage switching equipment inside a compact gas-insulated enclosure, reducing footprint compared with traditional air-insulated designs.
That market context matters because electrical infrastructure is entering a multi-year upgrade cycle. Electricity demand is rising again in advanced economies, industrial electricity use is growing, transport electrification is accelerating, and data centers are becoming large grid customers. At the same time, solar, wind, and offshore wind projects require interconnection infrastructure, and transmission bottlenecks are forcing grid operators to plan higher-capacity substations and stronger networks.
Market-growth and grid-demand benchmarks
• Around USD 310 billion was invested in power grid infrastructure globally in 2023.
• Global investment in power grid infrastructure increased by 5.3% in 2023.
• Around USD 400 billion is spent on grids worldwide each year, compared with about USD 1 trillion spent on generation assets.
• Current annual grid investment is therefore about 40% of annual generation-asset investment globally.
• The United States accounted for 27.9% of global grid infrastructure investment in 2023, equal to about USD 86.5 billion.
• China accounted for 25.4% of global grid infrastructure investment in 2023, equal to about USD 78.9 billion.
• The U.S. and China together represented 53.3% of global grid infrastructure investment in 2023.
• Global electricity demand increased by 4.3% in 2024, compared with 2.5% in 2023.
• Average electricity demand growth from 2010 to 2023 was 2.7%.
• Global electricity demand is forecast to increase by 3.3% in 2025 and 3.7% in 2026.
• Industry electricity use grew by nearly 4% in 2024.
• Industry made up nearly 40% of total electricity demand growth in 2024.
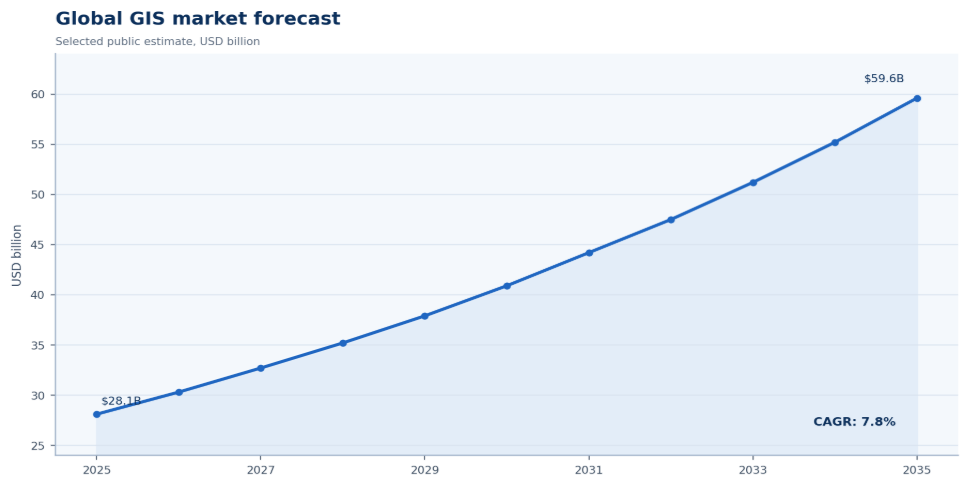
Figure 1. GIS market scale and grid-demand benchmarks should be reviewed together because compact substations become more valuable as networks carry higher loads.
Global GIS Market Size and Forecast
The global market-size picture should be read as a range rather than a single exact figure. Different research firms use different base years, segmentation assumptions, and regional models. Still, the overall direction is consistent: the GIS market is expected to expand steadily through the next decade as grid owners and industrial buyers invest in compact high-voltage assets.
This section separates the headline market value from the underlying business case. A market that grows from roughly the high USD 20 billions in the mid-2020s toward USD 50 billion or more in the mid-2030s is large enough to affect product portfolios, utility procurement strategies, component supply chains, and engineering capacity.
Global forecast benchmarks
• Future Market Insights estimates the global GIS market at USD 28.1 billion in 2025.
• The forecast reaches USD 40.91 billion by 2030 and USD 59.6 billion by 2035.
• Under the FMI forecast path, the market adds about USD 31.5 billion in value between 2025 and 2035.
• Global Market Insights estimates the market at USD 26.1 billion in 2024 and USD 55.8 billion by 2034.
• MarketsandMarkets places the 2026 market at USD 28.00 billion and the 2031 market at USD 38.36 billion.
• P&S Intelligence places the 2024 market at USD 25.1 billion and forecasts USD 37.4 billion by 2030.
• Precedence Research estimates USD 34.35 billion in 2025, USD 36.79 billion in 2026, and USD 67.72 billion by 2035.
• Across major market reports, the reported CAGR range is generally between about 6.5% and 7.8%.
| Source | Base Year | Base Value | Forecast Year | Forecast Value | CAGR |
|---|---|---|---|---|---|
| Future Market Insights | 2025 | USD 28.1B | 2035 | USD 59.6B | 7.8% |
| Global Market Insights | 2024 | USD 26.1B | 2034 | USD 55.8B | 7.8% |
| MarketsandMarkets | 2026 | USD 28.0B | 2031 | USD 38.36B | 6.5% |
| P&S Intelligence | 2024 | USD 25.1B | 2030 | USD 37.4B | 6.8% |
| Precedence Research | 2025 | USD 34.35B | 2035 | USD 67.72B | 7.02% |
Voltage Segment Statistics
Voltage segmentation is one of the most important ways to understand GIS demand. Medium-voltage systems support distribution and facility-level reliability, while high-voltage and extra-high-voltage assets are tied to larger substations, transmission corridors, renewable connection, and national grid expansion. Because higher-voltage systems usually carry larger project values, voltage mix can influence revenue more than unit volume alone.
Voltage demand benchmarks
• The high-voltage GIS segment is expected to lead with 59.0% market share in 2025.
• Using USD 28.1 billion, the high-voltage GIS segment equals roughly USD 16.58 billion in 2025.
• High-voltage GIS is estimated at USD 17.87 billion in 2026 and USD 19.27 billion in 2027.
• High-voltage GIS reaches about USD 24.14 billion by 2030.
• The >72 kV to <=150 kV product range is expected to hold 34.0% GIS market share in 2025.
• That product range is estimated at USD 9.55 billion in 2025, USD 10.30 billion in 2026, and USD 11.10 billion in 2027.
• The >72 kV to <=150 kV range could reach USD 20.26 billion by 2035.
• Low-voltage commercial GIS holds 69.2% of the commercial GIS segment.
• AC commercial GIS holds an estimated 80.0% commercial segment share.
| Voltage Segment | Typical Use Case | Market Meaning |
|---|---|---|
| Medium voltage | Distribution networks, commercial sites, industry | Supports dense urban distribution |
| High voltage | Transmission substations, renewable connection | Drives major revenue share |
| Extra-high voltage | Long-distance transmission, large substations | Linked to grid expansion |
| Ultra-high voltage | Large corridors, high-capacity transmission | Important in scale-led markets |
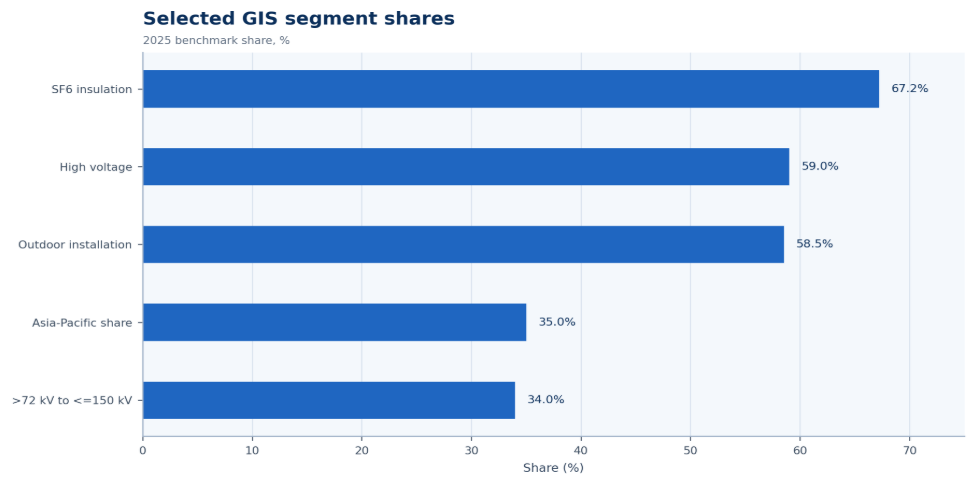
Figure 2. Segment shares show where GIS demand is concentrated across insulation, voltage, installation, and regional categories.
Installation Type Statistics: Indoor, Outdoor, and Hybrid GIS
Installation type explains the physical environment behind GIS demand. Indoor GIS is closely linked to urban substations, commercial districts, underground facilities, metro systems, and industrial sites where land is limited or exposed electrical infrastructure is undesirable. Outdoor GIS remains important in utility yards, transmission substations, renewable interconnection points, and large infrastructure projects where voltage scale and system reliability matter more than building integration.
Installation benchmarks
• Outdoor GIS accounted for 58.5% of the GIS market in 2025.
• Outdoor GIS revenue is estimated at USD 15.38 billion in 2025.
• Outdoor GIS revenue is estimated at USD 16.38 billion in 2026 and USD 18.58 billion in 2028.
• Outdoor GIS revenue reaches an estimated USD 23.92 billion by 2031.
• Outdoor GIS revenue could reach USD 34.87 billion by 2035.
• Indoor GIS is strongest where land, safety, noise, and footprint constraints matter.
• Hybrid GIS supports brownfield upgrades that need smaller footprints than AIS.
| Installation Type | Best-Fit Environment | Why It Matters |
|---|---|---|
| Indoor GIS | Urban, commercial, underground sites | Saves space and protects equipment |
| Outdoor GIS | Utility yards, transmission sites, renewables | Supports large-scale infrastructure |
| Hybrid GIS | Brownfield and mixed layouts | Balances cost, footprint, reliability |
SF6 and SF6-Free GIS Statistics
The insulation story is one of the most important modern angles in the GIS market. SF6 has been widely used because of its strong insulation and arc-quenching performance, but it also carries environmental pressure. That makes SF6-free GIS a procurement, compliance, and lifecycle-planning topic, not just a technical product feature. Utilities that buy equipment with long operating lives have to think about future regulation as well as today’s equipment cost.
SF6 and sustainability benchmarks
• SF6-insulated GIS captured 67.2% market share in 2025.
• SF6-insulated GIS equals roughly USD 17.67 billion in 2025.
• SF6-insulated GIS is estimated at USD 18.82 billion in 2026 and USD 20.04 billion in 2027.
• SF6-insulated GIS revenue reaches about USD 27.50 billion by 2031.
• SF6-insulated GIS could reach about USD 40.05 billion by 2035.
• SF6-free GIS demand is supported by utility decarbonization goals.
• Europe is the key regulatory region for SF6-free adoption.
• SF6-free alternatives are most visible in new projects and replacement programs.
| Insulation Type | Market Position | Key Advantage | Main Challenge |
|---|---|---|---|
| SF6 GIS | Dominant installed base | Proven performance | Regulatory pressure |
| SF6-free GIS | Growing in new procurement | Lower climate impact | Higher transition cost |
| Hybrid alternatives | Useful during transition | Reduces SF6 dependency | Needs careful engineering |
End-User GIS Demand Statistics
Utilities remain the anchor end-user category for GIS because transmission and distribution networks require high-reliability switching systems. However, the market is being influenced by a wider set of users. Renewable developers need grid interconnection. Data centers need high uptime and power density. Rail and metro systems need safe compact electrical infrastructure. Heavy industry, mining, oil and gas, and commercial campuses all require reliable high-load power control.
End-user benchmarks
• Power utilities are identified as the largest end-user category in the U.S. GIS market.
• Utility demand is linked to aging substations and reliability upgrades.
• Renewable developers need GIS where projects require compact interconnection substations.
• Data center electricity demand is projected to reach around 945 TWh by 2030.
• Data center electricity demand is projected to grow around 15% per year from 2024 to 2030.
• Industrial electricity use grew by nearly 4% in 2024.
• Transport electricity consumption increased by more than 8% in 2024.
• Commercial GIS is estimated at USD 5.80 billion in 2025 and USD 11.27 billion by 2035.
| End User | GIS Need | Demand Driver |
|---|---|---|
| Utilities | T&D reliability | Grid upgrades, renewables, replacement |
| Renewable developers | Grid connection, compact substations | Solar, wind, offshore, remote sites |
| Data centers | High uptime, compact systems | AI, cloud, digital infrastructure |
| Rail and metro | Safe compact switching | Transport electrification |
| Heavy industry | High-load power control | Electrification, uptime needs |
| Commercial infrastructure | Compact distribution, backup power | Buildings, campuses, airports |
Regional GIS Market Statistics
Regional data is essential because GIS demand is not one global story. Asia-Pacific is driven by scale, power demand, urbanization, transmission expansion, and renewable connection. North America is shaped by modernization, aging infrastructure, data centers, and renewable grid connection. Europe adds a stronger SF6-free and regulatory angle. The Middle East and Africa are influenced by utility expansion, industrial zones, and megaprojects. Latin America is more selective, with demand linked to renewable growth and transmission expansion.
Asia-Pacific
• Asia-Pacific held the largest GIS revenue share at 35.0% in 2025.
• Asia-Pacific GIS revenue is estimated at USD 12.02 billion in 2025.
• Asia-Pacific reaches USD 12.89 billion in 2026 and USD 15.88 billion in 2029.
• Asia-Pacific GIS revenue reaches USD 17.02 billion in 2030 and USD 24.12 billion by 2035.
• Asia-Pacific GIS CAGR is estimated near 7.2%–7.3% across source paths.
• China is a scale market for UHV transmission and renewable connection.
• India’s GIS market is estimated at USD 1.66 billion in 2025 and grows toward more than USD 3.3 billion by 2035.
• Southeast Asian electricity consumption jumped by more than 7% in 2024.
North America
• The U.S. GIS market is estimated at USD 6.4 billion in 2024 and USD 6.84 billion in 2025.
• The U.S. market is forecast to reach USD 10.8 billion by 2032, with a 6.9% CAGR.
• The U.S. West is the largest regional GIS market in the U.S. analysis.
• The U.S. South is the fastest-growing U.S. regional GIS market.
• U.S. grid infrastructure investment reached about USD 86.5 billion in 2023.
• The U.S. accounted for 27.9% of global grid infrastructure investment in 2023.
• The U.S. GRIP program received USD 3.9 billion in funding for grid upgrade.
• USDA allocated USD 300 million for rural clean-energy electricity providers.
Europe
• Europe high-voltage switchgear market value is estimated at USD 9.13 billion in 2025.
• Europe high-voltage switchgear reaches USD 9.71 billion in 2026 and USD 11.68 billion in 2029.
• Europe high-voltage switchgear reaches about USD 15.15 billion by 2035.
• Europe’s high-voltage switchgear growth path is estimated at around 6.36% per year from 2025 onward.
• European Union electricity consumption grew by about 1.5% in 2024.
• Europe is a key region for SF6-free GIS procurement.
• Germany, the U.K., France, and Nordic markets are important for clean-grid demand.
Middle East and Africa
• Middle East and Africa high-voltage switchgear market value is estimated at USD 2.40 billion in 2025.
• The MEA indicator rises to USD 2.53 billion in 2026 and USD 2.98 billion in 2029.
• MEA high-voltage switchgear reaches about USD 3.78 billion by 2035.
• The forecast path implies annual growth of about 5.57% for the region’s high-voltage switchgear indicator.
• Gulf infrastructure and renewable megaprojects are key GIS demand angles.
• Saudi Arabia and the UAE need compact high-voltage substation equipment for large projects.
Latin America
• Latin American GIS demand appears where renewables and transmission expansion overlap.
• Brazil is the strongest country-level opportunity in Latin America.
• Mexico demand is tied to industrial load, nearshoring, renewables, and grid reinforcement.
• Chile and Colombia are relevant for renewable development and network expansion.
• In Latin America, country-level project pipelines matter more than broad averages.
| Region | GIS Market Implication |
|---|---|
| Asia-Pacific | Scale-led growth from demand, grids, cities, renewables |
| North America | Modernization-led demand from aging grids, renewables, data centers |
| Europe | Sustainability-led demand from SF6-free rules and clean grids |
| Middle East & Africa | Infrastructure-led growth from utilities and megaprojects |
| Latin America | Selective growth from renewables and transmission |
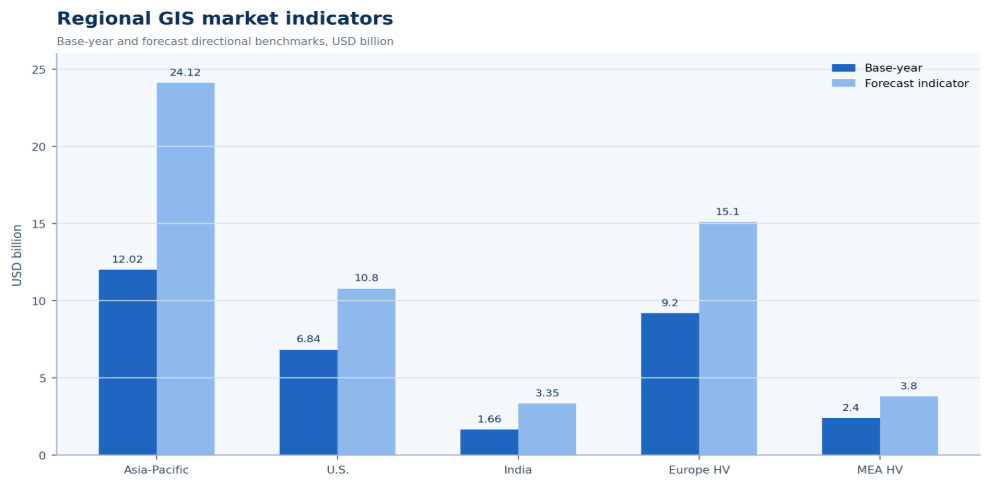
Figure 3. Regional GIS demand differs by scale, upgrade cycles, renewable connection, land pressure, and environmental regulation.
Country-Level GIS Market Statistics
Country-level analysis adds practical value because GIS purchasing is tied to local grid plans, utility procurement, renewable pipelines, voltage needs, and land constraints. A country with large electricity demand may not automatically create GIS demand unless grid investment, substation projects, and compact high-voltage needs are present. The most useful country statistics therefore combine market value with the operating reason behind adoption.
Country benchmarks worth separating
• The United States GIS market is estimated at USD 6.84 billion in 2025.
• The United States reaches USD 7.31 billion in 2026 and USD 10.8 billion by 2032.
• India’s GIS market is estimated at USD 1.55 billion in 2024 and USD 1.66 billion in 2025.
• India reaches an estimated USD 1.78 billion in 2026, USD 1.91 billion in 2027, and USD 2.20 billion in 2029.
• India’s GIS market reaches around USD 3.32 billion by 2035.
• China switchgear reaches USD 31.01 billion in 2025 and USD 36.45 billion in 2027.
• China switchgear growth is estimated at 8.42% annually.
• China high-voltage products are forecast at 10.41% CAGR to 2031.
• AC installations held 82.41% of China’s switchgear demand in 2025.
• The DC switchgear category records the fastest 9.32% CAGR to 2031.
| Country | Main Demand Driver | GIS Market Meaning |
|---|---|---|
| United States | Grid upgrades, data centers, renewables | Replacement-led demand |
| China | UHV, renewables, urban infrastructure | Scale-led grid demand |
| India | Power demand, renewables, electrification | Growth-led infrastructure demand |
| Germany | Energy transition, SF6-free procurement | Regulation-led demand |
| United Kingdom | Offshore wind, substation upgrades | Clean-grid reinforcement |
| Saudi Arabia | Utility growth, megaprojects | Infrastructure-led demand |
| Brazil | Renewables, transmission expansion | Selective grid-project demand |
Renewable Energy and Grid Integration Statistics
Renewable energy is one of the clearest long-term drivers behind GIS demand. Solar and wind projects often need new substations, interconnection equipment, grid reinforcement, and higher-capacity transmission links. Offshore wind and remote renewable generation can increase the need for compact high-voltage equipment because generation sites are not always close to load centers.
Renewable and grid-integration benchmarks
• Global renewable energy capacity is cited at around 3,864.52 GW in 2024.
• Renewable capacity growth increases pressure on transmission networks.
• Utility-scale solar and wind projects can create compact-substation demand.
• Offshore wind strengthens GIS demand in space-constrained substations.
• The U.S. solar driver shows solar generation expected to rise by 123 billion kWh from 2023 to 2025.
• Renewable integration is important where transmission expansion is a bottleneck.
• GIS demand rises when renewables meet high-voltage interconnection needs.
Urbanization and Compact Substation Demand
Urbanization is a practical GIS demand driver because dense cities create high load in locations where land is expensive and space for conventional substations is limited. Air-insulated equipment requires more clearance and a larger physical footprint. GIS reduces the space requirement and makes it easier to place substations indoors, underground, or in constrained utility sites. That is why urban power reliability and land pressure should be analyzed alongside market size.
Urban grid benchmarks and implications
• Urban GIS demand is strongest where land cost and load density are high.
• Indoor GIS is useful for city-center substations and underground facilities.
• Outdoor GIS helps utility yards add capacity without major footprint expansion.
• Smart city infrastructure can support compact GIS demand.
• Brownfield substation upgrades often require capacity without new land.
• Public safety and reliability are important urban GIS factors.
| Urban Constraint | GIS Advantage |
|---|---|
| Limited land availability | Smaller substation footprint |
| High load density | Supports compact switching |
| Underground or indoor installation | Fits constrained sites |
| Reliability expectations | Improves equipment protection |
| Public safety and aesthetics | Reduces exposed equipment |
| Brownfield upgrade pressure | Adds capacity without relocation |
Data Centers, AI Load Growth, and Industrial Electrification
Data centers and industrial electrification are not always direct GIS categories in market reports, but they are powerful demand signals. A data center campus, semiconductor plant, battery factory, mining operation, or electrified industrial site can require large power connections and high reliability. Those loads pressure utilities to reinforce substations and transmission networks, while private owners may need compact high-capacity electrical infrastructure on or near site.
Power-demand benchmarks
• Global data center electricity consumption is projected to reach around 945 TWh by 2030.
• Data center electricity demand is projected to grow around 15% per year.
• Industrial electricity use grew by nearly 4% in 2024.
• Transport electricity consumption increased by more than 8% in 2024.
• Industry contributed nearly 40% of total electricity demand growth in 2024.
• Advanced economies added 230 TWh of electricity consumption in 2024.
• Global electricity demand growth accelerated by 1.8 percentage points from 2023 to 2024.
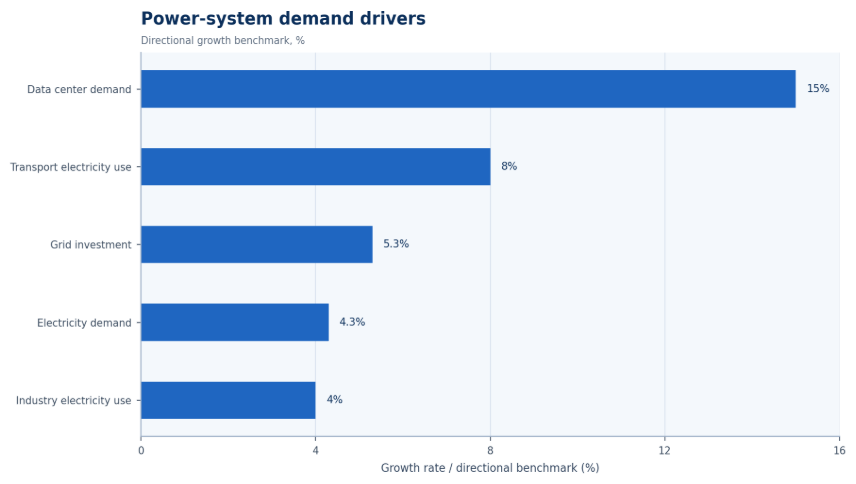
Figure 4. Electricity demand, grid investment, data centers, industry, and transport growth all support long-term GIS adoption.
Competitive Landscape and Manufacturer Strategy
The GIS competitive landscape is shaped by engineering depth, high-voltage product range, utility relationships, digital monitoring capability, service support, delivery reliability, and SF6-free innovation. Large electrical equipment manufacturers compete not only on the nameplate rating of switchgear, but also on lifecycle cost, compact design, substation integration, standards compliance, and the ability to support complex utility projects over many years.
Manufacturer strategy benchmarks
• Leading GIS manufacturers include ABB, Siemens Energy, Schneider Electric, Hitachi Energy, and GE Vernova.
• SF6-free product development is becoming a strategic differentiator.
• Digital GIS monitoring supports predictive maintenance and asset management.
• Compact modular GIS supports brownfield upgrades and urban substations.
• High-voltage product depth matters for utility and renewable interconnection projects.
• Retrofit and lifecycle service capability supports modernization demand.
• Delivery reliability matters because long equipment lead times can delay grid projects.
| Strategy | Why It Matters |
|---|---|
| SF6-free product development | Aligns with regulation and ESG |
| Digital monitoring | Supports predictive maintenance |
| Compact modular design | Helps urban and brownfield sites |
| High-voltage product range | Supports transmission and renewables |
| Retrofit and lifecycle services | Captures replacement demand |
| Project delivery capability | Reduces project delivery risk |
GIS Market Risks and Constraints
The GIS market has strong growth drivers, but adoption is not automatic. Buyers still compare GIS with air-insulated switchgear, hybrid configurations, and other electrical infrastructure options. The choice depends on footprint, voltage, reliability requirements, lifecycle cost, environmental rules, maintenance capability, and project schedule. A high headline CAGR does not remove the need for project-by-project justification.
Cost, maintenance, regulation, and supply-chain constraints
• GIS carries a higher upfront cost than air-insulated switchgear.
• SF6 regulation creates long-term planning risk for utilities that expect equipment to remain in service for decades.
• SF6-free alternatives may require new procurement standards and validation.
• Skilled maintenance needs can slow adoption in service-constrained markets.
• Long utility procurement cycles can slow reported market growth even when project demand is strong.
• Supply-chain delays can affect GIS project timelines.
• Air-insulated switchgear remains competitive where land is available.
| Constraint | What It Affects | How Buyers Respond |
|---|---|---|
| High upfront cost | Budgets and approvals | Compare lifecycle cost and land value |
| SF6 regulation | Procurement risk | Assess SF6-free options |
| Skilled maintenance | Reliability and service planning | Use monitoring and service contracts |
| Long lead times | Schedules and interconnection timing | Plan procurement earlier |
| AIS competition | Cost-sensitive open sites | Use GIS where footprint justifies cost |
GIS Market Opportunity Diagnostic
A polished GIS statistics article should help a reader decide where to look next. The most useful approach is not to chase one global CAGR, but to connect demand signals to practical opportunities. GIS demand becomes most attractive where multiple indicators overlap: high load growth, land constraints, renewable interconnection, aging substations, strict reliability needs, and regulation-driven equipment replacement.
| Opportunity Area | Core Signals to Measure | Why It Matters |
|---|---|---|
| Grid upgrades | Aging substations, outages, upgrades | Drives replacement demand |
| Renewable connection | Solar/wind additions, queues, congestion | Creates HV substation demand |
| Urban substations | Land cost, load density, underground sites | Supports compact adoption |
| SF6-free transition | Rules, ESG targets, procurement | Changes product mix |
| Data centers | Connections, uptime, load density | Supports high-capacity systems |
| Industrial electrification | Manufacturing, mining, transport load | Expands non-utility demand |
90-Day GIS Market Research Plan
Statistics become more useful when they are translated into a research workflow. For a GIS market project, the best starting point is to build a baseline, compare growth drivers, and then validate manufacturer and procurement signals. This keeps the article from becoming a list of facts and turns it into a practical planning model.
| Timing | What to Do | Output |
|---|---|---|
| Days 1-30 | Build baseline by region, voltage, installation, insulation, user | Clear GIS demand map |
| Days 31-60 | Compare grids, renewables, urban load, SF6-free rules, data centers | Priority opportunity list |
| Days 61-90 | Review suppliers, procurement, regulation, countries, pipelines | Market scorecard |
Metrics GIS Market Analysts Should Track
A useful scorecard should be detailed enough to show where GIS demand is coming from without becoming a vanity dashboard. The metrics below separate market size from demand quality, regional fit, segment mix, and procurement risk.
| Metric | Why It Matters |
|---|---|
| Global GIS market size | Shows total scale |
| CAGR range by report | Compares forecast confidence |
| Regional market share | Shows where demand is concentrated |
| Country-level demand | Identifies local opportunities |
| Voltage segment share | Shows where revenue is concentrated |
| Installation type | Separates indoor, outdoor, and hybrid demand |
| SF6-free adoption | Tracks product transition |
| Grid investment | Measures upgrade demand |
| Renewable additions | Signals interconnection needs |
| Data center load growth | Shows reliability pressure |
| Manufacturer launches | Tracks competitive direction and technology transition |
| Regulation | Shapes long-term equipment selection and lifecycle risk |
Utility Procurement and Replacement-Cycle Statistics
GIS adoption is shaped by how utilities buy long-life infrastructure. A power company does not replace a substation the way a business replaces software. Procurement usually moves through planning studies, engineering design, budget approval, tendering, factory testing, delivery, installation, commissioning, and maintenance planning. That makes the market slower than consumer technology, but it also creates durable demand once a project is approved.
Procurement benchmarks worth separating
• GIS projects often sit inside multi-year grid programs, so demand can appear in procurement pipelines before it appears in annual market revenue.
• The USD 28.1 billion 2025 market estimate should be read alongside long utility planning cycles because substation decisions usually affect assets for decades.
• High-voltage GIS demand is more sensitive to transmission planning than to short-term equipment replacement because project values are larger and engineering reviews are longer.
• Outdoor GIS with 58.5% market share shows that large utility yards, transmission sites, and renewable interconnection points remain important buying environments.
• Indoor GIS demand is strongest where land cost, outage risk, public safety, and space constraints justify a higher upfront equipment cost.
• SF6-free procurement is most likely to move first in utilities with formal decarbonization targets, strict environmental rules, or long-term asset-management frameworks.
• A utility evaluating GIS usually compares footprint, lifecycle cost, voltage class, maintenance access, insulation technology, and outage exposure rather than purchase price alone.
• Brownfield substations can create strong GIS demand because compact equipment may allow upgrades without acquiring new land.
• Renewable interconnection projects can pull GIS demand forward when developers need faster, compact, and high-reliability switching near constrained grid nodes.
• Data center grid requests can also influence GIS demand indirectly by pushing utilities to reinforce substations near high-load campuses.
| Procurement Signal | What It Indicates | GIS Market Meaning |
|---|---|---|
| Aging substations | Replacement pressure | Supports steady utility demand |
| Land-constrained sites | Limited expansion space | Strengthens indoor GIS case |
| Renewable queues | Interconnection pressure | Raises high-voltage demand |
| SF6 rules | Procurement change | Supports alternative-gas GIS |
| Data center load | High uptime needs | Adds reliability pressure |
Lifecycle Cost, Reliability, and Maintenance Statistics
The market case for GIS becomes clearer when the analysis moves beyond first cost. GIS can cost more than air-insulated switchgear at the equipment stage, but the business case can change when land, building work, outages, maintenance exposure, reliability, and asset life are included. This is why GIS often appears in dense cities, industrial zones, airports, metros, data centers, and high-value transmission nodes.
Reliability and lifecycle benchmarks
• GIS is commonly selected where compact footprint and equipment protection are more valuable than the lowest upfront switchgear cost.
• High-voltage systems with 59.0% market share show that reliability-sensitive transmission and grid-connection projects remain central to GIS revenue.
• The 67.2% SF6-insulated share shows that proven insulation performance still matters, even as alternatives gain policy and procurement attention.
• SF6-free alternatives are becoming more important because utilities must think about leakage, reporting, compliance, and end-of-life handling over the full asset cycle.
• A substation designed for 30 years or more must account for future regulation as well as current equipment price.
• Digital monitoring can improve the GIS value case when it helps teams detect gas pressure issues, temperature changes, partial discharge risks, or maintenance needs earlier.
• Industrial users often value GIS when an electrical outage can interrupt production, mining, refining, rail service, or critical facility operations.
• Urban utilities can justify GIS when a smaller substation footprint avoids land acquisition, permitting delays, public exposure, or building constraints.
• Lifecycle analysis is especially important in Europe, where SF6 policy pressure can affect long-term procurement, retrofit, and replacement planning.
• A strong GIS business case compares total project cost, not only equipment cost, because civil works, land value, outage risk, and maintenance access can change the economics.
| Lifecycle Factor | Why It Matters | GIS Planning Impact |
|---|---|---|
| Land value | Urban space is costly | Favors compact layouts |
| Outage risk | Downtime affects revenue | Raises reliability value |
| Maintenance access | Sites may be constrained | Supports enclosed systems |
| Regulation | SF6 rules may tighten | Encourages future-proofing |
| Asset life | Substations last decades | Makes lifecycle cost critical |
Digital GIS, Monitoring, and Smart Substation Statistics
Modern GIS demand is increasingly influenced by the move toward digital substations. Utilities are looking for equipment that can be monitored remotely, integrated with digital systems, and maintained more efficiently through reliable data. While this does not change the fundamental electrical function of GIS, it is influencing how buyers assess overall product value, service agreements, and long-term operational performance. Even supporting resources, such as an seo invoice template, can help businesses organize and present related service costs more professionally.
Smart substation benchmarks
• Digital monitoring is most useful where high-voltage equipment operates in critical substations, dense cities, industrial zones, or remote renewable sites.
• Predictive maintenance becomes more valuable when grid assets are aging and skilled maintenance teams are stretched across large service territories.
• Gas-pressure monitoring can support GIS reliability planning because insulation performance depends on stable operating conditions.
• Temperature, partial discharge, switching operation, and condition-monitoring data can help operators prioritize maintenance before failures become outages.
• Smart substations are especially relevant in markets investing heavily in renewables, because variable generation increases the need for flexible and observable grid infrastructure.
• Data center demand supports smart substation investment because high-load campuses require reliable power, fast fault response, and strong utility coordination.
• Digital GIS features can support manufacturer differentiation when equipment capacity, voltage rating, and compactness are otherwise similar.
• Service revenue can become more important as manufacturers offer monitoring, maintenance, retrofit, and lifecycle support around installed GIS assets.
• Utilities can use digital monitoring to compare asset condition across substations and reduce unnecessary field inspections at lower-risk sites.
• The strongest smart-GIS value case appears where reliability risk, high load density, and expensive outages overlap.
| Digital Feature | Operational Use | Market Value |
|---|---|---|
| Gas monitoring | Tracks insulation condition | Supports reliability |
| Thermal data | Flags abnormal heating | Improves maintenance |
| Partial discharge | Detects early risk | Protects critical assets |
| Remote diagnostics | Reduces site visits | Improves response time |
| Service analytics | Supports lifecycle care | Adds manufacturer value |
Country-Level Planning Signals for GIS Suppliers
Country-level analysis is important because the reason for GIS adoption changes by market. Some countries need GIS because transmission corridors are expanding. Others need it because cities are dense, offshore wind is growing, industrial zones require reliable power, or SF6 procurement rules are changing. A supplier that treats the market as one global average can miss where demand is most practical.
Country planning benchmarks
• The United States is a modernization-led market, with GIS demand tied to aging substations, data center growth, renewables, and reliability upgrades.
• China is a scale-led market because large grid programs, urban infrastructure, UHV transmission, and renewable connection can support high-voltage equipment demand.
• India is a growth-led market where power demand, electrification, industrial expansion, and renewable targets can support new substation capacity.
• Germany is a regulation-led and energy-transition market where SF6-free procurement, renewable grids, and replacement planning are especially important.
• The United Kingdom adds offshore wind and grid-reinforcement pressure, making high-voltage substations and coastal infrastructure important demand points.
• Saudi Arabia and the UAE are infrastructure-led markets where utility expansion, industrial zones, and megaprojects can support compact high-reliability equipment.
• Brazil and Mexico represent selective growth opportunities where renewable projects and transmission expansion can create targeted GIS demand.
• Japan and South Korea are reliability-led markets where dense urban grids, advanced utilities, and industrial load centers can support compact substation investment.
• Southeast Asian markets require local analysis because power demand, land constraints, utility budgets, and grid maturity differ sharply by country.
• Australia combines renewable buildout, mining loads, and grid-distance challenges, making transmission planning an important GIS demand signal.
| Market Type | Example Countries | GIS Demand Signal |
|---|---|---|
| Scale-led | China, India | Grid expansion and load growth |
| Modernization-led | United States, Canada | Aging assets and reliability |
| Regulation-led | Germany, EU markets | SF6-free procurement |
| Infrastructure-led | Saudi Arabia, UAE | Megaprojects and utilities |
| Renewables-led | Brazil, Australia, U.K. | Interconnection and transmission |
How Manufacturers Should Read the GIS Statistics
For manufacturers, the strongest statistics are not only market-size numbers. Segment shares, regional demand, voltage classes, insulation trends, utility procurement cycles, and lifecycle service needs all shape commercial strategy. A manufacturer may see the same global CAGR as competitors, but the winning strategy depends on where it can solve a more specific buyer problem.
Manufacturer strategy benchmarks
• A 7.8% long-term CAGR supports capacity planning, but it does not identify which voltage class or region should receive the most sales attention.
• The 35.0% Asia-Pacific share highlights the importance of scale markets, but country-level demand still varies between China, India, Japan, South Korea, and Southeast Asia.
• The 59.0% high-voltage share points manufacturers toward transmission, renewable interconnection, and utility reinforcement opportunities.
• The 58.5% outdoor installation share shows that large utility and infrastructure projects remain important even as indoor urban GIS demand grows.
• The 67.2% SF6-insulated share confirms that existing technology remains dominant, but it also creates a transition opportunity for SF6-free portfolios.
• Service, retrofit, and monitoring offers can help manufacturers capture value after the initial equipment sale.
• Lead-time reliability can become a competitive advantage because delayed high-voltage equipment can affect renewable, utility, and industrial project schedules.
• Local standards, utility relationships, testing requirements, and after-sales support can matter as much as headline product specifications.
• Manufacturers with both high-voltage capability and SF6-free roadmaps are better positioned for markets where regulation and grid expansion overlap.
• The most useful commercial scorecard combines market size, regional share, voltage mix, insulation type, service opportunity, and procurement timing.
| Manufacturer Focus | Why It Matters | Useful Signal |
|---|---|---|
| High-voltage range | Targets larger projects | 59.0% segment share |
| SF6-free roadmap | Supports regulation-led demand | EU procurement pressure |
| Regional sales depth | Improves local fit | APAC 35.0% share |
| Service capability | Adds lifecycle value | Monitoring and retrofit |
| Delivery reliability | Protects project schedules | Utility lead times |
Gas Insulated Switchgear Market Statistics FAQ
What is the size of the gas insulated switchgear market?
The market is commonly placed in the high USD 20 billions to low USD 30 billions in the mid-2020s, depending on source and base-year method. Future Market Insights estimates USD 28.1 billion in 2025, Global Market Insights reports USD 26.1 billion in 2024, and Precedence Research estimates USD 34.35 billion in 2025.
How fast is the GIS market growing?
Most leading forecasts place GIS growth in a mid-to-high single-digit range. Available market forecasts include CAGR estimates of 6.5%, 6.8%, 7.02%, and 7.8%, with many projections showing steady growth through 2030, 2031, 2034, or 2035.
Which region leads the GIS market?
Asia-Pacific is the leading region with 35.0% revenue share in 2025 and an estimated USD 12.02 billion in regional GIS revenue. The region benefits from China, India, Southeast Asia, urbanization, renewable connection, and grid expansion.
Why is GIS used instead of air insulated switchgear?
GIS is used when compact footprint, high reliability, environmental protection, or indoor/underground installation matters. Air-insulated switchgear can remain more economical where land is available and space constraints are less severe.
What is driving GIS market growth?
The main drivers are grid upgrades and renewable connection, urban land constraints, industrial electrification, data center power demand, high-voltage transmission expansion, and SF6-free technology transition.
What is SF6-free GIS?
SF6-free GIS uses alternative insulation technologies designed to reduce climate-related concerns linked to SF6 gas. It is gaining attention because utilities and regulators are paying more attention to lifecycle emissions and long-term compliance risk.
Which end users buy gas insulated switchgear?
Utilities are the largest anchor users, but GIS demand also comes from renewable developers, industrial facilities, data centers, rail and metro systems, airports, commercial infrastructure, oil and gas facilities, and mining operations.
What metrics should GIS companies track?
GIS companies should track global market size, CAGR range by report, regional share, country-level demand, voltage segment share, installation type, SF6-free adoption, grid investment, renewable additions, data center load growth, manufacturer launches, and regulation.
Final Takeaway
Gas insulated switchgear statistics point to one clear conclusion: GIS is becoming a core power-infrastructure technology rather than a narrow substation product. Market growth is tied to the same forces reshaping electricity systems worldwide: higher loads, renewable connection, urban land pressure, aging grids, industrial electrification, and the need for reliable high-voltage switching in compact spaces.


