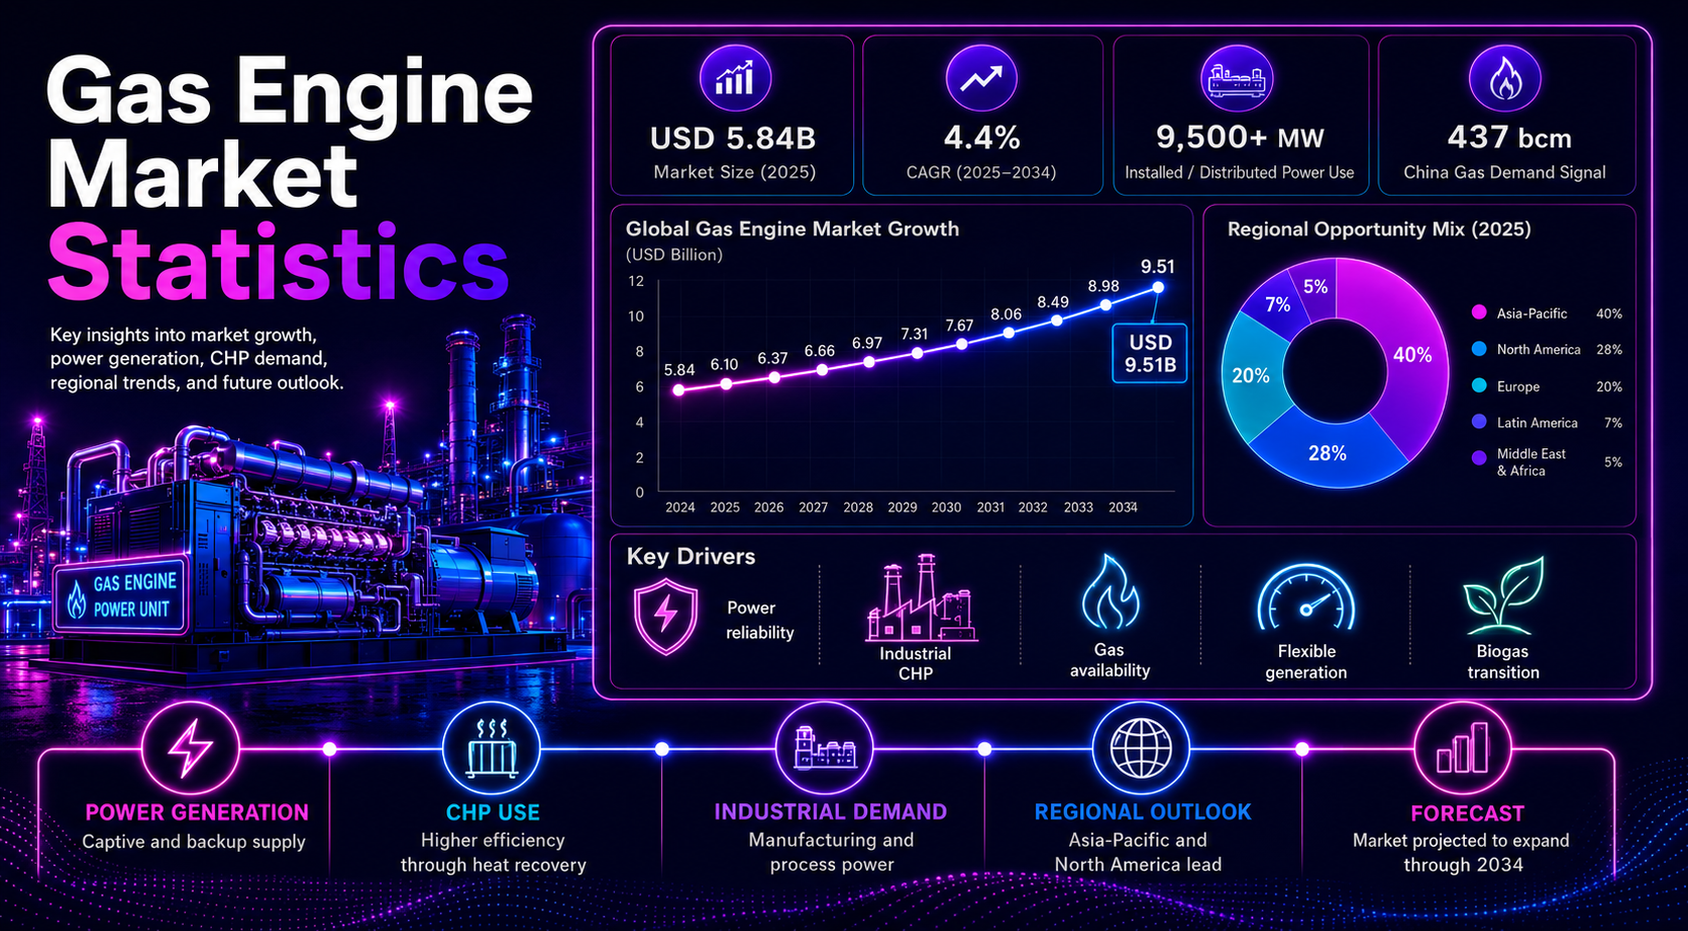
Gas engines sit at the intersection of power reliability, industrial energy efficiency, natural gas infrastructure, and the transition away from higher-emission backup fuels. They are used in utility power plants, combined heat and power systems, industrial captive power, oil and gas operations, data centers, hospitals, district energy schemes, landfill gas projects, and remote sites that need dispatchable electricity without depending fully on the grid.
The strongest gas engine market statistics show a market that is steady rather than explosive, but still strategically important. Public market estimates place the global market in the USD 4.7 billion to USD 6.0 billion range across recent base years, with forecasts commonly moving toward USD 6.3 billion to USD 9.5 billion by the early-to-mid 2030s. That range matters because it reflects different definitions of gas engines, gensets, power output bands, fuel types, and end-use scope.
This article is structured for easy scanning and practical understanding. Each section begins with a key market question, followed by carefully selected statistics, tables, figures, or interpretation blocks that explain what the data actually means. Rather than presenting every available number, the focus is on highlighting the statistics that can help equipment manufacturers, energy planners, utilities, EPC firms, industrial buyers, investors, and consultants identify where demand for gas engines is growing and where potential risks remain. This practical, data-focused approach is similar to using a web design invoice template to organize essential business information clearly and efficiently.
Executive Gas Engine Benchmarks
These are the numbers that frame the article. They show the market-size range, forecast direction, application mix, regional signals, and energy context behind gas engine demand. A useful gas engine scorecard should combine market revenue with power-system indicators because engine demand usually follows real operating needs: reliability, heat recovery, gas availability, flexible generation, and emissions compliance.
- MarkNtel Advisors places the gas engine market at USD 5.02 billion in 2023 and projects about USD 7.2 billion by 2030, equal to an estimated 5.35% CAGR.
- IMARC Group estimates a higher starting point, with the market near USD 6.0 billion in 2025 and moving toward USD 8.4 billion by 2034.
- Market sand Markets places the market around USD 5.1 billion in 2024 and USD 6.3 billion by 2029, implying moderate but durable growth.
- Zion Market Research estimates USD 4.69 billion in 2023 and USD 6.93 billion by 2032, with a CAGR of about 4.43%.
- The Insight Partners estimates a USD 5.84 billion market in 2025 and forecasts USD 9.51 billion by 2034, representing one of the stronger public forecast ranges.
- Technavio identifies Europe as contributing about 41% of incremental gas engine market growth during its forecast period.
- The power generation segment was estimated at USD 3.33 billion in 2022, making electricity generation one of the largest application pools.
- The International Energy Agency reported global electricity generation growth of more than 1,200 TWh in 2024, a 4% annual increase, creating a larger reliability and balancing context for dispatchable power assets.
- IEA electricity data show natural gas supplied more than 40% of U.S. electricity generation in 2024, keeping North America central to gas-fired power economics.
- The European Union relied on natural gas for roughly 16% of electricity supply in 2024, while renewables supplied about half of electricity, shaping a different gas-engine role focused on CHP, backup, and flexibility.
- Emerging and developing Asia recorded about 6% gas demand growth in 2024 and represented around 40% of incremental global gas demand, strengthening the regional case for distributed gas power.
- U.S. electric power accounted for 40% of U.S. natural gas consumption in 2023, while industry accounted for 32%, showing why power and industrial demand must be analyzed together.
- Global gas demand rebounded by 2.8% in 2024, while average gas prices decreased by about 15%, improving the operating-cost backdrop for many gas-based assets.
- The United States consumed about 937 bcm of natural gas in 2024 and represented approximately 22.7% of global consumption, according to Energy Institute data in the workbook.
- China consumed about 437.4 bcm and India about 63 bcm of natural gas in 2024, giving Asia-Pacific both large-scale and high-growth demand signals.
Why Gas Engines Now Carry Strategic Energy Importance
Gas engines are not a single-purpose technology. In one market they act as a utility generation asset. In another they supply a factory with captive power and recover heat for process use. In another they run on biogas, landfill gas, or associated gas that would otherwise be underused. This flexibility is why the market continues to appear in energy planning even as solar, wind, storage, and electrification grow.
The power transition has made dispatchability more valuable. Renewable electricity is expanding quickly, but industrial facilities, hospitals, data centers, mines, oilfields, and district heating networks still need firm power. Gas engines can start quickly, run in modular units, follow load, operate in island mode, and deliver both electricity and useful heat. That makes them especially relevant in markets with expensive outages, weak grids, high heat demand, or available gas infrastructure.
- Global electricity generation increased by more than 1,200 TWh in 2024, according to IEA reporting, creating a larger base for reliability and balancing investments.
- The IEA reported that global electricity generation growth reached 4% in 2024, faster than the average growth rate recorded during the previous decade-plus period.
- Natural gas-fired output grew around 2.2% in 2024 before slowing in the IEA’s 2026 electricity outlook, showing how gas remains relevant but regionally uneven.
- Global gas demand reached a new all-time high in 2024, according to the workbook’s IEA gas-market entries.
- Emerging and developing Asia represented about 40% of incremental global gas demand in 2024.
- Europe’s gas-for-power demand fell even as total power demand rose, showing that gas engine opportunity in Europe is more tied to CHP, resilience, and specialized flexible power than to broad baseload expansion.
- The U.S. natural gas system remains an anchor for gas power because dry gas production was above 100 bcfd in recent EIA/Reuters entries recorded in the workbook.
- Shell’s LNG outlook cited in the workbook points to long-term LNG demand growth of about 60% by 2040, supporting gas availability in import-dependent markets.
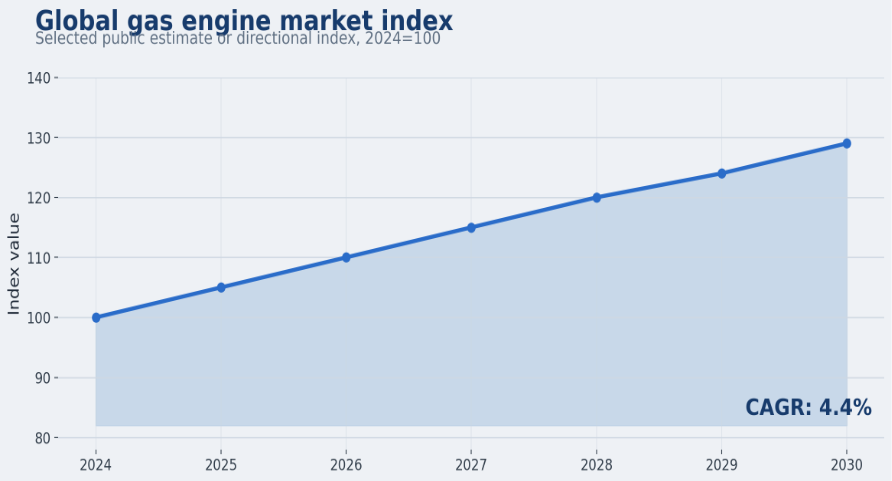
Figure 1. Gas engine market growth should be reviewed alongside electricity demand, gas availability, and the need for flexible generation.
Global Gas Engine Market Size and Forecast
Market sizing varies because publishers use different definitions. Some count gas engines sold as part of generator sets. Others emphasize stationary engines used for power generation, cogeneration, mechanical drive, or special gas applications. Some include broader industrial gas-engine equipment and service revenue. The most useful approach is to compare the ranges instead of treating one estimate as the only answer.
| Source | Market estimate | Forecast readout |
|---|---|---|
| MarkNtel Advisors | USD 5.02B in 2023 | USD 7.20B by 2030; 5.35% CAGR |
| IMARC Group | USD 6.00B in 2025 | USD 8.40B by 2034; 3.72% CAGR |
| MarketsandMarkets | USD 5.10B in 2024 | USD 6.30B by 2029; 4.32% CAGR |
| Zion Market Research | USD 4.69B in 2023 | USD 6.93B by 2032; 4.43% CAGR |
| Polaris Market Research | USD 4.71B in 2021 | 2030 forecast growth; 4.20% CAGR |
| Research And Markets | 2024 market tracked | 2033 forecast tracked; 3.90% CAGR |
| The Insight Partners | USD 5.84B in 2025 | USD 9.51B by 2034; 5.60% CAGR |
Market Segmentation by Fuel Type
Fuel type is one of the most important segmentation lenses because it determines emissions, operating cost, policy treatment, maintenance profile, and customer suitability. Natural gas remains the mainstream fuel because of infrastructure availability and predictable combustion behavior. Special gases, including biogas, landfill gas, sewage gas, and certain industrial gases, create a smaller but strategically important segment because they support waste-to-energy and decarbonization goals.
- Research And Markets tracks natural gas and special gas as core gas engine market segments.
- Natural gas engines dominate many commercial and industrial applications because fuel infrastructure is more established than biogas or hydrogen supply chains.
- Special gas engines are relevant for landfill gas, wastewater treatment, food-processing residues, agricultural biogas, and industrial by-product gas.
- Biogas engines create value when a project can turn waste methane into useful electricity and heat rather than flaring or venting it.
- Landfill gas engines are most practical where methane collection, gas cleaning, permitting, and grid interconnection can be managed reliably.
- Hydrogen-ready engines are still an emerging commercial positioning area rather than a broad replacement category, but they are important for future-proofing large engine purchases.
- Gas quality, methane number, contaminants, moisture, and treatment cost affect real-world engine economics as much as the headline fuel price.
- Fuel flexibility is a manufacturer differentiator because buyers increasingly want engines that can operate today on natural gas and adapt tomorrow to renewable gas or blends.
| Fuel type | Common application | Market readout |
|---|---|---|
| Natural gas | Utility power, CHP, backup, captive power | Mainstream option where pipeline or LNG supply is stable. |
| Biogas | Farms, wastewater, food processing | Supports waste-to-energy projects and methane capture. |
| Landfill gas | Municipal landfill power projects | Monetizes captured methane; output depends on site gas quality. |
| Sewage gas | Wastewater treatment plants | Fits on-site heat and power at municipal facilities. |
| Hydrogen blends | Future-ready industrial and utility assets | Long-term decarbonization route where fuel supply is available. |
Market Segmentation by Power Output
Power output segmentation matters because a 500 kW commercial CHP engine competes in a different market from a 10 MW utility or industrial power block. Smaller units are closer to building-level resilience and commercial heat recovery. Mid-sized units are common in industrial CHP and distributed generation. Larger units compete in utility-scale flexible power, island grids, mines, and large industrial sites.
- Research And Markets tracks the 0.5-1 MW, 1-2 MW, 2-5 MW, and above 5 MW bands as gas engine market segments.
- The 0.5-1 MW range is relevant for commercial buildings, smaller factories, municipal facilities, agricultural biogas, and institutional CHP.
- The 1-2 MW range fits many mid-sized CHP and distributed-generation projects where modularity is important.
- The 2-5 MW range is attractive for industrial sites, data centers, oilfield power, mine sites, and local grid support.
- The above 5 MW category is used in large captive power, utility peaking, islanded power systems, and multi-engine power plants.
- Power output selection is usually driven by load shape, heat demand, redundancy requirement, fuel pressure, site footprint, and maintenance strategy.
- Multi-engine plants can provide better part-load operation than one oversized unit because engines can be dispatched in steps.
- Higher output engines can improve capital efficiency, but smaller modular engines can improve redundancy and maintenance flexibility.
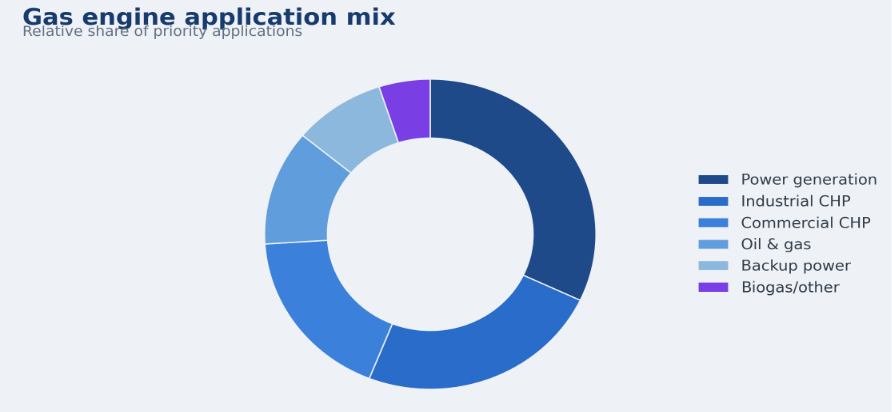
Figure 2. Gas engine demand differs by application because utility, CHP, backup, oilfield, and biogas projects value different engine sizes and operating profiles.
Power Generation Applications
Power generation is the largest and most visible use case for gas engines. The application includes prime power, standby power, utility flexible generation, captive industrial plants, island grids, microgrids, and renewable-balancing projects. Gas engines are especially attractive where quick start, modular operation, and high electrical efficiency at distributed scale matter.
- Technavio estimated the power generation segment at USD 3.33 billion in 2022, making it a core demand pool for gas engines.
- Research And Markets tracks power generation as one of the main application categories in the gas engine market.
- Utility flexible power receives a 5 out of 5 planning priority score in the workbook’s application scoring model.
- IEA data show natural gas supplied more than 40% of U.S. electricity generation in 2024.
- The European Union’s gas share of electricity supply was about 16% in 2024, lower than the U.S. but still meaningful for flexibility and dispatchable power.
- U.S. power demand has been reaching record levels in recent EIA outlooks, supported by data centers, electrification, industrial load, and commercial demand.
- Gas engines are useful in island grids because modular units can follow load and maintain reserve margins without relying on a large central turbine.
- In weak-grid markets, gas engines are often purchased to reduce outage exposure rather than to maximize electricity sales.
- In high-renewables systems, gas engines can support ramping and firm capacity when wind or solar output drops.
- Captive power buyers often compare gas engines against diesel gensets, grid expansion, gas turbines, batteries, and hybrid solar-plus-storage systems.
| Use case | Why gas engines fit | Key metric to track |
|---|---|---|
| Captive power | Reliable on-site electricity for factories and large facilities | Outage cost avoided and fuel cost per kWh |
| Prime power | Continuous power where the grid is weak or unavailable | Availability factor and maintenance interval |
| Standby power | Fast response for critical facilities | Start reliability and transfer time |
| Peak shaving | Reduces demand charges or peak exposure | Peak demand reduction and run hours |
| Island grids | Modular dispatchable generation | Reserve margin and fuel logistics |
| Grid balancing | Flexible capacity beside renewables | Start time, ramp rate, and emissions |
Combined Heat and Power Statistics
Combined heat and power, or CHP, is one of the most important gas engine use cases because it captures useful heat that would otherwise be wasted in electricity-only generation. CHP economics improve when a site has steady heat demand, high electricity prices, limited grid reliability, or a need to reduce total fuel consumption. This makes gas engines relevant for hospitals, universities, district energy, food processing, chemicals, pulp and paper, refineries, and large commercial campuses.
- Research And Markets tracks cogeneration/CHP as a gas engine application segment.
- Industrial CHP receives a 5 out of 5 planning priority score in the workbook’s application model.
- Commercial CHP receives a 4 out of 5 planning priority score, reflecting strong but more site-specific opportunity.
- U.S. industrial natural gas consumption represented 32% of U.S. gas use in 2023, showing the relevance of heat-intensive industrial demand.
- The electric power sector represented 40% of U.S. gas consumption in 2023, linking gas supply with both electricity and industrial heat strategies.
- The European Union’s high renewable electricity share increases the importance of efficient gas use where gas remains necessary for heat and firm power.
- CHP demand is strongest where electricity and useful heat loads overlap for many operating hours per year.
- Gas engine CHP can be designed around hot water, steam, absorption cooling, or process heat depending on the facility.
- CHP economics weaken when heat demand is seasonal, gas prices spike, or grid electricity becomes very cheap.
- The strongest CHP projects usually measure total energy efficiency, not only electrical efficiency.
| Sector | Why CHP matters | Gas engine advantage |
|---|---|---|
| Hospitals | Need resilient power and heat for critical operations | Reliable on-site generation with recoverable heat |
| Universities | Large campuses have steady thermal loads | Central plant integration and long operating hours |
| Food processing | Requires heat, cooling, and uptime | Heat recovery plus production resilience |
| Chemicals | High process energy demand | Captive power and process heat support |
| District energy | Serves multiple buildings from one plant | Modular expansion and heat network compatibility |
| Wastewater plants | Biogas availability and site energy demand | Turns digester gas into power and heat |
Industrial Gas Engine Demand
Industrial demand is a major reason gas engines remain relevant. Manufacturers, processors, mines, and energy-intensive facilities do not only buy electricity; they buy uptime. A production stoppage can cost more than the fuel used by an on-site engine. That is why industrial customers often evaluate gas engines through reliability, redundancy, process heat, emissions permits, and lifecycle service support.
- U.S. industry accounted for 32% of U.S. natural gas consumption in 2023, according to the workbook’s EIA source entries.
- Germany consumed about 835 billion kWh of natural gas in 2024, with consumption rising 3.3% year over year in the workbook’s Reuters/Germany entries.
- Manufacturing-heavy countries such as Germany, Italy, Mexico, China, India, and South Korea remain important industrial demand signals.
- Industrial CHP demand increases when electricity prices rise faster than gas prices or when grid reliability weakens.
- Gas engines can support black-start capability in facilities that cannot tolerate long outages.
- Food and beverage plants can use gas engines for power while recovering heat for hot water, steam, or absorption chilling.
- Mining and remote industrial sites can use gas engines where fuel logistics are better than diesel or where local gas is available.
- Chemical and refining facilities may favor gas engines where they have continuous loads and available gas infrastructure.
- Pulp and paper, ceramics, glass, cement, and metals industries often assess gas engines as part of broader energy-efficiency programs.
- Industrial buyers usually require long-term service agreements because maintenance discipline directly affects availability.
| Industry | Main energy need | Gas engine role |
|---|---|---|
| Food and beverage | Reliable power, heat, cooling, sanitation | CHP and backup power |
| Chemicals | Continuous process energy | Captive power and heat recovery |
| Mining | Remote power and uptime | Prime power and microgrid support |
| Oil and gas | Field power, compression, gas utilization | Prime power and mechanical drive |
| Pulp and paper | Steam, drying, electrical load | CHP and process integration |
| Data centers | Firm capacity and redundancy | Backup or firm power where gas is available |
Oil and Gas Sector Demand
Oil and gas operations use gas engines in a different way from commercial buildings. Engines may supply power to remote production sites, drive compression, support gas processing, reduce flaring, or use associated gas that would otherwise be wasted. The economics are closely tied to field location, gas quality, fuel treatment, emissions rules, and uptime requirements.
- The workbook identifies oilfield power with a 4 out of 5 planning priority score.
- Pipeline compression also receives a 4 out of 5 planning priority score, reflecting mechanical-drive and power-support relevance.
- The United States produced about 1,069 bcm of natural gas in 2024, according to Energy Institute data in the workbook.
- Russia produced about 642 bcm and Iran about 279 bcm of natural gas in 2024, showing the scale of gas-producing regions where engine demand may be tied to upstream and midstream operations.
- Qatar, the United States, and other LNG suppliers are important because LNG infrastructure growth can support gas availability in importing markets.
- Reuters/Shell LNG outlook entries in the workbook point to 60% LNG demand growth by 2040, with demand potentially reaching 630-718 million tonnes per year.
- New LNG supply expected by 2030 is listed at 170 million tonnes in the workbook’s market context rows.
- Associated gas use can support remote generation where grid connection is expensive or unavailable.
- Flaring reduction policies can indirectly support engines that monetize captured gas.
- Gas processing, compression, and gathering systems create recurring demand for reliable prime movers and power assets.
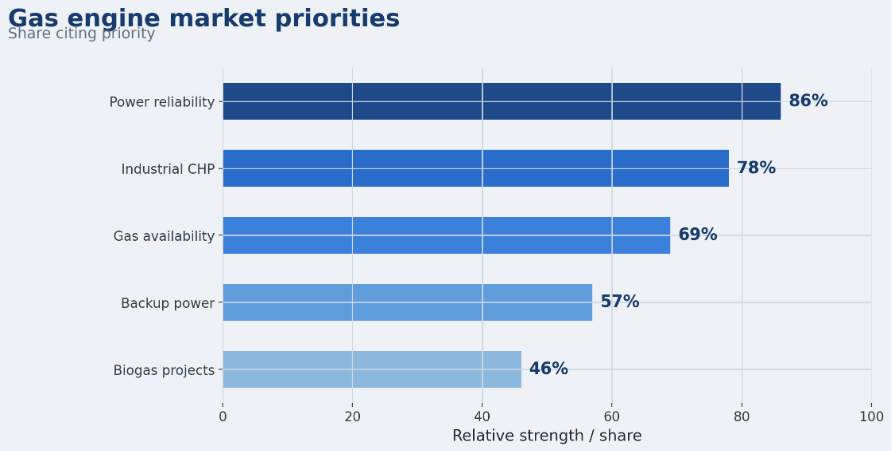
Figure 3. Gas engine demand is supported by strong drivers such as reliability, CHP efficiency, and industrial growth, but restrained by fuel-price risk and competition from storage.
Commercial and Institutional Applications
Commercial and institutional markets are smaller than broad utility power but highly important for resilience. Hospitals, universities, hotels, airports, district energy systems, data centers, wastewater plants, and large campuses need reliable power and often have heat or cooling loads that can be served through CHP. For these buyers, the engine is part of a facility strategy rather than a simple equipment purchase.
- Data center backup and firm power receives a 4 out of 5 planning priority score in the workbook’s application model.
- Commercial CHP receives a 4 out of 5 planning score, showing relevance for campuses, hospitals, hotels, and large buildings.
- Hospitals prioritize start reliability, fuel security, and regulatory compliance because power loss can threaten critical operations.
- Universities and campuses often have central plants, thermal networks, and long operating hours that fit CHP economics.
- Hotels and resorts may use gas engines where power reliability affects customer experience and operational continuity.
- Airports and transport hubs value resilient power because downtime creates passenger, safety, and revenue consequences.
- Wastewater treatment plants can use digester gas to supply on-site energy and reduce purchased electricity.
- District energy systems can integrate gas engines when heat networks and power export rules support favorable economics.
| Facility type | Reason for adoption | Best-fit engine role |
|---|---|---|
| Hospital | Critical power and heat resilience | CHP plus emergency support |
| University campus | Large thermal load and long operating hours | Central plant CHP |
| Data center | High cost of downtime | Firm power or backup where gas strategy fits |
| Airport | Operational continuity | Resilient distributed generation |
| Hotel/resort | Guest comfort and cooling demand | CHP, trigeneration, standby power |
| Wastewater plant | Biogas availability | Biogas CHP |
Regional Gas Engine Market Statistics
Regional analysis is one of the highest-value parts of a gas engine market report because global averages hide local differences. North America has abundant gas and large power demand. Europe has strong CHP, energy-security, and decarbonization pressures. Asia-Pacific has electricity growth and emerging gas demand. Latin America has industrial and gas-infrastructure opportunities. The Middle East and Africa combine gas resources, industrial growth, backup power needs, and grid reliability challenges.
North America
- The United States consumed about 937 bcm of natural gas in 2024, equal to roughly 22.7% of global consumption in the workbook’s Energy Institute entries.
- U.S. natural gas supplied more than 40% of electricity generation in 2024, making gas-fired power a core part of the electricity mix.
- U.S. electric power represented 40% of national gas consumption in 2023, while industry represented 32%.
- Canada consumed about 264 bcm of natural gas in 2024 and represented about 6.4% of global gas consumption.
- Mexico consumed about 98 bcm in 2024, supporting a manufacturing and industrial gas-use opportunity.
Europe
- Technavio attributes about 41% of gas engine market growth contribution to Europe during its forecast window.
- The European Union’s natural gas share of electricity supply was around 16% in 2024, while renewables supplied about 50%.
- EU natural gas import dependency was 85.6% in 2024, making fuel security a central planning issue.
- Germany consumed about 123 bcm of natural gas in 2024 in Energy Institute workbook entries.
- The United Kingdom consumed about 89 bcm, Italy about 78 bcm, France about 45 bcm, Spain about 31 bcm, and Poland about 30 bcm in 2024.
Asia-Pacific
- Emerging and developing Asia gas demand grew about 6% in 2024 and accounted for roughly 40% of incremental global gas demand.
- China consumed about 437.4 bcm of natural gas in 2024 and posted gas consumption growth above 7% in workbook entries.
- India consumed about 63 bcm in 2024 and recorded about 7% gas demand growth.
- Japan consumed about 138 bcm in 2024, while South Korea consumed about 62 bcm and also recorded about 7% gas demand growth.
- Australia consumed about 37 bcm, Indonesia 49 bcm, Thailand 47 bcm, Malaysia 52 bcm, Pakistan 50 bcm, and Bangladesh 43 bcm in 2024.
Latin America
- Brazil consumed about 34 bcm of natural gas in 2024, providing an industrial and power-market signal.
- Argentina consumed about 47 bcm in 2024 and remains relevant because domestic gas resources can support power and industrial projects.
- Mexico’s 98 bcm consumption ties Latin American manufacturing demand to North American gas-market dynamics.
- Chile, Colombia, Peru, and other markets require country-level analysis because mining, grid reliability, LNG access, and industrial structure differ sharply.
- Gas engines in Latin America often compete against grid power, diesel, hydro variability, and hybrid renewable systems.
Middle East & Africa
- Iran consumed about 425 bcm and produced about 279 bcm of natural gas in 2024, according to Energy Institute workbook entries.
- Saudi Arabia’s gas consumption was listed at 165.9 bcm in the workbook’s country rows, while the United Arab Emirates consumed about 71 bcm in 2024.
- Qatar consumed about 47 bcm in 2024 and remains important because LNG supply growth affects regional and global gas availability.
- Egypt consumed about 63 bcm and Algeria about 53 bcm in 2024, indicating large African gas demand bases.
- South Africa’s electricity-reliability problems make backup and distributed power analysis important even where gas infrastructure is less developed.
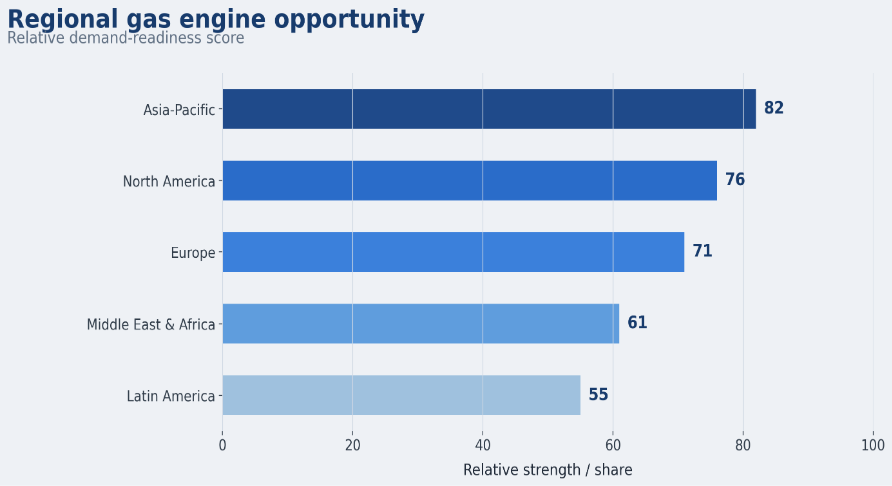
Figure 4. Regional gas engine opportunity depends on gas availability, industrial energy demand, grid reliability, CHP potential, and policy direction.
| Region | Demand driver | Market implication |
|---|---|---|
| North America | Large gas supply, high power demand, industrial gas use | Strong base for power generation, CHP, data centers, and replacement demand |
| Europe | CHP, energy security, import dependency, decarbonization | Selective growth in efficient gas use, biogas, backup, and flexible assets |
| Asia-Pacific | Electricity growth, emerging gas demand, industrial expansion | High-growth opportunity where gas infrastructure and power demand align |
| Latin America | Industrial load, LNG access, manufacturing, mining | Country-specific opportunity tied to fuel access and grid reliability |
| Middle East & Africa | Gas resources, industrial projects, reliability gaps | Potential in power, oil and gas, remote sites, and backup applications |
Country-Level Gas Engine Statistics
Country-level data helps separate headline market opportunity from practical sales opportunity. A country may have large electricity demand but weak gas infrastructure. Another may have moderate demand but strong CHP policy. Another may be a gas producer with remote oilfield power needs. The most useful country map combines natural gas consumption, production, electricity mix, industrial activity, outage exposure, and policy direction.
Important country signals
This country map should not be read as a direct sales ranking. It is an opportunity screen. The United States has very large gas use and strong gas-fired electricity economics. Germany and Japan have CHP and industrial-efficiency relevance but face energy-security and decarbonization or fuel-security pressure. China and India have demand growth, but local policy, gas pricing, and grid priorities determine actual adoption. Middle Eastern producers have fuel availability and industrial growth, while African markets often require project-by-project evaluation because infrastructure and financing constraints can be decisive.
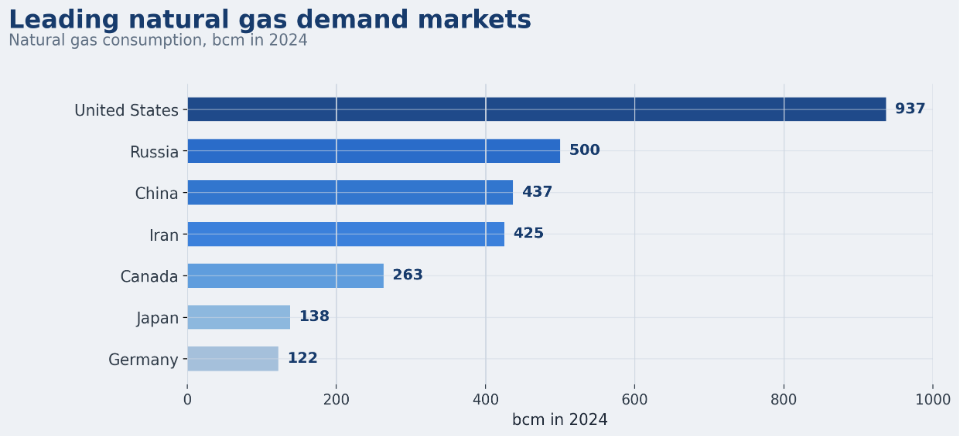
Figure 5. Natural gas consumption highlights large fuel-demand markets, but gas engine opportunity still depends on grid reliability, industrial load, and project economics.
| Country | 2024 gas demand signal | Gas engine opportunity |
|---|---|---|
| United States | 937 bcm | Gas-fired power, data centers, CHP, industrial backup. |
| China | 437.4 bcm | Power-demand growth, industry, LNG/gas infrastructure. |
| Germany | 123 bcm | CHP, industrial efficiency, biogas, flexible generation. |
| Japan | 138 bcm | LNG-linked power, industrial reliability, CHP. |
| India | 63 bcm | Industrial expansion, captive power, backup demand. |
| Saudi Arabia | Market-specific signal | Gas resources, utility power, oil and gas projects. |
| Brazil | 34 bcm | Industrial power, gas infrastructure, backup demand. |
Competitive Landscape and Manufacturer Positioning
The gas engine competitive landscape is shaped by engine efficiency, fuel flexibility, service network, digital monitoring, emissions controls, power output range, and long-term maintenance capability. For large buyers, the service footprint can be as important as the engine rating because availability depends on planned maintenance, spare parts, overhaul discipline, remote monitoring, and local technical support.
- Caterpillar is positioned strongly in gas generator sets, industrial engines, and global service coverage.
- INNIO Jenbacher is closely associated with gas engines for CHP, biogas, landfill gas, and special gas applications.
- Wärtsilä is important in large flexible power plants, island grids, and balancing applications.
- Rolls-Royce mtu competes in distributed power, standby, data centers, and industrial energy systems.
- Cummins participates through gas generator sets, distributed power systems, and service-led customer relationships.
- MAN Energy Solutions and other large-engine manufacturers serve power, marine, and industrial markets where project scale is high.
- Mitsubishi Heavy Industries, Kawasaki, Hyundai, Siemens Energy-related equipment lines, and regional manufacturers create localized competition.
- The most important manufacturer differentiators are efficiency, methane tolerance, special-gas capability, emissions compliance, hydrogen-readiness, service footprint, and lifecycle cost.
| Company / group | Gas engine positioning | Main strength |
|---|---|---|
| Caterpillar | Gas generator sets and industrial engines | Dealer network and broad power range |
| INNIO Jenbacher | CHP, biogas, landfill gas, special gases | Fuel flexibility and CHP reputation |
| Wärtsilä | Flexible power plants and large distributed generation | Grid-balancing and project integration |
| Rolls-Royce mtu | Backup, industrial, data center, and distributed energy | High-reliability power systems |
| Cummins | Generator sets and distributed power | Global service and commercial reach |
| MAN / large-engine suppliers | Large industrial and power applications | High-output project capability |
Emissions, Fuel Switching, and Decarbonization
Emissions policy can support and restrict gas engine demand at the same time. Gas engines can reduce emissions when they replace diesel generators, coal-based captive power, or inefficient boilers. They can also face pressure where governments move directly toward renewables, storage, electrification, and zero-carbon fuels. The result is a market where gas engines must increasingly be justified through efficiency, flexibility, resilience, and fuel pathway options.
- Gas engines usually produce lower carbon dioxide emissions than diesel or coal on a combustion basis, but methane leakage and upstream gas emissions remain important lifecycle concerns.
- CHP improves the emissions case by using one fuel input to produce both electricity and useful heat.
- Biogas and landfill gas engines can support methane capture, waste management, and renewable-energy programs.
- Hydrogen-ready positioning matters because large energy assets may operate for many years and buyers want optionality.
- NOx, formaldehyde, methane slip, and local air-quality rules can affect engine design and permitting.
- European decarbonization rules can limit long-term fossil gas exposure while still supporting efficient CHP or renewable gas applications.
- In emerging markets, gas engines may replace diesel backup power and reduce local particulate pollution when gas supply is available.
- In high-renewable grids, flexible gas engines may run fewer hours but earn value from reliability, reserve, and balancing services.
| Fuel / technology | Emissions position | Market impact |
|---|---|---|
| Natural gas | Lower combustion emissions than coal or diesel, but still fossil-based | Supports transition and reliability use cases |
| Biogas | Can reduce methane and waste emissions when captured properly | Creates circular-economy and renewable power opportunity |
| Landfill gas | Converts landfill methane into electricity and heat | Depends on gas quality and project life |
| Hydrogen blends | Potential lower-carbon pathway | Still limited by fuel supply and technical constraints |
| Battery storage | Zero local emissions during operation | Competes with gas engines for some short-duration applications |
Market Challenges and Barriers
The gas engine market has clear demand drivers, but it also faces barriers that can delay projects or weaken economics. Fuel price volatility can change payback periods quickly. Gas supply constraints can make engines impractical even when the technology is attractive. Policy uncertainty can discourage long-lived capital spending. Batteries and renewables can compete in some applications, while emissions rules can increase treatment and compliance cost.
- Natural gas price volatility is one of the largest operating risks because fuel cost directly affects power generation economics.
- Gas infrastructure limitations can block projects even where electricity reliability problems are severe.
- Methane leakage concerns can weaken the climate case for gas unless renewable gas, methane controls, or high-efficiency CHP are included.
- Battery storage competes strongly for short-duration backup, peak shaving, and renewable smoothing applications.
- Renewables can reduce gas engine run hours in markets where solar, wind, and storage scale rapidly.
- Project permitting can be delayed by emissions limits, noise restrictions, interconnection requirements, and land-use rules.
- Engine maintenance requires skilled service, spare parts, planned overhauls, and disciplined operation.
- Capital cost can be hard to justify if the buyer does not fully value avoided outages, heat recovery, or resilience.
- Fuel quality issues can increase maintenance cost in special-gas applications.
- Policy signals can shift quickly, especially where governments move between energy security, affordability, and decarbonization priorities.
| Risk area | What it affects | How buyers respond |
|---|---|---|
| Fuel price volatility | Operating cost and payback | Use sensitivity analysis and long-term fuel contracts |
| Gas supply limits | Project feasibility | Evaluate LNG, pipeline access, or alternate fuels |
| Emissions rules | Permitting and compliance cost | Select controls, CHP, biogas, or cleaner operating modes |
| Battery competition | Short-duration backup and peak shaving | Compare duration, reliability, and lifecycle cost |
| Maintenance requirements | Availability and lifecycle cost | Use service agreements and remote monitoring |
| Policy uncertainty | Investment confidence | Prioritize flexible, future-ready assets |
Gas Engine Market Opportunity Diagnostic
A polished gas engine market analysis should help teams decide where to look next. The best diagnostic does not ask only whether the global market is growing. It asks where gas engines solve a real energy problem, who owns the problem, and which statistic proves the opportunity is measurable.
| Opportunity area | Core signals to measure | Useful benchmark |
|---|---|---|
| Captive power | Outage frequency, outage cost, industrial load, gas access | Industry uses 32% of U.S. gas consumption |
| CHP | Heat load, electricity price, boiler fuel cost, run hours | Industrial CHP priority score of 5/5 |
| Backup power | Critical load, start reliability, fuel security | Data center backup/firm power score of 4/5 |
| Power generation | Electricity demand, gas generation share, capacity needs | Power segment value of USD 3.33B in 2022 |
| Oil and gas | Gas production, compression needs, remote power | Oilfield and pipeline applications score 4/5 |
| Biogas/landfill gas | Waste gas volume, gas quality, interconnection | Municipal landfill gas score of 3/5 |
| Emerging Asia | Gas demand growth, industrial load, grid reliability | Emerging Asia gas demand growth of 6% |
| Europe | CHP, import dependency, renewable balancing | Europe contributes 41% of forecast growth |
90-Day Gas Engine Market Benchmark Plan
Statistics become useful when they are translated into a planning cycle. A 90-day benchmark gives manufacturers, investors, consultants, and energy teams a structured way to separate broad market hype from practical opportunity. The goal is to move from market-size numbers to a ranked list of segments, countries, customers, and risks.
| Timing | What to do | Output |
|---|---|---|
| Days 1-30 | Capture baseline by region, country, fuel type, power output, application, and source estimate. | A clear map of market size, demand signals, and data confidence. |
| Days 31-60 | Compare demand drivers such as CHP, backup power, industrial growth, gas access, outage exposure, and electricity mix. | A prioritized list of high-fit applications and countries. |
| Days 61-90 | Review policy, emissions, fuel-price risk, competitor position, service coverage, and customer economics. | A practical go-to-market and investment scorecard. |
Metrics Gas Engine Market Leaders Should Track
A mature gas engine market scorecard needs enough detail to identify the opportunity without becoming a vanity dashboard. The following metrics help connect market statistics to commercial decisions.
| Metric | Why it matters |
|---|---|
| Market size | Total commercial opportunity and validates whether the segment is large enough to prioritize. |
| CAGR | Forecast direction and growth speed, but should not be used without regional context. |
| Regional share | Where adoption is strongest and where sales coverage should be concentrated. |
| Country gas consumption | Indicates fuel-market scale and potential engine operating base. |
| Natural gas generation share | Power-sector readiness for gas-fired generation. |
| Industrial gas demand | Supports captive power, CHP, and process heat opportunity. |
| CHP policy and installed base | Indicates where heat recovery economics can be converted into projects. |
| Gas price trend | Determines operating economics and payback sensitivity. |
| Outage cost and reliability | Supports backup power and resilience value. |
| Emissions regulation | Affects permitting, control cost, run hours, and long-term investment confidence. |
| Manufacturer service coverage | Determines availability and long-term customer risk. |
| Battery and renewable competition | Where gas engines must prove duration, reliability, or lifecycle value. |
Gas Engine Market Statistics FAQ
What is the size of the gas engine market?
Recent public estimates generally place the global gas engine market between **USD 4.7 billion and USD 6.0 billion** across 2021-2025 base years. The exact number depends on whether the source includes only stationary gas engines, generator sets, service revenue, special-gas engines, or broader industrial equipment.
What is the expected CAGR of the gas engine market?
Most public forecasts in the workbook fall around **3.7% to 5.6% CAGR**. That makes the market moderate-growth overall, with stronger opportunity in selected countries and applications such as CHP, distributed generation, data centers, and flexible power.
Which region has the strongest gas engine opportunity?
Asia-Pacific has strong demand-growth signals because emerging and developing Asia recorded about **6%** gas demand growth in 2024. Europe is also important because Technavio attributes about **41%** of forecast market growth contribution to Europe, but the European opportunity is more selective and policy-sensitive.
What are gas engines mainly used for?
The main applications include power generation, cogeneration/CHP, captive industrial power, commercial backup, oilfield power, pipeline compression, data center firm power, landfill gas, and biogas projects.
Why are gas engines used in CHP systems?
Gas engines are used in CHP because they produce electricity and recover useful heat from the same fuel input. This can improve total energy efficiency when the site has consistent heat demand and enough operating hours.
Are gas engines cleaner than diesel engines?
Gas engines generally produce lower local particulates and lower carbon intensity than diesel engines on a combustion basis, but methane leakage, NOx controls, fuel quality, and operating mode matter. The cleanest gas-engine positioning is usually CHP, biogas, landfill gas, or diesel replacement.
How do gas engines support renewable energy?
Gas engines can provide flexible dispatchable capacity when solar or wind output changes. They can also support microgrids and island grids where a mix of renewables, storage, and firm generation is needed.
Which industries use gas engines most?
Important industries include power generation, oil and gas, chemicals, food and beverage, mining, pulp and paper, data centers, hospitals, universities, district energy, and wastewater treatment.
Which countries matter most for gas engine demand?
Important country signals include the United States, China, Germany, India, Japan, South Korea, Canada, Mexico, Italy, the United Kingdom, Brazil, Argentina, Saudi Arabia, Qatar, the UAE, Egypt, and Iran. Actual opportunity depends on gas access, electricity demand, policy, and industrial load.
What are the biggest barriers for the gas engine market?
The biggest barriers are fuel price volatility, gas-supply limits, emissions rules, methane concerns, competition from batteries and renewables, project permitting, skilled maintenance requirements, and policy uncertainty.
Final Takeaway
Gas engine market statistics point to one practical conclusion: gas engines are becoming a flexible power infrastructure category, not simply a traditional generator market. The strongest opportunities appear where gas engines solve a defined operational problem: grid unreliability, high outage costs, industrial heat demand, fuel switching, oil and gas field power, biogas utilization, or flexible generation beside renewables.
The market is not growing at the same speed as solar, wind, or battery storage, but it remains strategically important because it serves dispatchable and site-specific power needs. Forecasts commonly show a market moving from roughly the USD 5 billion range toward USD 6-9 billion across different forecast windows. That range is meaningful because many gas engine purchases are tied to long-lived assets, service contracts, fuel infrastructure, and industrial operations where downtime is expensive.
For manufacturers, the next step is to rank countries and segments by fit rather than only by size. For buyers, the next step is to compare gas engines against diesel, batteries, turbines, grid upgrades, and hybrid systems using a full scorecard: fuel cost, reliability, heat recovery, emissions, maintenance, service coverage, and lifecycle economics. The best projects will be those where gas engines deliver fast, reliable, measurable power value while fitting into a cleaner and more flexible energy system.


