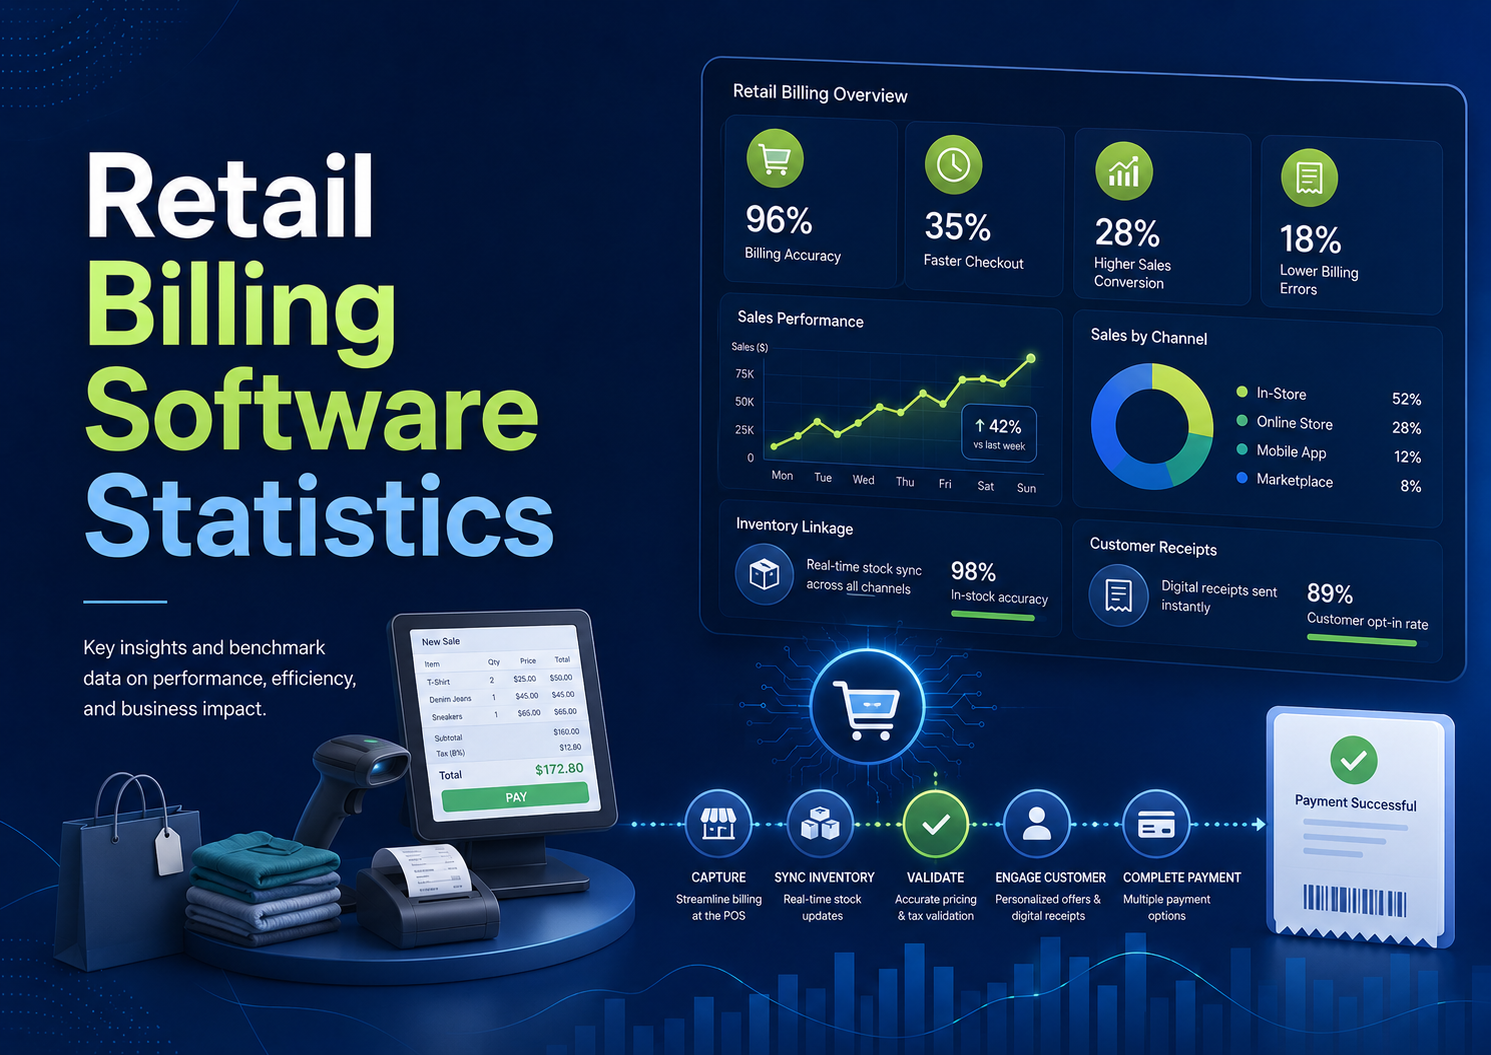
Retail billing software has moved far beyond a cash register replacement. In modern retail, the billing system connects payments, receipts, inventory, customer records, returns, tax details, discounts, online orders, in-store pickup, and fraud controls. A weak billing stack does not only slow the counter; it can distort stock accuracy, delay refunds, create incomplete proof-of-purchase records, and leave managers without reliable sales visibility.
The latest statistics highlight why billing software now requires its own operational performance scorecard. The global POS software market is valued at approximately $17.13 billion in 2025 and is expected to grow to $38.82 billion by 2033, while the overall POS market could reach $138.92 billion by 2034. Meanwhile, U.S. retail returns were projected to hit $890 billion in 2024, and digital payments climbed to $18.7 trillion worldwide. To manage this rapidly evolving environment, retailers are increasingly relying on analytics, mobile POS systems, digital receipts, AI-powered tools, and organized documentation such as a receipt template to improve transaction accuracy, streamline store operations, and strengthen customer experience.
Executive Retail Billing Software Benchmarks
The headline numbers show the scale of the category and the problems retail billing systems are expected to solve. They also explain why billing software should be judged as a connected retail operating layer rather than a standalone payment screen.
The numbers that define the retail billing software market
• The global point-of-sale software market was estimated at $17.13 billion in 2025.
• Grand View Research projects POS software to reach $38.82 billion by 2033 at a 10.8% CAGR.
• The broader global POS market was valued at $38.56 billion in 2025 and is projected to reach $138.92 billion by 2034.
• The global POS terminal market reached $123.15 billion in 2025 and is forecast to reach $226.87 billion by 2033.
• The U.S. POS market is projected to reach $13.49 billion by 2030, implying a 13.3% CAGR from 2023 to 2030.
• The cloud POS market is estimated around $6.3 billion to $6.9 billion in the mid-2020s, with forecasts reaching $30.0 billion to $38.6 billion by 2035.
• Future Market Insights estimates the mPOS devices market at $37.2 billion in 2025 and projects $248.3 billion by 2035.
• Deloitte reports the Top 250 global retailers generated $6.03 trillion in aggregate retail revenue in FY2023.
• Worldpay reports digital payment spending across ecommerce and in-person commerce rose from $1.7 trillion in 2014 to $18.7 trillion in 2024.
• Worldpay projects digital payment value will exceed $33.5 trillion by 2030.
• NRF and Happy Returns projected total U.S. retail returns at $890 billion in 2024.
• Appriss Retail estimated $103 billion in 2024 return and claims fraud and abuse.
What this shows: retail billing software now sits between revenue capture and loss prevention. The same system that records a sale also needs to preserve tender details, receipt evidence, discount logic, tax treatment, refund history, and return behavior. That is why the biggest numbers in this report are not only POS market forecasts; they also include trillions in retail sales, billions in returns, and fraud exposure large enough to change margin planning.
Editorial readout The most important signal is not only that the POS market is growing. Retail billing software is being pulled into larger business problems: mobile checkout, omnichannel orders, inventory accuracy, returns abuse, digital receipts, and regional payment behavior. A modern billing system has to capture a transaction cleanly, connect it to a customer and product record, support the shopper’s preferred payment method, and leave enough data for managers to act after the sale.
Market Size and Retail Technology Growth
Market-size statistics help separate retail billing from narrow register software. The category now overlaps with POS terminals, cloud POS platforms, mobile POS devices, payment infrastructure, analytics tools, and retail automation. That overlap matters because retailers rarely buy billing software only to ring up sales; they buy it to connect sales activity with stock, staffing, ecommerce, returns, and customer data.
POS, cloud POS, and billing market scale
• The point-of-sale software market is projected to rise from $17.13 billion in 2025 to $38.82 billion by 2033.
• The broader global POS market is projected to grow from $44.6 billion in 2026 to $138.92 billion by 2034.
• The global POS terminal market is forecast to grow at a 7.9% CAGR from 2026 to 2033.
• The U.S. point-of-sale market was valued at $4.97 billion in 2022 and projected to grow from $5.61 billion in 2023.
• Asia-Pacific held a reported 35.2% share of the global POS market in 2025.
• The cloud POS market is projected to reach $30.0 billion by 2035 in one forecast and $38.6 billion by 2035 in another.
• Cloud POS forecasts imply annual growth between roughly 15.25% and 18.8%, depending on the market definition.
• The retail analytics market was valued at $10.20 billion in 2025, showing that billing data is increasingly tied to decision intelligence.
• Retail automation was valued at $27.65 billion in 2025 and projected to reach $77.36 billion by 2034.
Inventory and analytics are where retail billing software starts to affect decisions beyond checkout. A sale should not be only a revenue entry; it should update stock availability, margin reporting, replenishment signals, customer purchase history, and return exposure. The value of analytics depends on whether the billing layer captures clean, structured data at the moment the transaction happens.
The market-size numbers point to a practical buying pattern: retailers are not replacing registers just to modernize the checkout screen. They are buying connected systems because sales, payments, inventory, loyalty, returns, and reporting now need to move together. A billing platform that cannot reconcile store transactions with ecommerce orders or return data quickly becomes a reporting bottleneck rather than an operating system.
| Market layer | Why it matters for billing software | Benchmark signal |
|---|---|---|
| POS software | Controls transaction entry, discounts, tenders, taxes, receipts, and sales records. | $38.82B projected by 2033 |
| POS terminals | Shows hardware remains relevant even as software shifts to cloud and mobile. | $226.87B projected by 2033 |
| Cloud POS | Supports multi-store access, real-time updates, remote reporting, and ecommerce integration. | Forecasts up to $38.6B by 2035 |
| Mobile POS | Moves billing to aisles, pop-ups, events, curbside, and assisted selling. | $248.3B projected by 2035 |
| Retail analytics | Turns billing records into margin, inventory, and customer behavior insights. | $10.20B market in 2025 |
How to read the market numbers Market forecasts vary because some reports count only software revenue while others include hardware, terminals, services, or transaction infrastructure. The practical takeaway is directional: billing software is expanding because retailers need cleaner transaction data and more flexible checkout architecture. The strongest business case appears when POS, inventory, payments, receipts, and reporting move together instead of remaining separate systems.
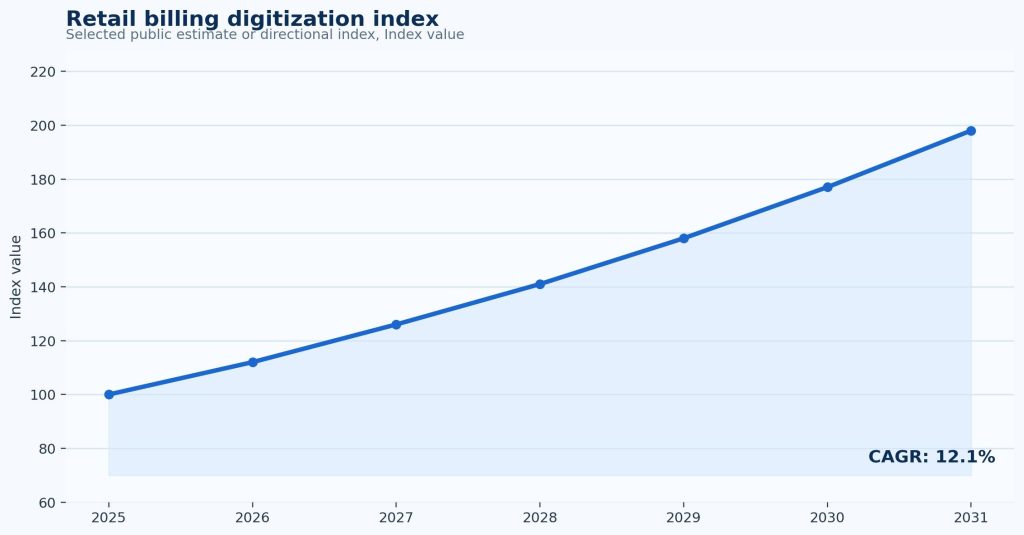
Figure 1. Retail billing software growth should be read alongside POS, cloud POS, mobile POS, and retail automation markets because the category now spans more than basic checkout entry.
Retail Sales, Ecommerce, and Omnichannel Billing Scale
Retail billing software becomes more complex when sales are split across physical stores, ecommerce sites, marketplaces, mobile apps, social channels, pickup flows, and return desks. The sales channel may change, but the retailer still needs one reliable record of what was sold, paid, fulfilled, returned, exchanged, or refunded.
Retail and ecommerce scale benchmarks
• U.S. retail sales reached $7.041 trillion in 2022, up 8.0% from 2021.
• NRF forecasts U.S. retail sales will reach $5.6 trillion in 2026, with projected growth of 4.4%.
• U.S. ecommerce accounted for 16.4% of total retail sales in 2025 and 16.9% in Q1 2026.
• U.S. retail ecommerce sales totaled $302.3 billion in Q1 2026 on a not-adjusted basis.
• Q1 2026 U.S. ecommerce increased 9.8% year over year on an adjusted basis, compared with 3.9% total retail growth.
• Digital Commerce 360 calculates U.S. ecommerce penetration at 23.1% of total sales in 2025 after category exclusions.
• U.S. ecommerce sales exceeded $350 billion in Q4 2025 for the first time in a single quarter.
• European B2C ecommerce turnover reached €842 billion in 2024, up from €784 billion in 2023.
• Western Europe accounted for 58% of total European ecommerce turnover in 2024.
• Reuters projects Latin American ecommerce at $215.31 billion in 2026.
For billing teams, these sales and ecommerce figures matter because every additional channel creates another reconciliation path. A retailer that sells through stores, marketplaces, web checkout, pickup orders, and mobile wallets needs billing records that can identify where the order started, how it was paid, whether tax and discounts were applied correctly, and where the return should be recognized.
Omnichannel behavior that affects billing records
• Digital Commerce 360 cites Appriss estimates that 71.55% of 2024 U.S. retail sales came from physical stores.
• The same estimate places online retail at 28.45% of 2024 U.S. retail sales.
• Lightspeed research says 45% of shoppers first research products online before buying in-store.
• Lightspeed also reports 17% of shoppers research in-store and then buy online.
• Eurostat reports 17.99% of EU enterprises conducted e-sales using only websites or apps in 2024.
• Eurostat reports 2.9% of EU enterprises used only EDI-type sales, while 2.7% used both websites/apps and EDI-type sales.
• Reuters says 84% of Latin American ecommerce purchases are made via smartphones.
• Reuters says quick commerce represented more than two-thirds of India’s e-grocery orders in 2024.
• India’s quick-commerce market reached roughly $6 billion to $7 billion by 2024 and is expected to grow about 40% annually through 2030.
The omnichannel data also explains why billing software is becoming more time-sensitive. Same-day delivery, pickup, quick commerce, and marketplace selling shorten the gap between order creation, payment capture, fulfillment, and refund liability. Retailers that wait until month end to clean up transaction records lose the ability to see margin leakage while it is still correctable.
Billing implication Omnichannel growth makes a simple sales total less useful. A retailer needs to know whether a transaction began online, was paid in-store, fulfilled from a local branch, returned through a different channel, or attached to a digital receipt. Retail billing software becomes more valuable when it preserves that chain of evidence without forcing staff to reconcile ecommerce, POS, returns, and inventory systems manually.
POS, Cloud POS, and Mobile Billing Adoption
POS modernization is not only a software trend. It changes where billing happens. Retailers increasingly need billing to work at fixed counters, on tablets, through handheld devices, at pop-up locations, inside warehouses, and across ecommerce pickup or return workflows.
Cloud and mobile POS signals
• The cloud POS market is estimated at $6.6 billion to $6.9 billion in 2025 across several forecasts.
• Future Market Insights projects cloud POS will reach $35.0 billion by 2035, implying an 18.2% CAGR.
• Research Nester projects cloud POS will reach $38.6 billion by 2035 at an 18.8% CAGR.
• Future Market Insights estimates the mPOS devices market at $37.2 billion in 2025.
• The mPOS devices market is projected to reach $248.3 billion by 2035, implying a 20.9% CAGR.
• Another mPOS estimate values the market at $55.96 billion in 2026 and projects $128.43 billion by 2033.
• Lightspeed says its platform powers businesses in 100+ countries.
• Lightspeed processed $91.3 billion in gross transaction value through its platform in fiscal 2025.
In-store payment behavior that drives POS requirements
• UK Finance says 48.8 billion payments were made in the UK in 2024.
• Debit cards accounted for 26.1 billion UK payments in 2024.
• UK consumers made 18.9 billion contactless card payments in 2024.
• Almost 4 out of 10 UK payments were contactless in 2024.
• Around 62% of UK debit card payments and 55% of credit and charge card payments were contactless in 2024.
• UK mobile wallet use rose from 42% in 2023 to 57% in 2024.
• Half of UK adults regularly used mobile contactless payments in 2024.
• Cash fell to 9% of UK payments in 2024, down from 12% in 2023 and 23% in 2019.
These payment shifts change the definition of a complete billing record. A modern receipt has to show the sale, but it also has to support card settlement, wallet token references, contactless tenders, split payments, refunds to original method, and customer service lookups. When payment mix changes faster than back-office reporting, finance teams end up with transaction totals that are technically correct but hard to explain.
Operational readout Cloud POS and mPOS adoption point to a basic operating truth: billing no longer belongs only to the checkout counter. Store associates may need to check inventory, take payment, email a receipt, start a return, or apply a loyalty discount from the sales floor. That makes uptime, device management, role permissions, offline modes, and payment-terminal integration central to billing software quality.
Payment Methods, Checkout Reliability, and Billing Security
Retail billing software sits directly between customer preference and payment risk. A system that cannot support the payment method a shopper wants may lose the sale, while a system that accepts payments without adequate controls may increase fraud, disputes, and reconciliation work.
Digital payment and preferred-method benchmarks
• Worldpay reports digital payment methods grew from 34% of ecommerce value in 2014 to 66% in 2024.
• Worldpay reports POS digital payments rose from 3% to 38% over the same 2014-2024 period.
• Airwallex reports digital payments are projected to account for 79% of ecommerce payments by 2030.
• Airwallex reports POS digital payments are projected to reach 53% by 2030.
• PCMI cites wallet spending across consumer and business payments at roughly $16 trillion in 2024.
• PCMI projects digital wallet spending could rise to about $28 trillion by 2030.
• Adyen reports 54% of shoppers will leave a store or abandon online checkout if they cannot use their preferred payment method.
• Baymard reports 10% of U.S. shoppers abandon because there were not enough payment methods.
• Baymard reports 8% abandon because their card was declined and 15% abandon because a site had errors or crashed.
Country-level payment rails that billing systems must respect
• PIB says UPI accounts for 49% of global real-time payment transactions.
• Reuters reports UPI handled 83% of India’s digital payments in 2024.
• NPCI reports UPI processed 20.70092 billion transactions in October 2025.
• NPCI reports UPI transaction value of ₹27,27,790.68 crore in October 2025.
• Pix broke a daily record on April 6, 2024 with 250.5 million transactions.
• Reuters reports Black Friday Pix transaction value jumped 120.7% year over year in Brazil.
• Reuters reports Pix Automatico is expected to draw $30 billion in ecommerce payments within two years.
Fraud and payment-security benchmarks
• UK card fraud amounted to £556.3 million in 2022, up 6% from 2021.
• Card-not-present fraud made up 81% of UK card fraud in 2022.
• UK card-not-present fraud included 2.21 million cases and £396 million in losses in 2022.
• The UK fraud-to-turnover ratio decreased to 6% from a high of 8.4% in 2019.
• EBA/ECB reported payment fraud of EUR 1.3 billion for its card, credit-transfer, and e-money scope in 2024.
• EBA/ECB reported a fraud rate of 0.033% in that 2024 scope.
• Reuters reported ECB payment fraud in the EEA rose to €4.2 billion in 2024, up from €3.5 billion in 2023.
• The Visa Acceptance fraud report says 60% of merchants still employ tokenization.
The fraud benchmarks show why billing data quality has become part of risk control. When transaction records are incomplete, retailers struggle to identify whether a refund is legitimate, whether a return is tied to the original purchase, or whether a card-present transaction differs from a wallet or ecommerce transaction. Stronger payment metadata does not eliminate fraud, but it gives teams better evidence before losses become routine.
| Billing risk | Metric to watch | Why it matters |
|---|---|---|
| Missing method | Preferred-method abandonment and tender mix by channel | Lost sales can occur before the payment attempt. |
| Declined payment | Decline rate, retry success, issuer response, and alternate-method completion | A failed payment can erase a transaction after shopper intent is clear. |
| Card-not-present exposure | Fraud rate, dispute rate, refund abuse, and authentication friction | Online billing records must support risk review and proof of purchase. |
| Regional payment mismatch | Payment-method conversion by country | Brazil, India, the UK, and Europe do not behave like one generic market. |
Payment readout Payment-method coverage is now part of retail conversion strategy. Billing software should not only process cards; it should record tender type, support wallet and real-time payment rails where relevant, preserve refund trails, and make failed-payment reasons visible to managers. The best systems help teams distinguish a shopper who changed their mind from a shopper who wanted to pay but could not complete the transaction.
Figure 2. Retail billing software value increases when payment acceptance, tender mix, fraud control, and channel-level checkout reliability are measured together.
Inventory Visibility, Analytics, and AI Automation
Billing data is one of the earliest signals of product movement, but it becomes more valuable when connected to inventory and analytics. A sale should reduce stock, inform replenishment, update margin reporting, support customer segmentation, and help stores understand which products are moving by channel and location.
Analytics and inventory benchmarks
• Square reports 70% of retail leaders rely on data analytics to guide purchasing decisions.
• Lightspeed reports retailers using Lightspeed Insights achieved 25.4% higher Gross Margin Return on Investment.
• Lightspeed Analytics synchronizes with Retail POS every 2-3 hours, showing that data latency can matter for fast-moving stock decisions.
• Starbucks said it was rolling out AI-driven inventory counting across 11,000+ company-owned North America stores.
• Starbucks said the AI inventory system allowed inventory to be counted eight times more frequently.
• TechRadar reported 70% of retailers have piloted or partially implemented agentic AI systems.
• Only 8% of retailers in the same AI report had fully integrated AI, and only 5% described their systems as mature.
• The same retail AI report says 88% of retailers recognize AI’s strategic importance.
• Retailers in the AI report planned to apply AI to supply-chain optimization at 32% and inventory management at 30%.
Analytics readout Billing software is only as useful as the data it produces after the sale. A basic system can tell a manager how much revenue was collected. A stronger system can connect sales velocity with stock, returns, margin, staffing, and store performance.
Digital Receipts and Proof-of-Purchase Records
Receipts are often treated as a small afterthought, but they are central to customer service, returns, warranty proof, tax records, and fraud control. Digital receipts also create a cleaner customer record when they are connected to the original transaction, payment method, items sold, discounts, and return eligibility.
Digital receipt market and adoption signals
• Only 34% of merchants were offering digital receipts in Fiskaly’s 2024 snapshot.
• The broader global digital receipts market was estimated at $2.1 billion in 2023.
• The global digital receipts market is projected to reach $5.1 billion by 2033.
• The digital receipts market is forecast to grow at an 11.5% CAGR from 2024 to 2033.
• North America held more than 32.5% of the digital receipts in retail market in 2024.
• Refive reports digital receipts can achieve open rates as high as 75%.
• Refive compares digital-receipt open rates with typical email marketing open rates of 20-25%.
• Skip the Slip estimated 93% of paper receipts are coated with BPA or BPS.
• A thermal-paper study found non-bisphenol receipt frequency increased from 5% in 2017 to 16% in 2022.
• Minnesota PCA says individual thermal receipts can contain BPA at 250 to 1,000 times the amount in a can of food.
Digital receipts should be evaluated as more than an environmental upgrade. They can improve proof-of-purchase access, reduce paper handling, support returns without physical slips, and connect customer service teams to the original transaction. The strongest use case appears when the receipt is tied cleanly to loyalty, payment method, tax details, and return eligibility rather than stored as a disconnected message.
Receipt readout The digital receipt opportunity is not only environmental. A receipt is the evidence layer for the transaction. When receipts stay linked to line items, tender type, return rules, loyalty identifiers, and refunds, they reduce disputes and improve customer support. The weak adoption signal also matters: many retailers still have room to modernize proof-of-purchase records before they can use receipt data as a reliable customer and fraud-control asset.
Returns, Shrink, Refunds, and Fraud Controls
Returns and shrink are where incomplete billing records become expensive. A retailer that cannot connect the receipt, payment method, item, store, employee, customer, and refund trail will struggle to distinguish a legitimate return from abuse. That is why returns statistics belong in a retail billing software report.
Returns and fraud benchmarks
• NRF and Happy Returns projected total U.S. retail returns at $890 billion in 2024.
• NRF projected nearly $850 billion in merchandise returns in 2025.
• Retailers estimated that 16.9% of annual sales would be returned in 2024.
• NRF projected a 15.8% return rate for 2025.
• Appriss Retail reports an overall 2024 return rate of 13.21%.
• Digital Commerce 360 cites Appriss data estimating the 2024 in-store return rate at 8.72%.
• Digital Commerce 360 cites Appriss data estimating the 2024 online return rate at 24.52%.
• Digital Commerce 360 cites Appriss estimates of $323.727 billion in in-store returns and $363.16 billion in online returns in 2024.
• Online returns including BORIS and BORO accounted for more than 52% of U.S. returns dollars in 2024.
Abuse patterns and retail controls
• Return fraud and abusive behavior cost retailers $103 billion in 2024.
• Fraud and abuse affected 15.14% of total U.S. retail returns in 2024.
• NRF reports 9% of all returns are fraudulent in the 2025 retail returns landscape.
• Happy Returns reports 93% of retailers cite fraud as a top issue.
• NRF says 93% of retailers see retail fraud and exploitative behavior as a significant business issue.
• NRF says 85% of retailers use AI to detect or prevent return fraud.
• NRF reports 71% of retailers tracking incidents saw increases in overstated quantity of returns.
• NRF reports 65% saw increases in empty-box or “box of rocks” return fraud.
• NRF reports 64% saw increases in decoy returns such as counterfeit items.
• Happy Returns says 47% of shoppers returned items with tags removed in the last year, while 32% returned a worn item.
Returns data makes the billing system part of margin protection. A weak return process can approve refunds without understanding the original tender, discount, item condition, purchase channel, or abuse pattern. A stronger billing record lets retailers separate ordinary customer service from recurring loss behavior and gives finance teams a clearer picture of which products, channels, and policies are producing avoidable cost.
| Return-control question | Useful billing-system evidence |
|---|---|
| Was the item actually purchased? | Original receipt, SKU, tender type, date, store, ecommerce order ID |
| Was the refund routed correctly? | Original payment method, refund method, refund status, approval trail |
| Is the pattern unusual? | Customer return frequency, item category, employee override, store location |
| Is the item condition valid? | Return reason, tags, serialized item, image or inspection note |
| Is online-to-store return volume creating strain? | BORIS/BORO volume, queue time, return-processing backlog |
Returns readout Returns are not only a customer-service issue. They are a billing-data issue. The best return systems do not simply issue money back; they match refunds to evidence. That evidence helps retailers protect legitimate shoppers, control abusive behavior, reduce manual investigation, and identify which products, channels, or stores are producing the highest return burden.
Figure 3. Returns, fraud, and receipt quality create a second layer of billing-system value after the original transaction is complete.
Self-Checkout and Assisted Checkout
Self-checkout sits at the intersection of labor efficiency, customer speed, shrink control, and assisted-service design. The market is growing, but recent store-level rollbacks show that automation without strong controls can create new costs.
Self-checkout market and risk signals
• The Europe self-checkout systems market was calculated at $1.62 billion in 2024.
• Europe self-checkout systems were projected to grow from $1.85 billion in 2025.
• The Europe self-checkout market is forecast to reach $5.36 billion by 2033.
• Europe self-checkout systems are forecast to grow at a 14.19% CAGR during the forecast period.
• Future Market Insights forecasts the global self-checkout systems market at $5.8 billion in 2026.
• The global self-checkout systems market is forecast to reach $11.1 billion by 2036.
• The self-checkout systems market is forecast to grow at a 13.7% CAGR from 2026 to 2036.
• Dollar General removed self-checkout from 12,000 stores after shrink and theft concerns.
• That rollback affected a chain with roughly 20,000 stores.
Self-checkout is a useful example of why speed alone is not enough. The same checkout design that reduces cashier labor can increase exception handling if item scanning, payment confirmation, age verification, receipt matching, or loss controls are weak. Retailers need to measure self-checkout as a combined labor, customer experience, fraud, and shrink decision rather than a simple automation project.
Assisted-checkout readout Self-checkout data should be interpreted carefully. Growth forecasts show demand for faster and lower-labor checkout models, but shrink and customer-friction risks can erase some of the benefit. Retailers need billing software that supports assisted intervention, item verification, receipt accuracy, exception alerts, and clear audit trails, not simply unattended scanning.
Regional and Country Billing Software Statistics
Regional statistics are especially important for retail billing software because payment rails, ecommerce penetration, cash usage, wallet adoption, tax expectations, and return behavior vary sharply by country. A billing setup that works for a U.S. specialty retailer may not fit India, Brazil, the UK, or Western Europe without local tender and reporting support.
North America and the United States
• The U.S. POS market is projected to reach $13.49 billion by 2030.
• U.S. ecommerce accounted for 16.9% of total retail sales in Q1 2026.
• U.S. retail ecommerce totaled $302.3 billion in Q1 2026 on a not-adjusted basis.
• Digital Commerce 360 says 2025 was the fourth time U.S. ecommerce surpassed $1 trillion.
• Capital One Shopping estimates the U.S. 2025 ecommerce market at $1.193 trillion.
• North America held more than 32.5% of the digital receipts in retail market in 2024.
Europe and the United Kingdom
• European B2C ecommerce turnover reached €842 billion in 2024, up from €784 billion in 2023.
• Western Europe closed 2024 with €490 billion in ecommerce turnover.
• Western Europe held 58% of total European ecommerce turnover in 2024.
• Cards made up 64% of all UK transactions in 2024.
• UK mobile wallet use rose to 57% of adults in 2024.
• UK Faster Payments rose by about 14% to 5.6 billion transactions in 2024.
• UK Finance says 25% of UK adults used BNPL in 2024, up from 14% the year before.
• Fashion represented 46% of UK BNPL transactions in 2024.
Asia-Pacific and India
• Asia-Pacific commanded a reported 54.3% global revenue share in ecommerce in 2025.
• Capital One Shopping estimates China’s 2025 ecommerce market at $2.535 trillion.
• Capital One Shopping says China and the U.S. are the only countries with ecommerce markets above $1 trillion in 2025.
• Capital One Shopping estimates South Korea’s 2025 ecommerce market at $208 billion and Japan’s at $191 billion.
• IBEF projects India’s ecommerce market to grow 12.5% in 2025 to about $211.6 billion.
• Bain estimates India’s e-retail market at approximately $60 billion GMV.
• PCMI projects India ecommerce volume of $274 billion in 2027.
• PCMI says ecommerce represented 8% of India’s retail market in 2024 and projects 14% by 2028.
• PCMI estimates 10% of India ecommerce sales are cross-border.
• PCMI notes only 64% of India’s population is banked, which affects payment-method planning.
Latin America and Brazil
• Reuters projects Latin American ecommerce will reach $215.31 billion in 2026.
• Reuters says Latin American ecommerce is growing 1.5 times faster than the global average.
• Argentina, Brazil, and Mexico account for nearly 85% of regional ecommerce sales.
• Shopify reports Argentina, Brazil, and Mexico account for 84.5% of Latin American retail ecommerce sales.
• Reuters reports 84% of Latin American ecommerce purchases are made via smartphones.
• Brazil’s Pix recorded 250.5 million transactions in a single day in April 2024.
Country-level payment rails are especially important because a billing system that works in one market may feel incomplete in another. Pix in Brazil, UPI in India, mobile wallets in parts of Asia, and contactless cards in the UK are not minor tender choices; they shape how quickly money settles, how refunds are handled, what evidence the receipt must preserve, and which payment failures customers will tolerate.
• Black Friday Pix transaction value jumped 120.7% year over year in Brazil.
The regional data should guide product setup, not just market commentary. In North America, billing systems often need stronger card, wallet, returns, and fraud workflows. In Europe, local payment preferences and regulation-sensitive records matter. In Asia-Pacific, high mobile-payment and quick-commerce activity puts pressure on real-time inventory and receipt logic. In Latin America, instant-payment rails and installment behavior make localized payment support central to checkout completion.
How the Benchmarks Change by Retail Model
Retail billing software requirements change sharply by retail model. A single-store boutique, a supermarket chain, a marketplace-heavy ecommerce seller, and a cross-border brand may all use POS or billing software, but they are solving different problems. The most useful statistics in this report should therefore be read as diagnostic signals, not as one universal checklist.
Single-store and local retailers
For a small local retailer, the priority is usually reliable payment acceptance, simple receipts, clean tax records, and an easy refund trail. Market-size numbers matter less than whether the system prevents daily reconciliation problems. If card, wallet, cash, and refund totals do not match at close, the software is creating back-office work even when the front counter feels fast.
Omnichannel and multi-location retailers
For multi-location and omnichannel retailers, the billing layer has to connect store sales, ecommerce orders, inventory changes, loyalty profiles, and returns across locations. The most important benchmarks are not only checkout speed or POS uptime; they are stock accuracy, channel-level margin, tender mix, refund routing, and whether managers can compare performance without manually rebuilding data from separate systems.
High-return and high-shrink categories
Retailers in apparel, electronics, beauty, and other return-heavy categories need a stronger evidence layer. Receipt quality, item condition, return window rules, serial numbers, loyalty records, and payment method details all become part of the billing record. In these categories, a good billing system should reduce friction for honest customers while making repeated refund abuse easier to identify.
International and marketplace sellers
For retailers selling across countries or marketplaces, localization becomes a billing requirement. The system must handle local payment rails, currency, tax treatment, refund expectations, and receipt formats without forcing staff to reconcile every market manually.
Regional readout Country-level payment behavior changes what “retail billing software” must support. U.S. retailers may focus on card, wallet, returns, and tax reconciliation. UK retailers need strong contactless, mobile wallet, and faster-payment support. Brazil and India require serious attention to real-time payment rails. European retailers must handle cross-border ecommerce, card-not-present fraud, and regional receipt rules. A global billing system has to be local enough to avoid forcing every market into the same tender and reporting model.
Metrics Retail Leaders Should Track
A retail billing dashboard should not stop at total sales. The most useful metrics connect checkout activity with payment success, product movement, customer service, returns, and risk.
A strong scorecard should be reviewed by more than the store operations team. Finance needs settlement accuracy and refund timing, ecommerce teams need channel conversion and payment success, inventory teams need stock movement, and loss-prevention teams need return and shrink patterns. When all four groups use the same transaction data, billing software becomes a management layer rather than a receipt-printing tool.
| Metric group | Specific metrics to track | Decision it supports |
|---|---|---|
| Sales capture | Gross sales, net sales, discounts, tender mix, tax, average ticket | Revenue quality and pricing discipline |
| Payment performance | Authorization rate, decline rate, retry success, wallet/card/local method mix | Conversion and payment reliability |
| Channel performance | In-store, ecommerce, mobile, marketplace, pickup, and return-channel sales | Omnichannel planning |
| Inventory linkage | Sell-through, stockout rate, returns by SKU, shrink adjustments | Purchasing and replenishment |
| Receipt quality | Digital receipt adoption, open rate, missing receipt lookup, receipt-linked returns | Customer support and proof of purchase |
| Returns control | Return rate, refund value, fraud/abuse flags, BORIS/BORO volume | Loss prevention and customer service |
| Store execution | Transaction time, override rate, manager approvals, self-checkout exceptions | Labor and training |
| Regional fit | Tender mix and payment failures by country or store cluster | Localization and expansion |
Scorecard readout The value of billing software is easiest to see when metrics are connected. A high return rate may be a product-quality issue, an ecommerce-description issue, or a fraud-control issue. A payment decline spike may be a processor problem, a local-method gap, or a device integration problem. A clean scorecard helps retailers identify where the billing system is creating evidence and where it is still hiding the root cause.
How to Diagnose Retail Billing Software Gaps
A practical diagnostic should separate front-counter problems from back-office problems. The same billing system can look acceptable during a sale but fail later when managers try to reconcile inventory, investigate a return, or compare performance across stores.
This diagnostic approach also prevents overbuilding. A retailer with high refund fraud needs different controls than a retailer with poor mobile payment acceptance or weak inventory synchronization. The best improvement plan starts with a baseline, isolates the largest leakage point, and then tests whether the billing system can reduce that problem without making checkout slower for legitimate customers.
| Problem pattern | Useful diagnostic question | Relevant benchmark context |
|---|---|---|
| Slow checkout | Are payment terminals, receipt options, and item lookup creating avoidable delay? | Digital payments reached $18.7T globally in 2024. |
| Weak tender coverage | Are local wallets, real-time payment rails, and preferred methods available by market? | 54% of shoppers may leave if preferred payment is unavailable. |
| Incomplete receipts | Can staff find the original transaction, item, payment, and refund trail? | Only 34% of merchants offered digital receipts in one snapshot. |
| Return abuse | Can refunds be tied to proof of purchase, customer pattern, item condition, and original tender? | Return abuse cost $103B in 2024. |
| Inventory mismatch | Does every sale, exchange, and refund update stock accurately? | Analytics users saw 25.4% higher GMROI in one Lightspeed benchmark. |
| Regional mismatch | Does the system support market-specific payment and receipt expectations? | UPI handled 83% of India’s digital payments in 2024. |
Retailers do not need every possible POS feature at once. They need the billing system to solve the points where money, products, and customer records currently break apart.
FAQ
What is the size of the retail billing software market?
Retail billing software overlaps with POS software, POS terminals, cloud POS, mobile POS, and retail automation. The global POS software market was estimated at $17.13 billion in 2025 and is projected to reach $38.82 billion by 2033, while the broader POS market is forecast to reach $138.92 billion by 2034.
Why is cloud POS growing in retail?
Cloud POS supports multi-location reporting, remote updates, ecommerce integration, mobile checkout, and centralized customer or inventory records. Forecasts place the cloud POS market around $6.3 billion to $6.9 billion in the mid-2020s, with projections as high as $38.6 billion by 2035.
How do digital payments affect billing software?
Digital payments change both checkout and back-office reconciliation. Worldpay reports digital payment value across ecommerce and in-person commerce rose from $1.7 trillion in 2014 to $18.7 trillion in 2024, and is projected to exceed $33.5 trillion by 2030. Billing systems must record tender type, authorization status, refunds, disputes, and local payment rails accurately.
Why should returns be included in retail billing software statistics?
Returns are tied directly to receipt quality, refund routing, proof of purchase, item condition, fraud controls, and customer service. U.S. retail returns were projected at $890 billion in 2024, while return and claims fraud and abuse were estimated at $103 billion.
What metrics should retailers track in billing software?
The most useful metrics include net sales, tender mix, payment authorization rate, decline rate, checkout time, digital receipt adoption, return rate, refund value, inventory adjustments, manager overrides, self-checkout exceptions, and payment-method performance by region.
How should regional stats influence retail billing software decisions?
Regional payment habits can change the required billing stack. The U.S. market may focus on cards, wallets, returns, and tax records; the UK needs contactless and wallet depth; India requires UPI readiness; Brazil requires Pix support; and European retailers need strong cross-border ecommerce, receipt, and fraud controls.
Final Takeaway
Retail billing software statistics point to one conclusion: the billing system is now part of the retail operating core. It is not enough for software to accept payment and print a receipt. The system has to preserve transaction evidence, support local payment behavior, connect sales to inventory, manage receipts and refunds, reveal fraud patterns, and give managers a clean view of performance by channel, store, tender, and region.
The most polished billing systems help retailers see the whole transaction lifecycle: how the customer paid, how the item moved, how the receipt was stored, whether the return was valid, and whether the final numbers matched settlement and inventory. That is where the statistics become useful. They show that retail billing software should be judged by the clarity it creates after checkout as much as by the speed it delivers at the point of sale.
The strongest retailers will not judge billing software only by whether it can process a sale. They will judge it by whether it reduces checkout friction, improves payment reliability, makes returns easier to control, strengthens proof-of-purchase records, and turns transaction data into decisions. That is where the statistics matter most: they show which parts of retail billing are becoming too large, too costly, or too complex to manage with disconnected systems.