Ecommerce payments are where purchase intent becomes approved revenue. A shopper can compare products, accept the price, enter checkout, and still fail to become a customer if the payment method is missing, authorization fails, authentication creates friction, or fraud rules reject a legitimate order. That makes payments a conversion system, a trust system, and a financial-control system at the same time.
The strongest ecommerce payment statistics show why payment strategy now belongs beside checkout design, fraud operations, international expansion, and finance. Global ecommerce spend has grown from $1.2 trillion in 2014 to more than $6.8 trillion in 2024, while digital payment value across ecommerce and in-person commerce has reached $18.7 trillion. Digital wallets now lead global ecommerce payment value, real-time payments are expanding, and merchants still lose large sums when good transactions are falsely declined.
Executive Ecommerce Payment Benchmarks
These headline benchmarks show the scale of ecommerce payment value, the shift toward wallets and real-time methods, the conversion impact of payment choice, and the risk created by false declines and fraud.
The numbers that define the ecommerce payment problem
• Worldpay reports global ecommerce spend grew from $1.2 trillion in 2014 to more than $6.8 trillion in 2024.
• Digital payment value across ecommerce and in-person commerce grew from $1.7 trillion in 2014 to $18.7 trillion in 2024.
• McKinsey reports global payments revenue grew by an average 7% annually from 2019 to 2024, even though growth slowed to 4% in 2024 after 12% growth in 2023.
• Digital wallets represented 53% of global ecommerce payment value in 2024, equal to roughly $3.6 trillion in online payment value.
• Worldpay projects digital wallets will reach 65% of global ecommerce value by 2030.
• Adyen reports that about 51% to 54% of shoppers may leave checkout or a store if they cannot use their preferred payment method.
• MRC reports that 43% of merchants now accept real-time payments, making A2A and instant rails a rising ecommerce payment category.
• Checkout.com estimates merchants in the U.S., U.K., France, and Germany lost $50.7 billion to false declines.
• Checkout.com also found 45% of consumers would not retry a second payment after one false decline.
• Juniper Research forecasts online payment fraud losses will exceed $362 billion globally from 2023 to 2028.
• Juniper also projects $91 billion in online payment fraud losses in 2028 alone.
• Reuters reported European Economic Area payment fraud rose to EUR 4.2 billion in 2024, up from EUR 3.5 billion in 2023.
Executive readout The headline data points to four different payment challenges: method fit, authorization quality, fraud control, and regional localization. A merchant that treats payments as a simple processor setting will miss the real operating problem. The more useful approach is to separate payment performance by country, device, method, approval result, fraud decision, and refund outcome.
Why Ecommerce Payments Are a Revenue-Control System
A payment is often treated as the final technical step in checkout, but it is really a decision point where multiple systems meet. Product, price, delivery, tax, payment method, bank authorization, fraud screening, authentication, and settlement all have to work before the merchant can call the order successful.
That is why ecommerce payment statistics should be read as revenue-control statistics. Payment choice determines whether the shopper can pay the way they expect. Authorization determines whether the submitted payment becomes revenue. Fraud controls determine whether growth is profitable. Settlement and refund logic determine whether finance and customer service can trust the record after the sale.
| Payment layer | What it controls | What can break |
|---|---|---|
| Payment method | Whether the shopper can pay the way they expect | Checkout abandonment or lower conversion |
| Authorization | Whether a submitted transaction is approved | False declines and lost revenue |
| Authentication | Whether the buyer can complete verification | Challenge drop-off or failed orders |
| Fraud rules | Whether risk is blocked without rejecting good buyers | Chargebacks or overblocking |
| Settlement | Whether money clears and reconciles correctly | Finance and payout issues |
| Refunds | Whether reversals are clean and traceable | Support disputes and customer frustration |
| Local payment fit | Whether checkout feels trusted in each country | Cross-border conversion loss |
This framing prevents a common mistake. A merchant can add more payment logos and still lose revenue if cards decline too often, wallets are hidden on mobile, local bank methods are missing in key markets, fraud rules are too aggressive, or refunds fail after the sale. The stronger question is whether the payment stack turns buyer intent into approved, trusted, profitable transactions.
Market Scale: Ecommerce Spend and Global Payments Revenue
Market-size statistics do not tell a merchant exactly which payment method to add, but they explain why payment optimization has become material. When ecommerce payment value is measured in trillions, a small improvement in approval rate, wallet completion, fraud screening, or regional payment fit can affect a meaningful amount of revenue.
Ecommerce payment scale benchmarks
• Global ecommerce spend grew from $1.2 trillion in 2014 to more than $6.8 trillion in 2024.
• That means global ecommerce payment value became more than 5.6 times larger over the decade.
• Digital payment value across ecommerce and in-person commerce rose from $1.7 trillion to $18.7 trillion over the same 2014-2024 period.
• The wider digital payment value pool became roughly 11 times larger over the decade.
• Worldpay projects digital payment value will exceed $33.5 trillion by 2030.
• Digital payment methods grew from 34% of ecommerce value in 2014 to 66% in 2024.
• Digital wallets alone represented 53% of global ecommerce value in 2024.
• BNPL online spend grew from about $2.2 billion in 2014 to $342 billion in 2024.
• McKinsey reports global payments revenue growth slowed to 4% in 2024, after 12% growth in 2023.
• McKinsey links the slowdown to interest-rate effects, fee pressure, and structural shifts toward lower-yield payment methods.
Market readout The payment market is growing, but it is also changing composition. Wallets, instant payments, BNPL, lower-cost payment rails, and stricter fraud controls are shifting where value and risk sit. For ecommerce leaders, the question is not simply whether payment volume is rising. It is whether the merchant captures more of that volume without increasing avoidable declines, disputes, fees, or fraud.
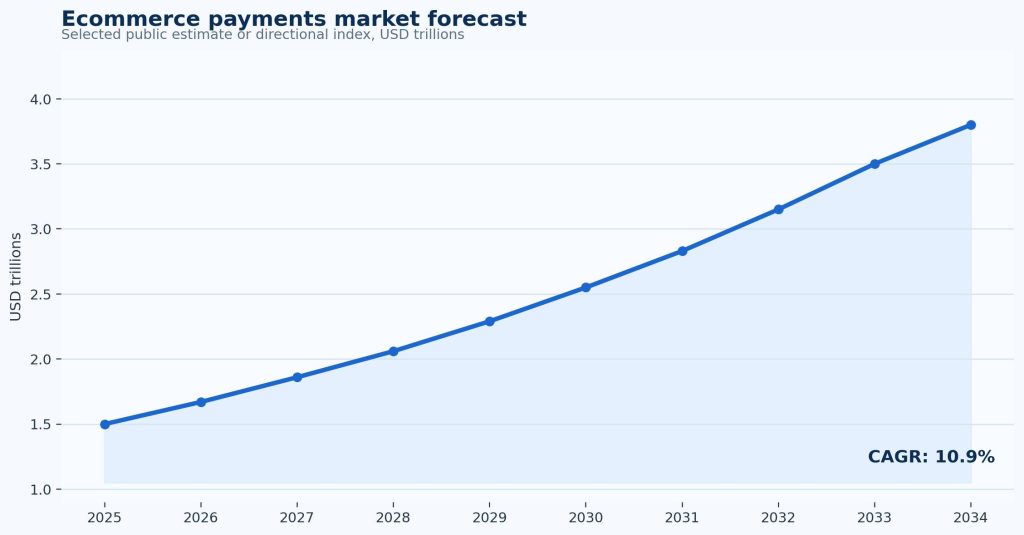
Figure 1. Ecommerce payment scale should be reviewed alongside wider digital payment value because small approval or conversion improvements become significant at high transaction volume.
Digital Wallets, Cards, BNPL, and A2A Payment Mix
Payment mix matters because each method changes both conversion and economics. A digital wallet can reduce mobile friction. A card can be familiar and profitable when authorization works well. BNPL can raise conversion or order value but may change returns, fees, and customer quality. Account-to-account payments can reduce card dependency but require different refund and fraud workflows.
Payment-method shift benchmarks
• Digital wallets reached 53% of global ecommerce payment value in 2024 and are projected to reach 65% by 2030.
• Wallet ecommerce value was roughly $3.6 trillion in 2024.
• Worldpay reports smartphones’ share of global ecommerce spend rose from 19% in 2014 to 57% in 2024.
• In the United States, digital wallets reached 39% of online spending in 2024, up from 15% in 2014.
• U.S. consumer spending across ecommerce and POS still had 67% of value through credit, debit, and prepaid cards in 2024.
• Worldpay reports 65% of Americans fund digital wallets with credit and debit cards, showing that wallets often sit on top of card economics.
• European ecommerce payment mix included digital wallets at 33%, debit/prepaid cards at 20%, credit cards at 19%, A2A at 17%, and BNPL/POS financing at 8%.
• The U.K. ecommerce payment mix had digital wallets at 40% in 2024, with a forecast to reach 58% by 2030.
• Germany’s ecommerce mix included digital wallets at 35%, A2A at 26%, and BNPL at 20% in 2024.
• Poland’s ecommerce payment mix was dominated by A2A at 70% in 2024, with a projected rise to 78% by 2030.
• China’s ecommerce payment mix is wallet-led, with digital wallets representing more than 80% of ecommerce transaction value.
• MRC reports 43% of merchants now accept real-time payments.
| Payment method | Conversion value | Risk or trade-off |
|---|---|---|
| Digital wallet | Faster mobile checkout, less typing, stronger returning-customer flow | Wallet coverage and placement must be localized |
| Card | Familiar and widely used in North America and many developed markets | Declines, fraud, chargebacks, and issuer behavior |
| BNPL | Can lift conversion and average order value | Provider fees, returns, disputes, and customer quality |
| A2A / instant payment | Fast settlement and local bank-account fit | Different refund, authentication, and fraud workflows |
| Local bank or cash alternative | Trust and familiarity in specific countries | Market-specific integration and support burden |
Payment-method rule Payment choice should not be managed as a feature checklist. The better question is which methods increase approved, profitable orders for a specific market, device, customer segment, and product category. A method that raises conversion but increases returns, fraud, or fees should be measured through margin quality, not only order count.
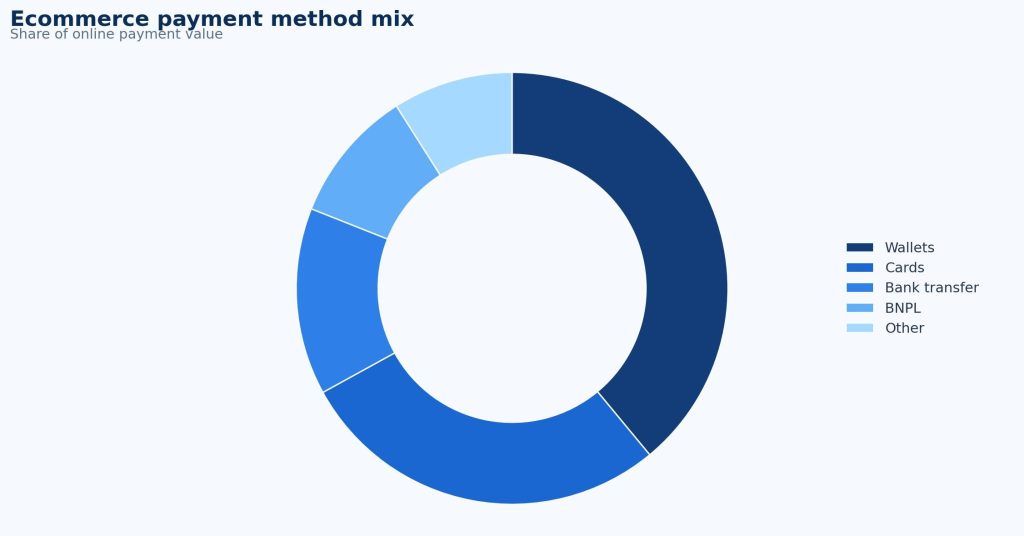
Figure 2. Digital wallet adoption differs sharply by region, which is why payment localization should be measured by country rather than by a global average.
Payment Choice and Checkout Conversion
Payment-method availability is now a conversion variable. A merchant can have a clean checkout form and strong product demand, but still lose sales if customers cannot use the method they trust. The conversion impact is highest when a missing method matches a local expectation: a wallet in a mobile-first market, A2A in a bank-transfer-heavy country, installments in a market where consumers expect financing, or a local card type that international processors handle poorly.
Preferred-method and conversion benchmarks
• Adyen reports 51% of shoppers will walk away if they cannot use their preferred payment method.
• Adyen also cites 54% of shoppers abandoning online checkout or leaving a store when their preferred payment method is missing.
• Adyen APAC trend coverage cites 55% of global consumers abandoning purchases when preferred methods are unavailable.
• Baymard’s checkout abandonment data shows 10% of U.S. shoppers abandon because there are not enough payment methods.
• Baymard also reports 8% abandon because their card was declined.
• Stripe has reported a 12% average revenue lift and 7.4% conversion-rate lift from surfacing at least one relevant payment method beyond cards in a payment-method experiment.
• Digital wallets represented more than half of global ecommerce payment value, which makes wallet readiness a mainstream conversion issue rather than a niche add-on.
• A2A payment dominance in markets such as Poland shows why local payment habits can be more important than broad global payment averages.
The right response is not to add every method everywhere. Too many irrelevant options can clutter checkout, increase maintenance, and make payment analytics harder to read. A better approach is to decide by market and segment: which methods shoppers expect, which methods approve reliably, which methods have acceptable fees, and which methods produce clean refunds and manageable disputes.
Conversion readout: Payment choice should be reviewed with conversion, approval, refund, fraud, and fee data together. A payment method that increases order count but produces higher fraud, disputes, or return costs may not improve profitable revenue. A method that matters deeply in one region may be unnecessary elsewhere.
Mobile Commerce and Express Payment Behavior
Mobile checkout is where payment strategy and usability become the same problem. Smartphones increase typing friction, while wallets, saved credentials, autofill, and express checkout can shorten card entry, address entry, authentication, and confirmation. The payment method is not separate from the user experience; it often determines whether a mobile shopper can complete the order quickly enough.
Mobile payment and express checkout signals
• Smartphones accounted for 56.4% of U.S. online holiday purchases in Adobe’s 2025 holiday data.
• Adobe reported $145.2 billion in U.S. mobile holiday spend, up 10.7% year over year.
• Worldpay reports smartphones’ share of global ecommerce spend rose from 19% in 2014 to 57% in 2024.
• Stripe notes mobile carts are abandoned at more than twice the rate of desktop carts.
• Digital wallets represented 53% of global ecommerce value in 2024 and are projected to reach 65% by 2030.
• Wallet-based one-click payment has been described by Stripe as about three times faster than manually entering payment details.
• In Stripe checkout research, only 40% of North American sites supported one-click checkout and only 34% of European ecommerce sites did so.
• Stripe found 75% of North American consumers and 78% of European consumers were more likely to complete a purchase when one-click checkout was available.
| Mobile issue | Metric to track | Why it matters |
|---|---|---|
| Wallet visibility | Wallet conversion rate and button click-through | Shoppers may expect wallet buttons above manual card entry |
| Manual card entry | Checkout time and form error rate | Typing friction can reduce mobile completion |
| Authentication challenge | Challenge completion rate | Failed verification blocks otherwise willing buyers |
| Saved credentials | Returning-customer completion | Repeat shoppers should not re-enter the same data |
| Payment failure | Retry success by device | Mobile shoppers may not retry if the experience is slow |
Mobile interpretation The mobile payment opportunity is practical: fewer keystrokes, faster confirmation, cleaner authentication, and less frustration for returning customers. Teams should test payment method visibility, wallet button placement, saved address logic, decline messages, and authentication flows on real mobile devices rather than relying only on desktop checkout analytics.
Authorization, False Declines, and Payment Failure
A failed payment is different from an abandoned cart. The customer has already tried to pay. That makes authorization one of the highest-leverage payment metrics because an approval-rate improvement can recover demand that has already reached the revenue stage.
Authorization and false-decline benchmarks
• Checkout.com estimates merchants in the U.S., U.K., France, and Germany lost $50.7 billion to false declines.
• False-decline losses rose from about $20 billion in 2019 to $50.7 billion, an increase of roughly 140% in the referenced study period.
• Checkout.com research included 1,500 enterprise businesses and 8,000 consumers across the U.S., U.K., France, and Germany.
• 45% of consumers said they would not retry a payment after one false decline.
• 42% said they would never return to that retailer after a false decline.
• Baymard reports 8% of U.S. shoppers abandon because their card was declined.
• Checkout.com has reported that some merchants see up to 5% of payments wrongly declined as fraud.
• Stripe describes false declines as legitimate transactions rejected by a bank or payment processor, making them both a revenue and customer-experience issue.
• Stripe product materials say Authorization Boost recovers 20% of false declines on average, which should be read as a product benchmark rather than a universal industry outcome.
Authorization is not a single number. Declines can come from insufficient funds, issuer risk rules, processor errors, authentication failures, suspected fraud, card data mistakes, cross-border routing, or technical timeouts. A useful payment dashboard separates decline reasons so the fix can match the problem. A customer entering a wrong CVV needs a different experience from a card blocked by issuer risk rules or a transaction rejected because the merchant has poor local acquiring performance.
Authorization readout Payment failure should be analyzed after the shopper submits payment, not only before checkout starts. The key questions are: which good customers are being declined, which decline reasons are recoverable, which retry paths work, which methods rescue failed cards, and whether fraud rules are rejecting too much legitimate demand.
Fraud, Chargebacks, and Trust
Fraud controls protect margin, but over-blocking can damage conversion and loyalty. Ecommerce payment teams need to stop stolen credentials, account takeover, refund abuse, friendly fraud, bot attacks, and chargebacks without rejecting too many good buyers. The statistics are strongest when they are read as a balance between loss prevention and approved revenue.
Fraud and chargeback benchmarks
• Juniper Research forecasts online payment fraud losses will exceed $362 billion globally from 2023 to 2028.
• Juniper projects $91 billion in online payment fraud losses in 2028 alone.
• Visa Acceptance/Cybersource’s 2025 fraud research surveyed 1,082 ecommerce payment and fraud professionals across 38 countries.
• LexisNexis APAC research found 52% of organizations reported fraud rising over the previous 12 months.
• In that APAC benchmark, digital channels accounted for 51% of overall fraud losses.
• The same APAC research found fraud costs ranged from 3.07x to 4.59x the actual value lost to fraudsters.
• New payment methods such as wallets, payment apps, crypto, and BNPL accounted for 34% of fraud in the APAC benchmark.
• Reuters reported EEA payment fraud rose to EUR 4.2 billion in 2024, up from EUR 3.5 billion in 2023.
• Mastercard-sponsored research cited in business technology coverage estimated sellers could lose $15 billion to fraudulent chargebacks in 2025.
• The same coverage cited chargeback volume rising from $33.79 billion to $41.69 billion by 2028.
| Risk-control goal | Metric | Bad outcome if ignored |
|---|---|---|
| Stop fraud | Fraud rate and fraud value | Direct loss, inventory loss, and operational cost |
| Avoid overblocking | False-decline rate | Good customers are rejected |
| Reduce disputes | Chargeback rate and reason mix | Fees, penalties, and margin loss |
| Manage authentication | Challenge rate and completion rate | Verification drop-off blocks revenue |
| Protect trust | Payment complaint rate and refund issue rate | Lower repeat purchase and higher support cost |
Risk interpretation Fraud should not be measured apart from authorization. A fraud system can make loss rates look better by rejecting too many good transactions. A payment system can make conversion look better while allowing too much abuse. The strongest teams review fraud, chargebacks, false declines, authentication challenges, manual review, and customer complaints together.
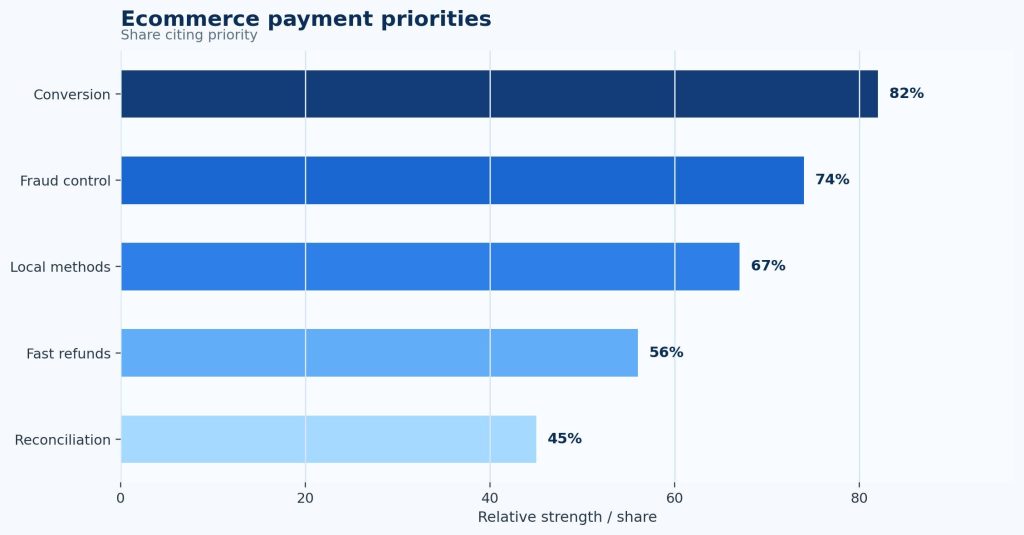
Figure 3. Payment risk metrics should be separated because false declines, online fraud, chargebacks, and regional fraud exposure require different controls.
Regional Ecommerce Payment Intelligence
Regional payment data is one of the highest-value parts of an ecommerce payments report. Global averages hide large country differences in wallet adoption, card reliance, BNPL expectations, instant payments, authentication, installments, and fraud exposure. Payment localization should therefore be measured by country, not only by global payment method.
North America
• The U.S. ecommerce market is above $1 trillion annually, making small payment gains financially meaningful.
• Worldpay reports 67% of U.S. consumer spending across ecommerce and POS still came through credit, debit, and prepaid cards in 2024.
• U.S. digital wallets reached 39% of online spending in 2024, up from 15% in 2014.
• Worldpay reports 65% of Americans fund digital wallets with credit and debit cards.
• Checkout.com’s false-decline research includes U.S. merchants and consumers, which makes approval quality a major North American payment issue.
• LexisNexis North America ecommerce and retail fraud research surveyed 569 fraud and risk executives across the U.S. and Canada.
North America is not simply a card market or a wallet market. Wallets are growing, but many wallets remain card-funded. That means merchants need both strong wallet experiences and strong card authorization, fraud screening, chargeback handling, and refund workflows.
Europe and the United Kingdom
• European ecommerce payment mix included digital wallets at 33%, debit/prepaid cards at 20%, credit cards at 19%, A2A at 17%, and BNPL/POS financing at 8%.
• Worldpay projects European ecommerce wallet share will reach 46% by 2030.
• Germany’s ecommerce payment mix included digital wallets at 35%, A2A at 26%, and BNPL at 20% in 2024.
• Poland’s ecommerce payment mix was dominated by A2A at 70% in 2024 and is projected to rise to 78% by 2030.
• Digital wallets led U.K. ecommerce payment methods with 40% share in 2024, forecast to reach 58% by 2030.
• Financial Times coverage of UK Finance and Accenture data reported 42% of UK adults were registered with a digital wallet in 2023, up from 30% in 2022.
• The same coverage reported 34% of British consumers used mobile contactless payments at least monthly in 2023.
• Reuters reported EEA payment fraud rose to EUR 4.2 billion in 2024.
Europe requires country-level payment planning. Germany, France, Italy, Poland, and the U.K. all have different wallet, card, A2A, BNPL, authentication, and bank-transfer expectations. A pan-European card-only strategy can leave conversion on the table even when the checkout technically accepts payment.
Asia-Pacific, India, and China
• Worldpay reports China is the world’s largest ecommerce market and digital wallets dominate its online payment mix.
• In China, wallets represented more than 80% of ecommerce transaction value in 2024.
• India’s UPI has made account-to-account payments a defining part of digital commerce behavior.
• Adyen APAC trend coverage cites 55% of global consumers abandoning purchases when preferred payment methods are unavailable.
• LexisNexis APAC fraud research found 52% of organizations reported fraud increasing.
• Digital channels accounted for 51% of APAC fraud losses in the cited benchmark.
• Fraud costs in the APAC benchmark ranged from 3.07x to 4.59x the actual value lost to fraudsters.
• Southeast Asian markets show heavy wallet adoption, especially in mobile-first ecommerce categories.
Asia-Pacific is not one payment market. China is wallet-dominant, India is shaped by UPI and real-time bank payments, and Southeast Asian countries have their own wallet, bank-transfer, cash-alternative, and mobile behavior. Merchants expanding into APAC need local payment intelligence rather than a single global checkout setup.
Latin America
• Brazil’s Pix has changed checkout expectations by making instant account-to-account payment mainstream.
• Latin American ecommerce often requires local cards, installments, cash alternatives, wallets, and bank-based methods alongside global card acceptance.
• Mexico, Colombia, Argentina, Chile, and Peru require country-specific testing because card behavior, installments, cash-payment alternatives, and bank-transfer habits vary widely.
• For cross-border merchants, local payment fit can matter as much as translation or currency display because payment trust is part of localization.
• Instant-payment rails can reduce card dependency but require merchants to manage refund, reconciliation, and fraud workflows differently.
| Region | Main ecommerce payment priority |
|---|---|
| North America | Keep card approval strong while expanding wallets and fraud controls |
| Europe | Localize wallets, A2A, BNPL, and authentication expectations by country |
| United Kingdom | Support mobile wallets, cards, and strong fraud/customer verification |
| Asia-Pacific | Treat wallets and instant payments as core infrastructure |
| India | Plan around UPI and mobile-first payment behavior |
| China | Treat wallets as default ecommerce infrastructure |
| Latin America | Support Pix, installments, local cards, and cash/bank alternatives |
Regional readout Regional payment intelligence should guide product setup, not just market commentary. A merchant should compare method-level conversion, authorization rate, refund success, fraud, and fees by country. That prevents one global checkout from forcing every shopper into the same payment behavior.
Cross-Border Payments and Localization
Cross-border payments are not solved by card acceptance alone. A shopper may need local currency, a familiar wallet, a trusted bank method, transparent duties, clear refund handling, and authentication that works with their bank. Payment localization should therefore be measured by country-level conversion, approval rate, dispute rate, and refund success.
A cross-border payment can fail even when the merchant technically supports the payment method. Issuer risk rules may treat the transaction as unusual. The shopper may not trust the merchant’s currency display. Authentication may be unfamiliar. The refund process may be unclear. Local acquiring may be missing. The payment page may show logos that do not match the shopper’s preferred payment habits. Those issues are payment problems, but they are also trust problems.
Cross-border payment issues worth separating
• Currency mismatch can reduce trust when shoppers see an unexpected exchange rate or foreign-currency charge.
• Local acquiring can improve approval outcomes in some markets by making transactions look more familiar to issuers.
• Refund success matters because customers judge cross-border merchants by how easily money returns after a cancellation or return.
• Duties and tax uncertainty can create payment-stage hesitation even when the shopper wants the product.
• Fraud screening should be localized because risk signals differ by country, payment method, and device behavior.
• Payment method priority should be tested by country because a method that is essential in one market may be optional in another.
Localization principle The strongest cross-border payment setup is both standardized and local. It uses one measurement framework across countries but localizes methods, currencies, acquiring, authentication, refund communication, and risk rules where shopper behavior requires it.
Ecommerce Payment Diagnostic Table
A polished ecommerce payment benchmark should help a team decide where to look next. The most useful structure connects each payment problem to the metric that reveals whether revenue is being lost before, during, or after authorization.
| Problem area | Core signals to measure | Useful benchmark angle |
|---|---|---|
| Payment choice | Preferred-method exits, method-level conversion, wallet uptake | Preferred-method abandonment stats |
| Wallet readiness | Wallet completion, mobile wallet use, express checkout uptake | Wallet share and mobile behavior |
| Authorization | Approval rate, decline reason, retry success, fallback method use | False-decline loss benchmarks |
| Fraud | Fraud rate, chargebacks, manual review, blocked orders | Online fraud loss forecasts |
| Authentication | Challenge rate, challenge completion, abandonment after verification | SCA and payment verification impact |
| Regional fit | Country-level conversion, payment mix, local-method performance | Regional wallet, A2A, card, and BNPL differences |
| Cross-border | FX complaints, local acquiring performance, refund success | Localization and trust |
| Profitability | Fees, refunds, disputes, fraud, method-level margin | Payment-method trade-offs |
Each metric belongs to a business question: are shoppers blocked by missing methods, are good payments declined, are fraud rules too strict, are authentication steps failing, or is local payment fit weak in a specific country?
90-Day Ecommerce Payment Benchmark Plan
Statistics become useful when they are translated into a measurement plan. A practical ecommerce payment review can be organized into a 90-day cycle rather than a vague processor optimization project.
| Timing | What to do | Output |
|---|---|---|
| Days 1-30 | Capture baseline by country, device, payment method, approval rate, decline reason, fraud, chargebacks, refund flow, and support complaints. | Payment performance map |
| Days 31-60 | Fix high-confidence issues such as missing local methods, wallet placement, retry logic, decline messaging, authentication friction, and fraud-rule overblocking. | Controlled payment improvements |
| Days 61-90 | Review approval lift, fraud movement, chargebacks, refund success, method-level margin, and regional conversion changes. | Repeatable payment scorecard |
Planning principle The goal is not to add every payment method. The goal is to identify which payment changes increase approved, trusted, profitable transactions in each market. Teams should prioritize changes with clear volume, measurable friction, and a defined owner.
Metrics Ecommerce and Payments Teams Should Track
The final scorecard should be detailed enough to locate the payment leak without becoming a vanity dashboard. These metrics create a practical baseline for mature ecommerce payment reviews.
| Metric | Why it matters |
|---|---|
| Payment-method conversion | Shows which methods complete orders and which create drop-off |
| Authorization rate | Measures approved payment value divided by submitted payment value |
| False-decline rate | Captures legitimate customers wrongly rejected |
| Decline reason mix | Shows whether failures are issuer, fraud, funds, technical, or authentication-related |
| Retry success rate | Shows whether failed payments can be recovered |
| Wallet conversion rate | Measures express and mobile payment performance |
| BNPL conversion and average order value | Shows financing impact and order-size effects |
| Method-level margin | Includes fees, refunds, fraud, disputes, and customer quality |
| Fraud rate | Protects revenue quality and inventory |
| Chargeback rate | Shows dispute and abuse exposure |
| Authentication completion | Measures verification friction |
| Refund success rate | Protects customer experience after the sale |
| Country-level payment mix | Guides localization and expansion priorities |
| Cross-border approval rate | Shows whether international payment routing is working |
Teams should also compare combinations. A wallet may raise conversion but change refund behavior. A stricter fraud rule may reduce chargebacks while increasing false declines. A new A2A method may reduce card fees but require different customer-service handling. The value of the dashboard is in these trade-offs, not in single-number reporting.
Payment Data Quality, Reconciliation, and Refund Operations
Payment statistics are strongest when they connect checkout behavior to back-office reality. A payment record does not stop at authorization. It has to settle, reconcile, support refunds, feed revenue reporting, connect to fraud evidence, and remain searchable when customer service investigates a dispute. If the payment record is incomplete, the merchant may still see an order confirmation, but finance and support teams inherit the cleanup.
This is why ecommerce payment systems should be judged by data quality as well as conversion. The transaction should preserve payment method, authorization response, issuer decline code, fraud decision, authentication result, currency, local acquiring path, refund eligibility, settlement timing, fee category, and dispute status. Those fields help teams understand whether a payment failed because of method mismatch, issuer risk, insufficient funds, authentication friction, processor error, or a fraud rule.
Payment operations signals worth separating
• A strong payment record should show submitted value, approved value, declined value, refunded value, disputed value, and settled value as separate metrics.
• Approval rate is more useful when split by country, device, issuer, payment method, card type, wallet, and customer segment.
• Refund success should be tracked because a failed or delayed refund can damage trust even after the original sale succeeded.
• Chargebacks should be linked to original payment method, order category, delivery evidence, support contact, refund attempt, and authentication result.
• Payment reconciliation should separate timing differences from true exceptions so finance does not treat every settlement lag as a payment defect.
• A payment method that increases checkout conversion can still weaken margin if it also increases refunds, fees, fraud, or support contacts.
| Payment data field | Why it matters | Operational use |
|---|---|---|
| Authorization response | Explains why a transaction was approved or declined | Payment recovery and issuer-routing review |
| Fraud decision | Shows whether a risk rule blocked or challenged the transaction | Overblocking and fraud-loss analysis |
| Authentication result | Shows whether verification succeeded or created drop-off | SCA and challenge-flow optimization |
| Settlement status | Confirms whether approved value became cash | Finance reconciliation and payout monitoring |
| Refund trail | Shows original tender, refund method, and completion status | Support, dispute prevention, and customer trust |
| Dispute reason | Explains chargeback or customer complaint category | Fraud, fulfillment, and policy improvement |
Operations readout Payments become more valuable when the data survives after checkout. A merchant that tracks only completed orders may miss refund failures, reconciliation exceptions, fee pressure, or fraud rules that reject good customers. The stronger view follows every payment from shopper selection to authorization, settlement, refund, and dispute outcome.
Payment Method Profitability and Unit Economics
A payment-method decision should not be based only on conversion lift. Ecommerce teams often want more methods because shoppers expect choice, but finance teams need to know whether those methods create profitable revenue. A payment method can increase order count while also increasing fees, fraud exposure, return rates, or customer-service workload. That does not mean the method is bad; it means it should be measured through unit economics.
Digital wallets may reduce typing and improve mobile completion, but their economics can still depend on the underlying funding source. Cards remain central in many markets, but they bring interchange, authorization, chargeback, and fraud-screening costs. BNPL may increase average order value, but it should be reviewed with provider fees, refund behavior, dispute rates, and repeat-customer quality. Real-time A2A payments may reduce card dependency, but refund and fraud workflows can differ sharply from card rails.
Method-level profitability benchmarks to build from
• Worldpay reports digital wallets represented 53% of global ecommerce value in 2024, making them too large to treat as an optional add-on.
• U.S. wallets reached 39% of online spending in 2024, but Worldpay also reports 65% of Americans fund digital wallets with cards, which means wallet strategy and card economics often overlap.
• BNPL online spend grew from about $2.2 billion in 2014 to $342 billion in 2024, showing strong adoption but also a need to review fees, returns, and customer quality.
• MRC reports 43% of merchants accept real-time payments, making A2A and instant rails a practical payment-method category rather than a niche experiment.
• Checkout.com estimates $50.7 billion in false-decline losses across four major markets, showing that approval quality can matter as much as payment-method availability.
• Juniper forecasts $91 billion in online payment fraud losses in 2028 alone, showing why payment growth must be measured with risk quality.
| Method decision | What to compare | Why it matters |
|---|---|---|
| Add a digital wallet | Mobile conversion, authorization, repeat purchase, wallet-funded card behavior | Wallets can reduce friction but still need method-level margin review |
| Add BNPL | Conversion, AOV, provider fee, refund rate, disputes, repeat behavior | Financing can lift orders but may change risk and economics |
| Add A2A / instant payment | Country conversion, settlement speed, refund process, fraud handling | Bank rails can fit local markets but require different operations |
| Optimize cards | Approval rate, false declines, fraud, chargebacks, retries, issuer routing | Cards remain critical in many markets and failures can erase ready-to-buy demand |
| Add local payment methods | Country-level conversion, support contacts, refund success, customer trust | Localization can improve trust but should be market-specific |
Profitability readout The best payment mix is not the longest list of methods. It is the mix that increases approved, trusted, profitable orders in the markets that matter. Payment teams should review conversion, authorization, fees, refunds, fraud, and disputes together before declaring a method successful.
How Payment Priorities Change by Ecommerce Business Model
Ecommerce payments do not behave the same way for every business model. A fashion retailer, digital subscription company, online marketplace, cross-border brand, grocery delivery app, and B2B ecommerce seller may all accept online payments, but the payment risks are different.
Retail ecommerce and direct-to-consumer brands
Retailers usually care about wallet coverage, card approval, returns, refunds, and fraud controls. The payment record must connect to the order, shipment, return window, customer profile, and dispute evidence. For high-return categories such as apparel, payment success is only the first half of the story; refund flow and chargeback prevention matter after the order ships.
Subscription and SaaS ecommerce
Subscription businesses need more attention on recurring authorization, expired cards, failed renewals, payment retries, dunning flows, account updates, and involuntary churn. A payment that succeeds once at signup can still fail at renewal. For this model, the most important payment metric may be recovered recurring revenue rather than first-checkout conversion alone.
Marketplaces and multi-seller platforms
Marketplaces need payment intake, split payouts, seller onboarding, fraud review, disputes, refunds, escrow-like controls, and cross-border settlement. A marketplace can approve the customer payment but still face seller payout delays, dispute complexity, refund allocation issues, or platform abuse. Payment metrics must therefore cover both buyer checkout and seller-side settlement.
B2B ecommerce and high-value orders
B2B ecommerce payments usually involve higher transaction amounts, invoice-based billing, purchase orders, credit terms, bank transfers, approval workflows, and fraud prevention measures tied to business identity verification. Using a free invoice generator can simplify these complex payment processes by helping businesses create accurate, professional invoices that support smoother transactions, better financial tracking, and faster approvals. The checkout may look digital, but the payment behavior often mixes ecommerce and accounts receivable. These merchants should track approved value, payment terms, invoice conversion, and dispute reasons, not only cart completion.
| Business model | Payment priority | Metric emphasis |
|---|---|---|
| DTC retail | Wallets, cards, refunds, chargebacks | Method conversion, refund success, dispute rate |
| Subscriptions / SaaS | Recurring authorization and failed-payment recovery | Renewal approval, retry success, involuntary churn |
| Marketplaces | Buyer payments plus seller payouts | Checkout approval, payout timing, refund allocation, disputes |
| Cross-border brands | Local payment trust and currency fit | Country conversion, local approval, refund success |
| B2B ecommerce | Large-order approval and payment terms | Approved value, invoice conversion, credit and A2A usage |
Business-model readout: Payment strategy becomes more accurate when it is tied to the merchant model. A retailer may prioritize wallet conversion and returns, while a subscription company prioritizes renewal recovery. A marketplace needs payout and dispute visibility, while a B2B seller needs payment terms and high-value approval controls.
What Better Ecommerce Payment Teams Do Differently
The strongest payment teams do not only add methods or negotiate processor rates. They build a measurement system that shows where money is lost and who owns the fix. That system usually separates shopper friction, bank declines, fraud decisions, authentication outcomes, regional payment fit, fee pressure, and refund operations. Without that separation, teams often respond to the wrong problem.
1. They separate abandonment from payment failure
A shopper who leaves before selecting a payment method may be reacting to price, delivery, trust, or checkout complexity. A shopper whose payment fails after submission has a different problem: authorization, fraud screening, authentication, issuer response, processor routing, or method support. Treating both as generic checkout abandonment makes the fix weaker.
2. They review authorization before adding more methods
Adding payment methods can help, but a merchant with weak card approval may recover more revenue by improving authorization, decline messaging, retries, and local acquiring. Checkout.com’s false-decline benchmark shows why this matters: good customers may be rejected after they have already decided to buy, and many will not retry.
3. They measure fraud and false declines together
Fraud teams can reduce losses by blocking more transactions, but that can create hidden revenue loss if good buyers are rejected. Payment teams should compare fraud rate, chargeback rate, manual-review rate, approval rate, false-decline indicators, and customer complaints together. A lower fraud number is not automatically better if it comes from rejecting too many legitimate orders.
4. They localize by evidence, not assumptions
Regional payment preferences change quickly. The correct method mix in the United States is not the correct mix in Poland, Brazil, India, China, or the United Kingdom. Strong teams use country-level method conversion, approval rate, refund success, and fraud outcomes to decide where local methods are necessary and where they are only extra complexity.
5. They include finance and support in payment reviews
Payments do not end when checkout says approved. Finance sees settlement, fees, reconciliation, and refunds. Customer support sees payment complaints, duplicate charges, delayed refunds, and failed authentication. Fraud teams see disputes and abuse patterns. The most useful payment reviews include all of those signals so that conversion gains do not create operational losses later.
Maturity readout A mature ecommerce payment program does not chase every new payment rail. It builds a controlled system for increasing approved revenue while protecting margin, trust, and operational quality. The best benchmark is not payment-method count; it is the share of buyer intent that becomes clean, settled, low-risk revenue.
Practical Ecommerce Payment Scenario
Consider a merchant selling in the United States, the United Kingdom, Germany, Brazil, and India. The company sees healthy traffic and strong product demand, but checkout conversion varies sharply by country. In the United States, card approvals are lower than expected on mobile. In Germany, customers expect local bank and wallet options. In Brazil, Pix expectations are rising. In India, UPI behavior changes payment timing and customer expectation. In the United Kingdom, wallet and card behavior both matter, but fraud and authentication signals also need close monitoring.
A weak response would be to add a generic list of global payment logos and hope conversion improves. A stronger response is to build a country-level payment scorecard. The merchant should compare method-level conversion, approval rate, decline reason, authentication completion, refund success, fraud rate, chargeback rate, and support contact rate by market. That scorecard shows which country needs wallet placement, which country needs local A2A support, which market needs issuer-routing review, and which region needs stricter fraud rules without damaging legitimate buyers.
Global wallet share proves that digital wallets are no longer optional in many markets. False-decline losses show that successful checkout design can still fail at the bank decision. Fraud forecasts show that payments cannot be optimized only for conversion. Regional payment data shows why every market needs its own payment assumptions. Together, those signals turn ecommerce payments from a processor configuration into a measurable revenue system.
Payment Governance, Ownership, and Reporting Cadence
Ecommerce payment performance usually improves fastest when ownership is clear. Payments touch ecommerce, fraud, finance, customer support, product, engineering, and regional market teams. If each group optimizes only its own number, the merchant can create internal conflicts: fraud lowers chargebacks but rejects good customers, growth adds a new method without understanding refunds, finance pushes for lower fees while conversion falls, or support handles refund complaints without feeding the pattern back into payment design.
A better operating model gives every major payment metric an owner and a review cadence. Ecommerce teams should own shopper-facing conversion and method selection. Payment operations should own authorization, retries, processor routing, settlement, and refund success. Fraud teams should own risk rules, chargebacks, manual review, and abuse patterns. Finance should own fees, reconciliation, payout timing, and method-level margin. Regional teams should own local payment fit and country-level shopper expectations. The payment scorecard becomes useful only when these teams review the same facts.
Governance controls that make payment statistics actionable
• Review payment performance by country, device, payment method, issuer, processor, customer type, and order value band rather than relying on a single blended approval rate.
• Separate hard declines, soft declines, fraud declines, authentication failures, processor errors, and customer cancellations so the fix is assigned to the right owner.
• Track method-level margin because payment cost includes fees, fraud, refunds, chargebacks, manual review, and support workload, not only processing rate.
• Use a monthly regional payment review for markets where wallets, instant payments, BNPL, or local bank methods are changing quickly.
• Create a documented escalation route for approval-rate drops, fraud spikes, refund failures, settlement delays, and chargeback surges.
• Audit saved-payment and wallet flows on real mobile devices because payment defects often appear only after authentication, autofill, or wallet handoff.
| Team | Primary payment questions | Best metrics |
|---|---|---|
| Ecommerce / growth | Are shoppers completing payment in each market and device? | Method conversion, wallet completion, checkout exits |
| Payments operations | Are submitted payments becoming approved and settled revenue? | Authorization, decline mix, retry success, settlement status |
| Fraud / risk | Are controls stopping fraud without rejecting good buyers? | Fraud rate, false-decline indicators, chargebacks, manual review |
| Finance | Are payment methods profitable and reconcilable? | Fees, refunds, chargebacks, payout timing, method-level margin |
| Customer support | Are payment failures and refunds creating customer pain? | Payment complaints, refund contacts, duplicate-charge tickets |
| Regional teams | Do payment options match local expectations? | Country-level method mix, local approval rate, preferred-method exits |
The reporting cadence matters as much as the dashboard. Daily monitoring can catch processor outages, fraud spikes, failed refunds, and sudden approval drops. Weekly review is useful for method-level conversion, decline reason changes, and support themes. Monthly review is better for payment-method profitability, regional expansion decisions, BNPL performance, wallet adoption, and chargeback trends. Quarterly review should connect payment performance to broader ecommerce strategy, including international expansion, checkout redesign, loyalty, and fraud policy changes.
This governance layer prevents payment optimization from becoming a series of disconnected experiments. A wallet button test should not be judged only by conversion if it changes refund patterns. A fraud rule should not be judged only by lower fraud if approval rate falls. A new local payment method should not be judged only by adoption if settlement and support become harder. The most useful benchmark is the full path from shopper intent to approved payment, settled funds, successful fulfillment, and low-dispute customer outcome.
Governance readout Payment statistics become management tools only when they are assigned to owners. The most mature teams use one shared scorecard for conversion, authorization, fraud, refunds, fees, disputes, and regional fit. That shared view makes it easier to improve revenue without creating hidden risk elsewhere in the payment lifecycle.
How to use these benchmarks without overreacting
The statistics should be used as comparison points, not automatic targets. A merchant with a high wallet share may still need stronger card approval if many wallets are card-funded. A merchant with low fraud may still be losing money if false declines are high. A merchant with strong BNPL conversion may still need to review returns and disputes before expanding financing. The right payment benchmark is the one that explains a specific revenue or risk problem.
• Start with submitted payment value versus approved payment value before comparing payment logos or adding new methods.
• Review approved value after refunds, disputes, fraud, and fees so payment growth is measured as profitable revenue.
• Compare each country against its own shopper behavior instead of forcing every market to match a global average.
• Treat every large payment-method change as both a conversion test and a finance-control test.
This approach also keeps teams from chasing averages that do not apply to their catalog, customer mix, or risk profile. A low-ticket digital goods merchant, a high-value electronics seller, a subscription company, and a marketplace will not share the same payment priorities. The best use of external benchmarks is to identify where to investigate, then confirm the issue with the merchant’s own approval, fraud, refund, and margin data.
Ecommerce Payments FAQ
Common questions
• What are ecommerce payments?
Ecommerce payments are the methods, systems, and controls that let customers pay for online purchases. They include cards, wallets, BNPL, bank payments, local methods, authorization, fraud screening, authentication, settlement, refunds, and reconciliation.
• What is the most popular ecommerce payment method globally?
Digital wallets are the leading global ecommerce payment method by value. Worldpay reports wallets represented 53% of global ecommerce payment value in 2024 and are projected to reach 65% by 2030.
• Why do payment methods affect conversion?
Payment methods affect conversion because shoppers often expect familiar local options. If the preferred method is missing, the payment page can feel risky, inconvenient, or incompatible with the shopper’s account or device.
• What is a false decline in ecommerce payments?
A false decline happens when a legitimate transaction is rejected by a bank, processor, or fraud system. It is costly because the customer has already tried to pay, but the merchant still loses the order.
• How do digital wallets affect ecommerce checkout?
Digital wallets can reduce typing, speed up mobile checkout, and improve returning-customer flows. Their value depends on placement, device behavior, local adoption, authorization, and refund handling.
• How does BNPL affect ecommerce payments?
BNPL can increase conversion or order value by letting customers pay over time, but merchants should also measure provider fees, refund behavior, disputes, customer quality, and repeat purchase.
• What payment metrics should ecommerce teams track?
The most useful payment scorecard combines payment-method conversion, authorization rate, false declines, decline reasons, retry success, fraud, chargebacks, authentication completion, refund success, and country-level payment mix.
• How should merchants choose payment methods by region?
Merchants should choose methods by country-level conversion, approval rate, fraud exposure, fees, refund success, and shopper preference. A global card-only checkout can miss local expectations in wallet-, A2A-, BNPL-, or installment-heavy markets.
Final Takeaway
Ecommerce payment performance depends on payment choice, authorization quality, fraud control, mobile usability, and regional localization working together. The statistics show that merchants can lose revenue even after shoppers decide to buy if payment methods are missing, banks decline good transactions, authentication creates friction, or fraud systems block too aggressively.
The most useful payment analysis finds the actual leak. If shoppers leave when a preferred method is missing, the issue is local payment fit. If shoppers submit payment but fail, the issue may be authorization, issuer routing, authentication, or fraud rules. If fraud falls while approval rates also fall, the team may be protecting the business by rejecting too many good customers. If a method lifts conversion but increases disputes or returns, the issue is profitability, not just payment coverage.
For ecommerce leaders, the practical goal is a payment system that is fast, trusted, localized, measurable, and financially controlled. That means the right payment methods by market, strong mobile wallet support, smarter failed-payment recovery, fraud controls that protect margin without overblocking, and a scorecard that measures approved, profitable transactions rather than payment volume alone.