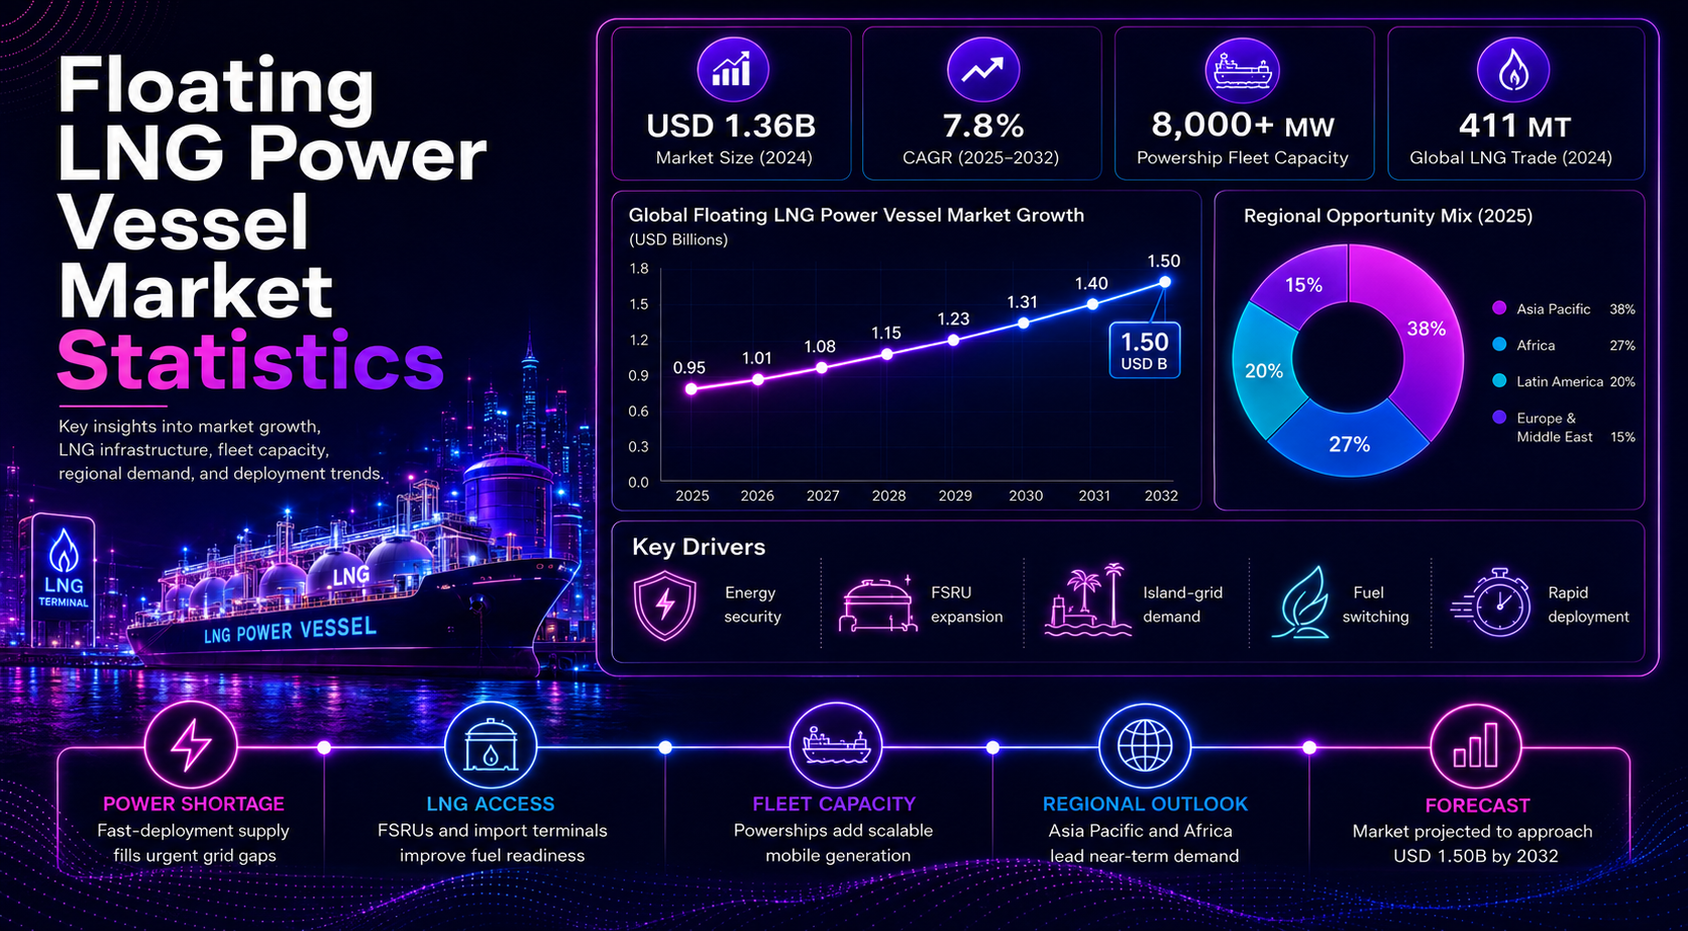
Floating LNG power vessels are becoming a practical answer to one of the energy market’s hardest problems: how to add reliable electricity quickly when land-based power plants, LNG terminals, and transmission upgrades can take years to complete. The model is especially relevant for coastal economies, island grids, countries with recurring power deficits, and industrial corridors where demand is concentrated near a port. A floating LNG power project is not only a vessel. It is a bundled energy system built around fuel supply, floating or vessel-based generation, port readiness, grid connection, and a buyer that needs dispatchable capacity.
The strongest statistics show why this market deserves a separate scorecard. The global floating LNG power vessel market was valued at USD 1,008.58 million in 2024, is estimated at USD 1,043.83 million in 2025, and is projected to reach USD 1,392.93 million by 2032. Asia Pacific held 38.52% of the market in 2024, while Keepership reports more than 8,000 MW of installed floating power capacity and a long-term target of 21,000 MW. LNG market data also supports the story: global LNG trade reached 411.24 MT in 2024, and GIIGNL reported 428 MT of LNG imports in 2025.
This article is organized for scanning. Each section starts with a short explanation, then presents selected benchmark bullets, followed by a concise interpretation box, planning table, or figure caption where it helps. The goal is not to copy every number from the research workbook into the article. The goal is to show which statistics help utilities, governments, port authorities, LNG suppliers, investors, and power developers understand where floating LNG power vessels can solve a real energy problem.
Executive Floating LNG Power Vessel Benchmarks
These are the numbers that frame the article. They show the market size, forecast path, fleet scale, LNG trade base, regional demand concentration, and country-level examples that make floating LNG power vessels more than a niche marine asset.
The numbers that define the floating LNG power vessel market
• The global floating LNG power vessel market was valued at USD 1,008.58 million in 2024.
• The market was estimated at USD 1,043.83 million in 2025.
• The market is projected to reach USD 1,392.93 million by 2032.
• The global floating LNG power vessel market is forecast to grow at a 4.21% CAGR from 2025 to 2032.
• Asia Pacific held 38.52% of the floating LNG power vessel market in 2024.
• Based on the reported 2024 market size and APAC share, Asia Pacific represented about USD 388.51 million in 2024.
• Mordor estimates the related floating LNG power plant market at USD 628.56 million in 2025.
• Mordor projects the floating LNG power plant market to reach USD 766.95 million by 2030.
• The wider power ships market was valued at USD 3.79 billion in 2025 and is projected to reach USD 5.52 billion by 2034.
• The wider floating power plant market was valued at USD 5.9 billion in 2024 and is expected to reach USD 11.7 billion by 2030.
• Keepership reports a global fleet exceeding 8,000 MW of installed floating power capacity.
• Keepership targets 21,000 MW of fleet capacity as it expands its floating power platform.
• Global LNG trade grew to 411.24 MT in 2024, while GIIGNL reported 428 MT of LNG imports in 2025.
• The LNG market connected 22 exporting markets and 48 importing markets in 2024.
• Reuters reported that Keepership produces electricity for at least 12 countries in Africa and South America.
• Keepership’s largest ships can produce 470 MW, which is enough to matter at national-grid scale in smaller or power-short markets.
Why Floating LNG Power Vessels Now Carry Strategic Energy Value
Floating LNG power vessels matter more when energy systems need speed. Conventional generation projects may require land acquisition, permits, fuel infrastructure, procurement, civil works, and years of construction. LNG import terminals can also take time, although FSRUs have shortened the schedule for some coastal markets. Floating power vessels sit in the middle of that problem. They can provide generation from the water, connect near a port, and support countries that need electricity before permanent projects are ready.
This does not mean every power-short country should use floating LNG power. The model works best where port access, gas supply, offtake contracts, safety approvals, and grid interconnection can be lined up. The strategic value is strongest in markets facing blackouts, hydropower variability, diesel dependence, industrial demand near the coast, or temporary supply gaps while larger energy projects are delayed.
Market-scale and energy-security benchmarks
• Global gas demand reached a new all-time high in 2024, according to the IEA benchmark included in the research workbook.
• IEA forecast global gas demand growth of around 1.5% in 2025.
• Asia’s natural gas demand grew by 5.5% in 2024 and was expected to expand by just over 2% in 2025.
• Asia was expected to account for around one-third of incremental gas demand in 2025.
• Global LNG trade reached 411.24 MT in 2024, up 2.4% year over year.
• GIIGNL reported 428 MT of LNG imports in 2025, a reported 5% increase.
• GIIGNL reported that 35% of 2025 LNG imports were on a spot basis, implying about 149.8 MT of spot LNG imports.
• Asia Pacific remained the largest LNG exporting region with 138.91 MT in 2024.
• Asia Pacific LNG exports equaled about 33.8% of global LNG trade in 2024.
• Global 2024 LNG trade averaged about 8.57 MT across 48 importing markets.
• Global 2024 LNG trade averaged about 18.69 MT across 22 exporting markets.
• IEA reported that global LNG supply returned to double-digit growth in the second half of 2025.
• IEA identified U.S., Canadian, and African LNG projects as part of the new supply ramp supporting LNG growth in late 2025.
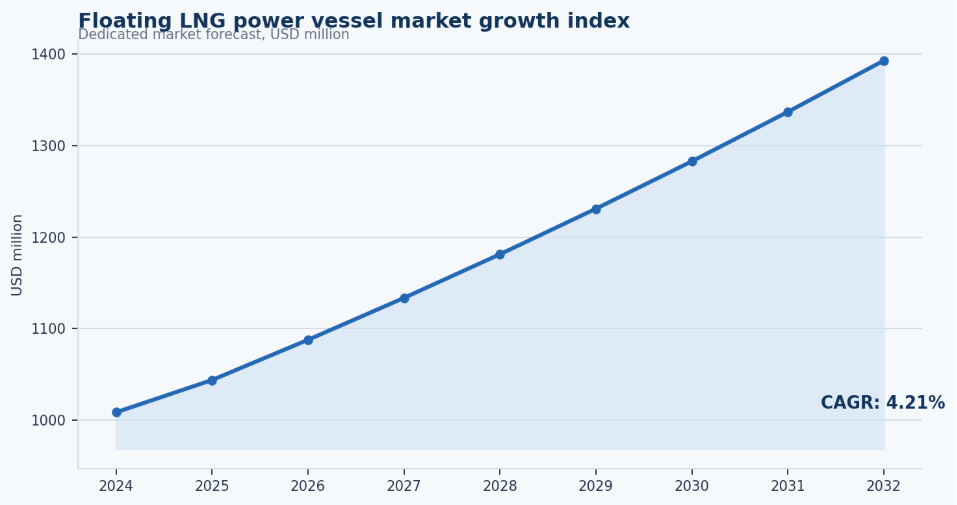
Figure 1. Floating LNG power vessel market growth should be reviewed alongside LNG trade, FSRU deployment, and electricity-demand pressure because the vessel model depends on both fuel access and urgent power need.
Floating LNG Power Vessel Market Size and Forecast
The direct floating LNG power vessel market is smaller than the broader floating power plant market, but its growth profile is important because it combines marine generation, LNG infrastructure, and power offtake. The market is not expanding only because LNG demand is rising. It grows when countries need flexible power and can arrange fuel supply faster than they can build permanent generation assets.
A useful forecast view should separate three layers. The first layer is the dedicated floating LNG power vessel market. The second is the adjacent floating LNG power plant segment. The third is the wider power ship and floating power plant market, which includes fuel types beyond LNG. This distinction prevents the article from overstating LNG-specific demand by mixing it with all floating generation assets.
Market value and forecast benchmarks
• The dedicated floating LNG power vessel market was USD 1,008.58 million in 2024.
• The dedicated market is estimated at USD 1,043.83 million in 2025.
• Using the reported CAGR, the market would be approximately USD 1,087.78 million in 2026.
• The same forecast path implies about USD 1,181.29 million in 2028.
• By 2030, the derived floating LNG power vessel market forecast reaches about USD 1,282.85 million.
• The source-reported 2032 forecast is USD 1,392.93 million.
• The related floating LNG power plant market is estimated at USD 628.56 million in 2025 and projected at USD 766.95 million in 2030.
• The wider power ships market is projected to grow at a 4.3% CAGR through 2034.
• The wider floating power plant market is forecast to grow at a 10.2% CAGR, faster than the dedicated LNG power vessel forecast.
• Applying the 2024 Asia Pacific share to the 2032 forecast gives an implied APAC value of about USD 536.56 million.
| Market indicator | Benchmark | Why it matters |
|---|---|---|
| Current dedicated market value | USD 1,008.58 million in 2024 | Defines the direct commercial base. |
| 2025 estimate | USD 1,043.83 million | Tracks near-term market continuity. |
| 2032 forecast | USD 1,392.93 million | Outlines the expected expansion path. |
| Forecast CAGR | 4.21% from 2025 to 2032 | Signals steady rather than explosive growth. |
| Asia Pacific share | 38.52% in 2024 | Highlights island, coastal, and import-led demand. |
| Adjacent power ships market | USD 3.79 billion in 2025 | Places LNG vessels inside the wider floating-power ecosystem. |
Fleet Capacity, Power ship Deployment, and Floating Infrastructure
Fleet capacity is the practical side of the market. Market value shows commercial scale, but fleet MW shows whether a floating power operator can actually support countries that need capacity. The largest fleets create optionality because vessels can be moved, redeployed, or paired with fuel infrastructure. However, fleet scale alone does not guarantee project success. Every deployment still needs a buyer, fuel, port access, grid connection, and approvals.
Fleet and deployment benchmarks
• Keepership reports a global fleet exceeding 8,000 MW of installed floating power capacity.
•Keepership targets 21,000 MW of fleet capacity as it expands its platform.
• The 21,000 MW target is about 2.6 times the current 8,000+ MW fleet base.
•Keepership would need roughly 13,000 MW of additional capacity to move from 8,000 MW to 21,000 MW.
• Reuters reported that Keepership produces electricity for at least 12 countries in Africa and South America.
• Reuters reported that Keepership ‘s largest ships can produce 470 MW.
• Senegal’s installed power ship capacity equals about 4.19% of Keepership ‘s 8,000+ MW fleet base.
• Brazil’s LNG-to-power project capacity equals about 7.00% of Keepership ‘s 8,000+ MW fleet base.
• Ghana’s Osman Khan operating capacity equals about 5.62% of Keepership ‘s 8,000+ MW fleet base.
• Indonesia’s Onur Sultan operating capacity equals about 5.88% of Keepership ‘s 8,000+ MW fleet base.
• South Africa’s selected Keepership supply capacity equals about 15.25% of Keepership ‘s 8,000+ MW fleet base.
• A 470 MW unit would represent more than 10% of Syria’s estimated installed power capacity, showing how one vessel can be nationally significant in smaller systems.
| Deployment factor | What to measure | Market implication |
|---|---|---|
| Vessel capacity | MW per vessel, vessel count, fleet MW | Shows whether supply can support a city, island grid, or shortage. |
| Fuel type | LNG, gas, diesel, HFO, or dual fuel | Shapes cost, emissions, and policy fit. |
| Contract model | Lease, PPA, emergency supply, or state-backed deal | Affects affordability and revenue visibility. |
| Deployment time | Months versus years | Creates value when shortages are urgent. |
| Port access | Berth, safety zone, LNG handling, marine operations | Determines whether the vessel can operate. |
| Grid connection | Substation and nearby transmission capacity | Determines whether power can reach demand. |
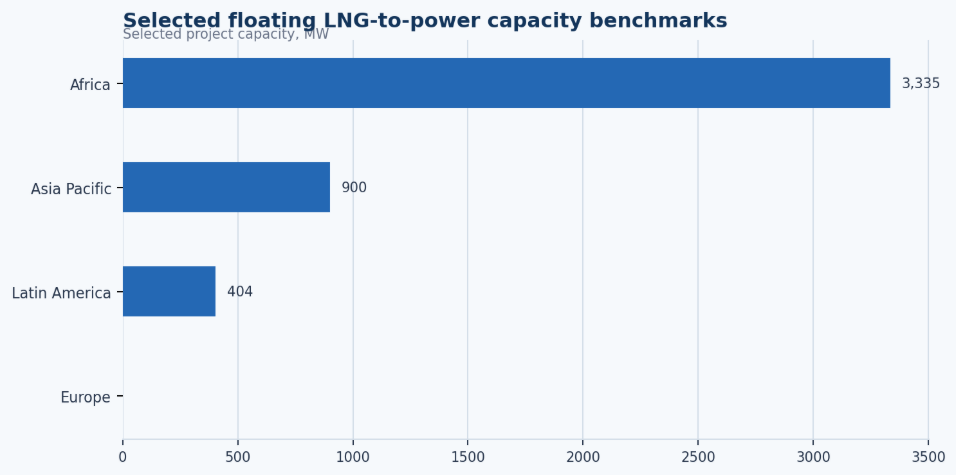
Figure 2. Floating power-vessel capacity should be analyzed by fleet MW, deployment country, and fuel type because not every floating power project is LNG-based.
LNG Supply Chain: The Fuel Side of Floating Power
Floating LNG power vessels are power assets, but the fuel chain decides whether they can operate reliably. A project that looks attractive on a capacity chart can fail commercially if LNG procurement is too volatile, port infrastructure is weak, or the power buyer cannot absorb fuel-cost swings. This is why LNG trade, FSRU capacity, and regional import infrastructure belong in the same article as floating power vessels.
LNG supply and import benchmarks
• Global LNG trade grew to 411.24 MT in 2024.
• GIIGNL reported 428 MT of LNG imports in 2025.
• The increase from 411.24 MT in 2024 to 428 MT in 2025 equals roughly 4.1%.
• The LNG market connected 22 exporting markets in 2024.
• The LNG market connected 48 importing markets in 2024.
• GIIGNL reported that 35% of 2025 LNG imports were on a spot basis.
• The 35% spot share implies about 149.8 MT of spot LNG imports in 2025.
• The 65% non-spot share implies about 278.2 MT was under non-spot arrangements.
• GIIGNL’s 2026 Annual Report highlights 524 MTPA as a key LNG capacity figure.
• Technavio valued the FSRU market at USD 2,180.7 million in 2025.
• Technavio reports the FSRU market growing at a 9.1% CAGR during the forecast period.
• Research Nester estimates the FSRU market at more than USD 8.63 billion in 2025 and projects USD 17.14 billion by 2035.
• Research Nester expects the FSRU market to grow at over 7.1% CAGR from 2025 to 2035.
| LNG supply factor | Why it matters for power vessels |
|---|---|
| LNG import capacity | Determines whether fuel supply is reliable. |
| FSRU availability | Can shorten the path from LNG cargo to gas supply. |
| Spot LNG price | Affects power cost and tariff pressure. |
| Long-term LNG contracts | Reduce price risk and improve bankability. |
| Port storage and handling | Supports safe and consistent LNG operations. |
| Grid connection near port | Allows vessel-based power to move into the system. |
Regional Floating LNG Power Vessel Intelligence
Regional data is one of the highest-value parts of a floating LNG power vessel market article. Global market size can show direction, but it does not explain where the vessel model is practical. The opportunity is strongest when LNG access, port infrastructure, grid need, power shortages, and buyer urgency overlap. Regional averages can hide major differences between Asia-Pacific island systems, European regasification infrastructure, African power deficits, and Latin American hydropower backup needs.
Asia-Pacific
• Asia Pacific held 38.52% of the floating LNG power vessel market in 2024.
• Applying the 2024 Asia Pacific share to the 2025 forecast gives an implied APAC market value of USD 402.08 million.
• Applying the same share to the 2032 forecast gives an implied APAC market value of USD 536.56 million.
• Asia Pacific remained the largest exporting LNG region with 138.91 MT in 2024.
• Asia Pacific LNG exports added 4.10 MT over 2023.
• Asia’s natural gas demand grew by 5.5% in 2024 and was forecast to grow by just over 2% in 2025.
• Indonesia’s Onur Sultan power ship is listed as an operating 470 MW+ power station in Begawan, North Sumatra.
• Indonesia’s Zeynep Sultan power ship is listed as an operating 125 MW+ power station in Amurang, North Sulawesi.
• The two listed Indonesia power ship assets total at least 595 MW.
Asia-Pacific is the clearest regional fit because it combines LNG trade scale, island and archipelago demand, coastal load centers, and strong gas-market growth. Indonesia shows the geographic logic: large electricity demand is spread across islands, and port-based power can help where transmission expansion is slow. Pakistan, Bangladesh, the Philippines, and other LNG-importing or island-linked markets require the same type of screening: not only demand, but LNG supply reliability and grid delivery.
Europe
• Europe increased LNG import capacity by almost one-third between 2021 and 2025.
• Europe’s LNG regasification capacity increased by 13% in 2023 and 8% in 2024.
• Two new LNG import terminals started operating in Europe in 2025.
• Three existing LNG terminals were expanded in Europe in 2025.
• Listed new terminals and expansions in Europe added 12.4 bcm/year in 2025.
• The EU imported over 100 bcm of LNG in 2024.
• Germany’s Wilhelmshaven 2 terminal added 1.9 bcm/year of capacity in 2025.
• Italy’s Ravenna FSRU added 5.0 bcm/year in 2025.
• Greece’s Alexandroupolis FSRU is listed with 5.5 bcm/year of regasification capacity and connects to the gas grid through a 28 km pipeline.
Europe represents a distinct opportunity within the energy market. Rather than being a major source of broad direct power-ship demand, the region is more relevant for LNG infrastructure and energy-security intelligence. Since 2022, European countries have expanded FSRU and regasification capacity to strengthen energy security. This investment has reinforced the wider LNG ecosystem and demonstrated how quickly floating import infrastructure can be deployed when needed. However, it does not mean that every European market is an ideal fit for floating power vessels. In the near term, the region’s importance is more closely tied to gas security, terminal utilization, emergency resilience, and efficient operational planning, much like using a google docs invoice template to simplify routine administrative work.
Africa
• Africa floating and LNG-to-power benchmarks total 3,414 MW across the project set.
• That Africa project benchmark total equals about 42.68% of Keepership ‘s 8,000+ MW fleet.
• Senegal’s installed power ship capacity is reported at 335 MW and supplies 21% of national electricity demand.
• Senegal hosted Africa’s first LNG-to-power project using an FSRU and Keepership Power ship.
• Ghana commissioned a 450 MW gas-fired Power ship Osman Khan at Secondi in 2019.
• POWER Magazine described Ghana’s floating Power ship as a 470 MW vessel.
• Mozambique’s planned LNG-to-power infrastructure investment is reported at USD 1 billion.
• The planned Mozambique project would provide up to 500 MW to the Southern African Power Pool.
• South Africa selected Keepership in March 2021 to supply 1,220 MW through three proposed floating natural gas power stations.
Africa is one of the strongest opportunity regions because the floating model directly addresses power deficits, coastal demand, industrial loads, and time-sensitive procurement. Senegal and Ghana show operating examples. Mozambique shows how LNG resources and regional power needs can connect. South Africa shows the scale of potential demand, but also the importance of cost, approvals, and long-term public acceptance.
Latin America and the Caribbean
• Latin America floating and LNG-to-power benchmarks total 810 MW across the project set.
• That Latin America benchmark total equals about 10.12% of Keepership ‘s 8,000+ MW fleet.
•Keepership signed its Brazil LNG-to-power contract in November 2021.
• The Brazil LNG-to-power project has been operational in Sepetiba Bay since 2022.
• Brazil’s project operates with four Power ships and one FSRU.
•Keepership ‘s Brazil project generates 560 MW of electricity.
• Brazil’s 560 MW across four Power ships implies an average of 140 MW per Power ship.
•Keepership will deploy a 250 MW Power ship in Mexico’s Yucatan Peninsula with an LNG terminal ship.
• The Mexico Yucatan LNG-to-power project is structured as a three-year project.
Latin America and the Caribbean are important because flexible gas-fired power can support hydropower variability, island grids, coastal demand, and fuel switching away from oil products. Brazil shows how LNG-to-power can support a large grid, while Mexico’s Yucatan project shows the smaller, targeted use case: power in a specific constrained region with a defined contract period.
| Region | Market opportunity | Key markets | Main driver |
|---|---|---|---|
| Asia-Pacific | High | Indonesia, Pakistan, Bangladesh, Philippines, Malaysia | Island grids, LNG demand, and coastal load. |
| Europe | Medium | Germany, Italy, Greece, Belgium, Croatia | Energy security, FSRUs, and import infrastructure. |
| Africa | High | Senegal, Ghana, Mozambique, South Africa | Power deficits and fast-deployment need. |
| Latin America/Caribbean | Medium-high | Brazil, Mexico, Dominican Republic, island states | Flexible capacity and diesel displacement. |
| Middle East | Selective | Syria and selected emergency markets | Industrial or emergency supply where fixed assets are constrained. |
Country-Level Floating LNG Power Vessel Statistics
Country data matters because floating LNG power vessels are not adopted evenly. A country may have strong electricity demand but weak port access, or strong LNG infrastructure but limited need for mobile generation. The strongest country profiles combine power shortage, coastal access, LNG supply options, grid connection, and a buyer that can move quickly.
Country-level deployment and demand benchmarks
•Keepership signed a 235 MW Senegal Power ship contract with SENELEC in August 2019.
• Operations in Dakar began in October 2019, two months after the August 2019 contract signing.
•Keepership signed an additional 100 MW Senegal contract in December 2021.
•Keepership reports 335 MW of installed capacity in Senegal.
•Keepership says its 335 MW Senegal capacity supplies 21% of national electricity demand.
• Global Energy Monitor links the Karmol Dakar FSRU to a 236 MW Keepership power plant.
• The Karmol Dakar FSRU has a base import capacity of 15 MMcf/d, or 0.11 mtpa.
• The same Dakar FSRU can potentially expand to 300 MMcf/d, equal to 2.28 mtpa.
• The Dakar expansion case is 20 times the 15 MMcf/d base capacity.
• Ghana’s Osman Khan power ship is listed as an operating power station of at least 450 MW.
• Ghana’s floating power ship shifted from heavy fuel oil to mainly natural gas supply from Sankofa.
• Mozambique signed a 48 MW Power ship contract with EdM in March 2018.
•Keepership reports continuing Mozambique operations with 35 MW, supplying 3% of national electricity demand.
• A 35 MW supply equal to 3% implies a national demand-equivalent base of about 1,166.7 MW.
• Mozambique’s planned LNG-to-power project would provide up to 500 MW to the Southern African Power Pool.
• South Africa selected Keepership to supply 1,220 MW through three proposed floating natural gas power stations.
• The three proposed South Africa projects were estimated to cost USD 15.4 billion over two decades.
• The 1,220 MW proposed South Africa capacity averaged about 406.7 MW across three floating power stations.
The country benchmark set is led by South Africa at 1,220 MW, Ghana at 920 MW, Mozambique at 703 MW, Indonesia at 595 MW, Senegal at 571 MW, Brazil at 560 MW, and Mexico at 250 MW. This reads cleaner as a compact country-capacity readout than as repeated workbook bullets.
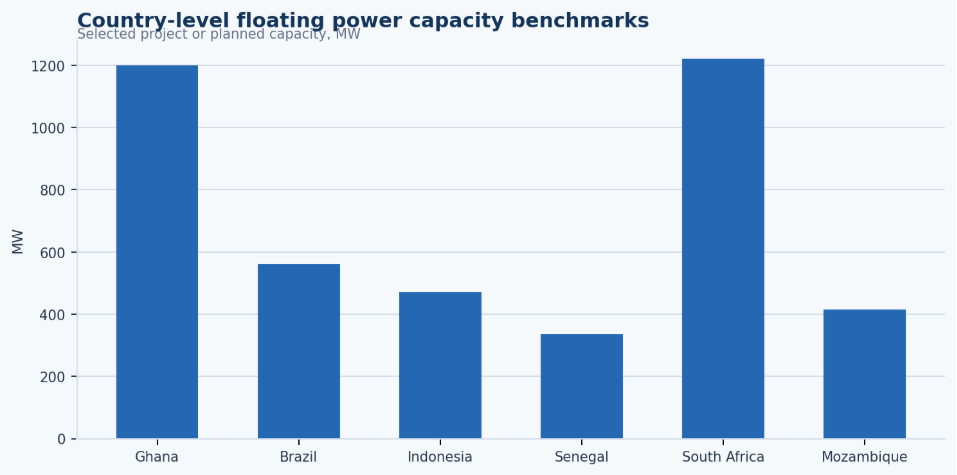
Figure 3. Country-level opportunity should be reviewed by MW capacity, fuel chain, port readiness, and grid need rather than by market size alone.
| Country | Relevant statistic | Market meaning |
|---|---|---|
| Senegal | 335 MW supplies 21% of national electricity demand. | Shows how one floating program can be nationally important. |
| Ghana | Osman Khan power ship listed at 450 MW+ and later 470 MW. | Shows African adoption and fuel switching. |
| Mozambique | LNG-to-power investment reported at USD 1 billion with up to 500 MW. | Links LNG infrastructure with regional power supply. |
| South Africa | Selected Karpowership capacity totals 1,220 MW across three stations. | Shows scale, while approvals and cost remain critical. |
| Brazil | 560 MW LNG-to-power project uses four Power ships and one FSRU. | Shows integrated LNG-to-power at grid scale. |
| Mexico | Yucatan pairs a 250 MW Power ship with an LNG terminal ship. | Shows targeted regional-capacity support. |
| Indonesia | Two listed power ship assets total at least 595 MW. | Shows archipelago and island-grid relevance. |
Floating LNG Power Vessels vs Land-Based Power Plants
Floating LNG power vessels are best understood as flexible infrastructure. They are not replacements for every land-based plant, and they are not always cheaper over a long operating life. Their advantage is speed, reloadability, lower land requirement, and the ability to add capacity while permanent infrastructure catches up. Their weakness is dependence on LNG logistics, port access, contract economics, and grid connection near the coast.
| Factor | Floating LNG power vessel | Land-based power plant |
|---|---|---|
| Deployment speed | Faster when port and grid access are ready. | Slower because land, permits, and civil works take time. |
| Land requirement | Low footprint because generation sits on water. | Higher land and support-infrastructure requirement. |
| Flexibility | Relocatable or contract-based. | Fixed asset for long-term local operation. |
| Fuel requirement | Needs LNG cargoes, regasification, and marine logistics. | May use pipeline gas, LNG, local gas, oil, coal, or hybrids. |
| Financing model | Lease, PPA, emergency supply, or state-backed contract. | Usually more CAPEX-heavy and site-specific. |
| Best use case | Urgent capacity, island grids, diesel replacement, or temporary gaps. | Long-term baseload or permanent capacity planning. |
| Main weakness | Fuel and port dependency can become the bottleneck. | Construction and permitting can delay supply. |
Application Segments: Where Demand Comes From
Floating LNG power vessel demand is not one application. It can come from emergency power, island grids, industrial zones, grid shortages, hydropower backup, mining and port demand, or replacement of older oil-fired generation. That is why the market needs application-specific statistics and not just global market size.
Application-demand benchmarks
• Senegal’s 335 MW installed power ship capacity supplies 21% of national electricity demand, showing the national-grid support application.
• Brazil’s LNG-to-power project generates 560 MW, showing the large-grid flexible generation application.
• Mexico’s Yucatan project is structured as a three-year LNG-to-power solution, showing temporary regional supply logic.
• Mozambique’s planned project would provide up to 500 MW to the Southern African Power Pool, showing regional power-pool relevance.
• South Africa’s selected 1,220 MW plan shows how floating capacity can be proposed at utility procurement scale.
• Indonesia’s two listed power ship assets total at least 595 MW, showing island and archipelago relevance.
• Ghana’s power ship shifted from heavy fuel oil to mainly natural gas supply, showing fuel-switching potential.
• The Dakar FSRU expansion case from 15 MMcf/d to 300 MMcf/d shows how LNG supply capacity can scale with demand.
•Keepership ‘s largest 470 MW ships show that one vessel can serve as a major local-capacity asset, not only a small emergency generator.
| Application | Typical need | Why floating LNG power vessels fit |
|---|---|---|
| Emergency power | Fast capacity after shortage, crisis, drought, or project delay. | Can add dispatchable power faster than many fixed assets. |
| Island grids | Limited land, dispersed demand, imported-fuel dependence. | Reduces land burden and supports coastal demand. |
| Industrial zones | Reliable large-load supply near ports, mines, or factories. | Can sit close to concentrated demand. |
| Hydropower backup | Seasonal drought or hydrology risk. | Adds dispatchable capacity when water output falls. |
| Diesel/HFO replacement | High fuel cost and local oil-fired generation. | Gas-fired output can reduce local pollutants. |
| Grid stabilization | Reserve-margin pressure and peak demand. | Adds flexible capacity while permanent projects are built. |
Market Drivers
The market is driven by urgency, but urgency alone is not enough. A country must also have a feasible route for LNG procurement, marine infrastructure, grid connection, and tariff recovery. The most important drivers are therefore linked: electricity demand growth creates need; LNG and FSRU infrastructure creates fuel access; vessel fleets create supply; and grid pressure creates the business case.
Demand-driver benchmarks
• Global gas demand reached a new all-time high in 2024.
• Asia’s gas demand grew by 5.5% in 2024.
• Global LNG trade reached 411.24 MT in 2024 and GIIGNL reported 428 MT of LNG imports in 2025.
• Europe increased LNG import capacity by almost one-third between 2021 and 2025, showing how quickly LNG infrastructure priorities can shift.
• Listed new and expanded European LNG terminals added 12.4 bcm/year in 2025.
• Technavio valued the FSRU market at USD 2,180.7 million in 2025 and identified a 9.1% CAGR forecast.
• Research Nester projects the FSRU market to reach USD 17.14 billion by 2035.
•Keepership reports more than 8,000 MW of fleet capacity and a 21,000 MW target.
• The listed Africa floating/LNG-to-power benchmarks total 3,414 MW, indicating major demand in power-short regions.
• Brazil’s 560 MW LNG-to-power project and Mexico’s 250 MW planned project show Latin American demand for flexible coastal capacity.
Market Restraints and Risks
A balanced article must show that floating LNG power vessels are not risk-free. The market can be constrained by LNG price volatility, weak off taker credit, currency exposure, permitting, emissions rules, methane concerns, port safety, and grid bottlenecks. Some projects face public or regulatory pushback when long-term costs are unclear. Others may struggle if LNG supply is not contracted or if the grid cannot absorb the available output.
Risk benchmarks and warning signals
• GIIGNL reported that 35% of 2025 LNG imports were on a spot basis, which shows the potential exposure to cargo-market volatility.
• The spot-share estimate implies about 149.8 MT of spot LNG imports in 2025.
• South Africa’s three proposed Keepership projects were estimated at USD 15.4 billion over two decades.
• The South Africa cost estimate implies about USD 12.62 million per MW over the contract period.
• Germany’s Muk ran terminal benchmark shows 5% Q1 utilization compared with 83% at Brunsbüttel, proving that terminal capacity does not always equal high use.
• Mutran’s 1.3 bcm 2024 gas feed-in equaled about 9.6% of its planned 13.5 bcm full capacity by 2027.
• Mozambique’s current 35 MW supply equals only 3% of national electricity demand, showing how small projects may help but not solve system-wide shortage.
• The Dakar FSRU’s base 15 MMcf/d capacity is small compared with its potential 300 MMcf/d expansion case, showing how supply-side scaling can become a project question.
| Risk | What it affects | Why it matters |
|---|---|---|
| LNG price volatility | Power cost and tariff affordability | High fuel prices can make output expensive. |
| Port limitations | Project feasibility and safety approvals | Vessels need berthing, security, and LNG handling. |
| Grid weakness | Power delivery | Capacity has limited value without transmission. |
| Contract affordability | Buyer and government risk | Long contracts can create fiscal pressure. |
| Utilization risk | Terminal or vessel economics | Low use can weaken project value. |
| Emissions policy | Long-term acceptance | Gas faces scrutiny as cleaner power plans expand. |
| Fuel supply security | Operational reliability | LNG cargo availability affects dispatch. |
Europe FSRU and LNG Infrastructure Lessons
Europe is useful for this article because it shows how floating LNG infrastructure can move quickly when energy security becomes urgent. FSRUs and terminal expansions are not the same as floating LNG power vessels, but they shape the broader LNG ecosystem that power vessels depend on. The European data also shows a caution: infrastructure must be measured by utilization and system need, not only by nameplate capacity.
Europe infrastructure benchmarks
• Wilhelmshaven 2 is listed with 1.9 bcm/year of LNG regasification/import capacity.
• Ravenna is listed with 5.0 bcm/year of LNG regasification/import capacity.
• Zeebrugge expansion is listed with 1.8 bcm/year of LNG regasification/import capacity.
• Krk expansion is listed with 3.2 bcm/year of LNG regasification/import capacity.
• Adriatic expansion is listed with 0.5 bcm/year of LNG regasification/import capacity.
• Alexandroupolis FSRU is listed with 5.5 bcm/year of regasification/import capacity.
• Alexandroupolis is designed to deliver LNG to eight countries.
• Fourteen Greek and foreign companies booked capacity at Alexandroupolis until at least 2030.
• Germany LNG terminal benchmarks show Muk ran Q1 utilization at 5%, Wilhelmshaven at 49%, and Brunsbüttel at 83%.
• Brunsbüttel’s 83% utilization was 78 percentage points higher than Murkin’s 5% Q1 utilization.
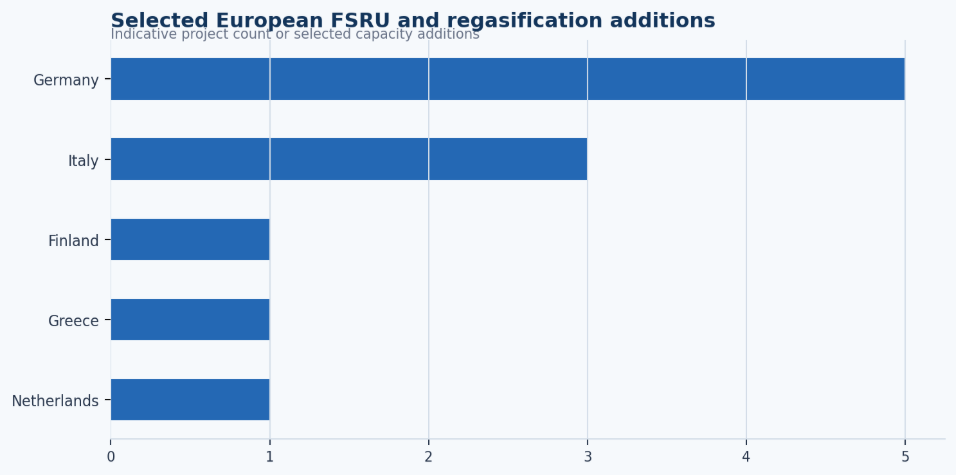
Figure 4. Europe’s FSRU and regasification additions show how floating LNG infrastructure can support energy security, but utilization still determines practical value.
Competitive Landscape and Key Market Participants
The competitive landscape is broader than one vessel owner. Floating LNG power projects require vessel operators, LNG suppliers, FSRU owners, utilities, governments, shipyards, equipment suppliers, marine contractors, port authorities, and financiers. Keepership is the most visible operator in the available statistics, but the broader market includes the companies that provide LNG, regasification, turbines or engines, grid connection, and offtake agreements.
| Player type | Role in the market |
|---|---|
| Floating power operators | Own, convert, lease, and operate power ships or floating generation vessels. |
| LNG suppliers | Provide cargoes, contracts, fuel-risk management, and project support. |
| FSRU owners | Enable LNG import and regasification where fixed terminals are delayed. |
| Utilities and grid operators | Buy the power, dispatch capacity, and manage grid integration. |
| Governments and regulators | Approve procurement, tariffs, safety permits, and environmental terms. |
| Shipyards and marine contractors | Build, convert, maintain, and mobilize floating infrastructure. |
| Equipment suppliers | Provide engines, turbines, transformers, controls, and electrical systems. |
| Financiers and insurers | Assess off taker credit, fuel exposure, vessel risk, and contract duration. |
Floating LNG Power Vessel Opportunity Diagnostic
A useful statistics article should help a team decide where to look next. The most practical method is to treat floating LNG power vessels as both a power solution and an LNG logistics project. A country with outages but no LNG access may not be ready. A country with LNG access but no urgent power need may not justify a vessel. The diagnostic model below connects the statistics to the screening questions that matter.
| Opportunity area | Core signals to measure | Why it matters |
|---|---|---|
| Power shortage | Outages, peak demand, reserve margin, unmet demand | Confirms whether fast capacity is needed. |
| LNG access | Import terminals, FSRUs, supply contracts, spot exposure | Confirms whether fuel can reach the vessel. |
| Port readiness | Berth depth, safety zone, marine permits, LNG handling | Tests whether deployment is physically feasible. |
| Grid connection | Nearby substations, transmission capacity, congestion | Confirms whether output can be delivered. |
| Fuel switching | Diesel/HFO share, gas access, fuel-cost pressure | Highlights cost and emissions upside. |
| Contract viability | PPA price, off taker strength, currency exposure, state support | Tests whether the structure is durable. |
| Emergency need | Drought, crisis, project delay, industrial demand shock | Indicates whether speed has enough value. |
90-Day Floating LNG Power Vessel Market Assessment Plan
Statistics become useful when they are translated into a market-screening plan. A 90-day assessment can help investors, utilities, energy ministries, and developers decide whether a target market deserves deeper feasibility work. The first month should map urgency. The second month should test feasibility. The third month should pressure-test economics and risk.
| Timing | What to do | Output |
|---|---|---|
| Days 1-30 | Map shortages, outages, port access, grid gaps, LNG options, and generation mix. | Country opportunity baseline. |
| Days 31-60 | Compare vessel MW, LNG cost, FSRU options, grid links, contracts, and emissions limits. | Feasible market shortlist. |
| Days 61-90 | Test economics, policy risk, off taker strength, currency exposure, fuel security, and acceptance. | Investment-ready scorecard. |
Metrics Energy Leaders Should Track
The final scorecard should be detailed enough to locate the opportunity without becoming a vanity dashboard. Market size and CAGR are useful, but they do not explain whether a specific country can host a vessel. A stronger dashboard combines MW capacity, LNG availability, port readiness, grid need, off taker strength, fuel exposure, and emissions constraints.
| Metric | Why it matters |
|---|---|
| Market size | Frames current commercial scale. |
| CAGR | Compares growth with adjacent floating-power markets. |
| Vessel capacity MW | Measures deployable supply and project scale. |
| Fleet availability | Indicates whether capacity can mobilize quickly. |
| LNG import capacity | Confirms fuel readiness. |
| FSRU availability | Signals faster LNG access than fixed terminals. |
| Power deficit | Defines urgency. |
| Reserve margin | Measures grid reliability pressure. |
| Diesel/HFO generation share | Highlights fuel-switching potential. |
| PPA price | Tests affordability and buyer risk. |
| Spot LNG exposure | Tracks operating-cost volatility. |
| Port readiness | Checks physical deployment feasibility. |
| Grid interconnection capacity | Confirms whether output can be delivered. |
| Contract duration | Indicates revenue visibility and political exposure. |
| Utilization rate | Reveals whether capacity is actually used. |
| Emissions intensity | Measures transition-policy risk. |
Floating LNG Power Vessel Market Statistics FAQ
What is a floating LNG power vessel?
A floating LNG power vessel is a vessel-based or barge-based power generation asset that uses LNG or gas-linked infrastructure to generate electricity near a port, island grid, coastal demand center, industrial zone, or emergency supply area.
Why are floating LNG power vessels important?
They are important because many countries need dispatchable electricity faster than fixed power plants and fixed LNG infrastructure can be developed. The model is most useful where power shortages, LNG access, port readiness, and grid connection can be aligned.
How large is the floating LNG power vessel market?
The global floating LNG power vessel market was valued at USD 1,008.58 million in 2024, estimated at USD 1,043.83 million in 2025, and projected to reach USD 1,392.93 million by 2032.
Which region has the strongest market position?
Asia Pacific held 38.52% of the market in 2024. The region benefits from LNG trade scale, coastal demand, archipelago power needs, and gas demand growth.
How are floating LNG power vessels different from FSRUs?
An FSRU imports, stores, and regasifies LNG. A floating LNG power vessel generates electricity. Some LNG-to-power projects combine both assets, as seen in configurations that pair an FSRU with a Powership.
What are the main market drivers?
The main drivers are power shortages, fast-deployment demand, LNG trade growth, FSRU expansion, diesel or HFO replacement, island grids, industrial power demand, and energy-security planning.
What are the biggest risks?
The biggest risks are LNG price volatility, weak port readiness, grid interconnection limits, contract affordability, offtaker credit, emissions policy, public approval, and fuel supply security.
What metrics matter most?
The most useful metrics are market size, CAGR, fleet MW, vessel capacity, LNG import capacity, FSRU access, reserve margin, power deficit, PPA affordability, spot LNG exposure, port readiness, grid deliverability, and utilization.
Final Takeaway
Floating LNG power vessel statistics point to one conclusion: this market is growing because many energy systems need flexible power faster than permanent infrastructure can be delivered. The direct market is not enormous compared with the wider floating power sector, but it is strategically important because it connects LNG supply, floating generation, emergency procurement, island grids, and coastal industrial demand. That combination gives the model a clear role in countries where waiting for land-based generation would create economic, social, or reliability costs.
The most useful way to read the numbers is not to focus only on CAGR. A 4.21% forecast CAGR shows moderate growth, but the more important evidence is operational: more than 8,000 MW of reported Keepership floating capacity, a 21,000 MW fleet target, 411.24 MT of global LNG trade in 2024, 428 MT of LNG imports in 2025, and country examples such as Senegal, Ghana, Brazil, Mozambique, Indonesia, Mexico, and South Africa. These numbers show that the market is already linked to real power systems, not just future concepts.
For investors, utilities, and policymakers, the strongest floating LNG power vessel markets are not only the countries with the highest electricity demand. They are the countries where urgent power demand, LNG supply, port readiness, grid connection, contract economics, and buyer credit quality all support the same decision. A vessel can move, but the fuel chain, port, off taker, tariff, and transmission system are local. That is why the best market analysis should measure opportunity by country, region, and project readiness rather than by global market size alone.
The practical next step is a disciplined market screen. Identify countries with high power urgency, compare their LNG and FSRU options, test port and grid readiness, review tariff affordability, and separate short-term emergency need from long-term energy strategy. Floating LNG power vessels can be valuable where time matters, but the best projects are the ones where flexible capacity solves a real system constraint without creating an unmanaged fuel, cost, or policy risk.


