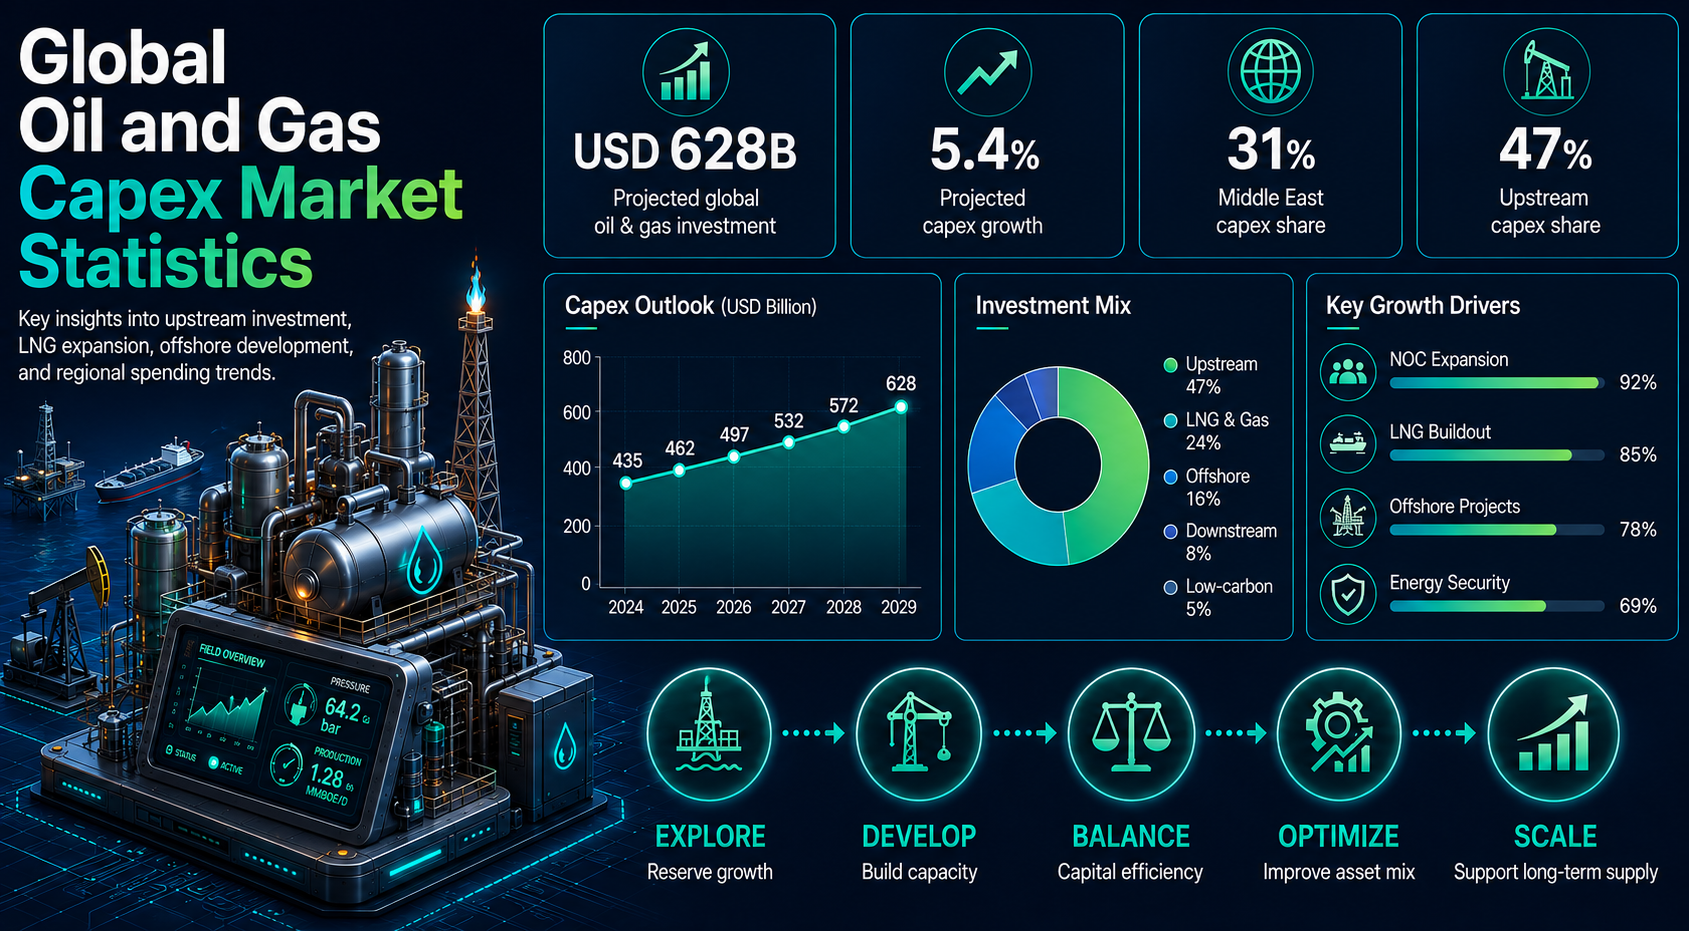
Global oil and gas capex is where energy security, field decline, LNG expansion, offshore development, refining upgrades, national production targets, shareholder discipline, and emissions pressure meet. The customer-facing version of energy investment may look like gasoline, diesel, jet fuel, LNG cargoes, petrochemical feedstock, heating fuel, or industrial gas supply, but the investment system behind it is capital intensive and slow moving. A drilling budget, an LNG train, a subsea tieback, a refinery upgrade, or a methane-reduction program can influence supply, margins, emissions, and geopolitical exposure for years.
The strongest capex statistics show that the market is not moving in one direction. IEA data in the research sheet places total energy investment at $3.3 trillion in 2025, with $1.1 trillion still allocated to oil, natural gas, and coal, and $716 billion allocated to oil and gas supplies. At the same time, upstream oil investment is expected to fall to around $420 billion, low-emissions investment by oil and gas companies is only $22 billion, and upstream costs are set to climb by about 3%. Those numbers tell a mixed story: investment is still large, but producers are more selective about where and why they spend.
This article is organized for scanning. Each section separates the headline numbers from the market signal behind them, so oil and gas capex can be read by segment, region, country, company type, project cycle, and investment risk. The goal is not to list every available figure. It is to show which statistics help energy, finance, policy, and strategy teams understand where capital is building future supply and where higher budgets may simply reflect inflation, maintenance, or compliance costs.
Executive Capex Benchmarks
These are the statistics that frame the article. They show the scale of energy investment, the share still flowing into fossil fuels, the size of oil and gas supply capex, the pressure on upstream budgets, and the difference between national oil company expansion and listed-company capital discipline.
The numbers that define the oil and gas capex market
• IEA’s 2025 benchmark places total global energy investment at $3.3 trillion, up 2% in real terms versus 2024.
• Clean-energy investment is set at $2.2 trillion in 2025, while oil, natural gas, and coal investment is set at $1.1 trillion.
• Oil and gas supply investment reaches $716 billion in 2025, equal to roughly 21.7% of total global energy investment in the research database.
• Upstream oil and gas investment is listed at $567 billion in 2025, compared with about $570 billion in 2024 and $869 billion in 2015.
• Upstream oil investment alone is expected to fall to around $420 billion in 2025 after a projected 6% decline.
• IEA’s 2024 figures show upstream oil and gas investment rose 9% in 2023 and another 7% in 2024 before the 2025 flattening.
• Annual spending needed to maintain current oil and gas production levels is estimated at about $500 billion, showing how much capex is tied to depletion management rather than only new growth.
• The Middle East is expected to invest $130 billion in oil and gas supply in 2025, equal to 15% of global oil and gas supply investment.
• Saudi Arabia’s upstream oil and gas investment is listed at $40 billion in 2025, while Aramco’s 2025 capital investment guidance ranges from $52 billion to $58 billion.
• Eurasia’s upstream oil and gas investment is listed at $54 billion in 2025, with Russia accounting for about 75% of that regional upstream figure.
• Latin America and the Caribbean fossil fuel investment exceeds $90 billion per year in 2025, with Brazil, Argentina, and Mexico accounting for about 70% of the regional fossil fuel investment base.
• Southeast Asian fossil fuel investment falls from $70 billion in 2015 to $50 billion in 2025, while clean energy investment rises from $30 billion to $47 billion.
• Petrobras’ 2025-2029 business plan allocates $111 billion, including $16.3 billion for low-carbon initiatives and an average annual investment of about $22.2 billion.
• ExxonMobil’s 2025 cash capex guidance midpoint is $28 billion, Chevron’s 2025 consolidated organic capex midpoint is $15 billion, and Shell’s 2026 cash capex outlook midpoint is $21 billion.
• Oil and gas companies’ low-emissions energy investment is listed at $22 billion in 2025, much smaller than global upstream and supply capex, which shows the scale gap between hydrocarbon spending and transition spending.
Why Oil and Gas Capex Still Carries Global Energy Weight
Oil and gas capex still matters because the industry has to spend continuously before it can deliver stable supply. Existing fields decline, new wells require drilling and completion, offshore projects need years of engineering, LNG terminals require long construction cycles, and refineries need regular maintenance and upgrades. Even in a transition scenario, the capital system behind oil and gas remains one of the largest industrial investment systems in the world.
The most useful way to read capex is to ask what the money is doing. A dollar spent on exploration does not have the same meaning as a dollar spent on a workover. A dollar spent on a new LNG train does not have the same timing as a dollar spent on shale completions. A dollar spent on methane monitoring may protect a company’s license to operate but may not add production capacity. That is why the article separates capex into the signals below.
Capex signals worth separating
• Field decline replacement matters because annual maintenance and depletion-offset spending can reach hundreds of billions of dollars.
• Exploration capex shows long-term resource confidence, especially when companies and NOCs are willing to fund seismic, appraisal, and frontier basin activity.
• Development capex converts discovered resources into production through wells, facilities, platforms, subsea systems, and processing capacity.
• LNG capex is a gas-trade signal because liquefaction, regasification, and export terminals shape global supply for decades.
• Refining and petrochemical capex shows where crude is being converted into product-market strategy rather than only upstream output.
• Shale capex is a short-cycle supply signal because drilling and completions can respond faster to prices than offshore or LNG projects.
• Emissions capex covers methane detection, flaring reduction, CCS, electrification, digital monitoring, and efficiency projects.
• National oil company capex often reflects resource control, domestic supply strategy, and government-backed production planning.
| Capex area | What it funds | Market signal |
|---|---|---|
| Exploration | Seismic, appraisal, licensing | Long-term resource confidence |
| Development | Wells, platforms, subsea, processing | Future production capacity |
| LNG | Liquefaction, terminals, export links | Gas trade expansion |
| Refining | Upgrades, maintenance, cleaner fuels | Product demand |
| Pipelines and storage | Transport and balancing | Supply reliability |
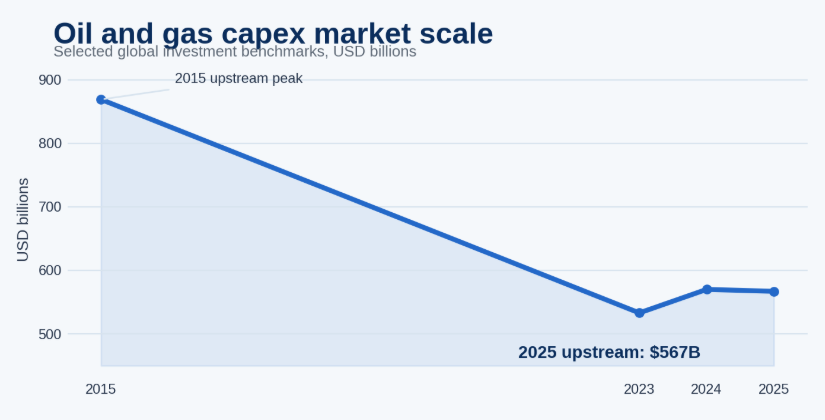
Figure 1. Oil and gas capex should be read as a supply-security, capital-discipline, project-risk, and emissions-management signal rather than one blended spending number.
Global Oil and Gas Capex Market Scale
The global scale of oil and gas capex becomes clearer when it is placed inside the total energy investment picture. The research database shows $3.3 trillion in total energy investment in 2025, $2.2 trillion in clean-energy investment, and $1.1 trillion in fossil fuel investment. Oil and gas supply investment at $716 billion remains a major capital pool even though the energy transition has shifted the largest growth story toward electricity, grids, renewables, storage, and end-use electrification.
A key market-scale statistic is that oil and gas supply investment represents roughly 21.7% of total energy investment in the database. That share is smaller than the clean-energy allocation but still large enough to influence global supply balances, service company activity, national budgets, and energy security. The upstream oil and gas figure of $567 billion also shows that most oil and gas capex remains tied to the production side of the system rather than only downstream processing or trading infrastructure.
Market-size and investment-growth benchmarks
• Total global energy investment is set to reach $3.3 trillion in 2025.
• Clean-energy investment reaches $2.2 trillion, or about 66.7% of total energy investment in the research sheet.
• Oil, natural gas, and coal investment is set at $1.1 trillion, or about 33.3% of total energy investment.
• Oil and gas supply investment is listed at $716 billion, creating a major capital base beneath upstream, midstream, and project-supply decisions.
• Electricity investment exceeds $750 billion, placing oil and gas capex in direct comparison with power-sector capital expansion.
• Upstream oil and gas investment in 2025 is listed at $567 billion, only slightly below the $570 billion 2024 benchmark.
• The same upstream category was about $869 billion in 2015, implying a roughly 35% decline over the 2015-2025 window.
• Upstream oil and gas costs are set to climb by about 3% in 2025, meaning some budget growth may be absorbed by inflation rather than new activity.
Upstream Oil and Gas Capex Statistics
Upstream spending is the core of the oil and gas capex market because it determines whether resources are discovered, developed, produced, maintained, or allowed to decline. The research sheet places global upstream oil and gas investment at $567 billion in 2025, with upstream oil investment expected to fall to around $420 billion. That combination shows a market that remains very large but is not expanding without discipline.
The upstream number should be separated into exploration, development, shale drilling, offshore projects, and maintenance. Exploration and appraisal have long lead times. Development spending converts reserves into output. Shale drilling can affect supply faster. Offshore projects require larger upfront commitments. Maintenance and workover spending protects existing production but may not increase capacity. Treating all of those categories as one upstream number makes the market harder to understand.
Upstream investment benchmarks
• Global upstream oil and gas investment is listed at $567 billion for 2025.
• Upstream oil investment alone is expected to fall to around $420 billion in 2025.
• The expected 6% decline in upstream oil investment suggests more capital discipline after the 2023 and 2024 increases.
• The 2024 upstream oil and gas investment figure was expected to reach $570 billion, up 7% in that year.
• Upstream oil and gas investment was about $869 billion in 2015, far above the 2025 level in the research sheet.
• Annual spending needed to maintain existing production levels is estimated at about $500 billion, emphasizing field-decline pressure.
• If investment halted for one year, the research data shows oil production could lose 5.5 million barrels per day and US shale output could fall 35%.
• Eurasia’s upstream oil and gas investment is listed at $54 billion in 2025, with the region at about 50% of its 2015 upstream level.
• Saudi Arabia’s upstream oil and gas investment is listed at $40 billion in 2025, 15% higher than its 2015 level.
• In Iraq, foreign investment accounts for about 70% of upstream oil and gas investment, while the latest licensing rounds include 30 new oil and gas projects.
| Upstream capex type | Main spending area | Production timeline |
|---|---|---|
| Exploration | Seismic, appraisal, licensing | Long term |
| Development | Wells, platforms, processing | Medium to long term |
| Shale drilling | Rigs, completions, fracking | Short cycle |
| Offshore | FPSOs, subsea systems, platforms | Long cycle |
| Maintenance | Workovers, compression, repairs | Immediate protection |
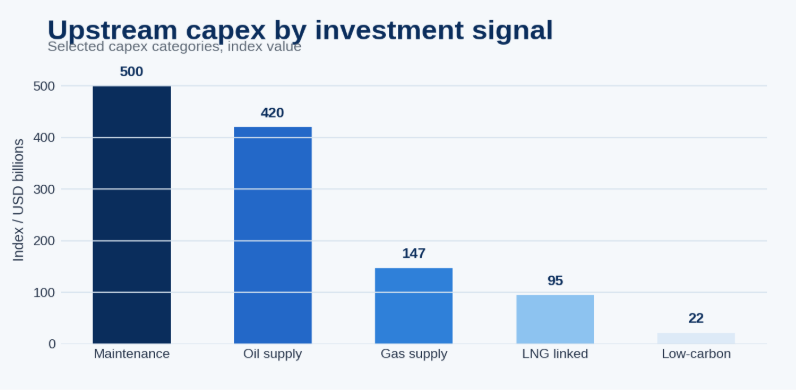
Figure 2. Upstream capex should be split by timing because shale, offshore, exploration, and maintenance spending do not influence supply at the same speed.
National Oil Companies vs International Oil Companies
Ownership is one of the most important differences in global oil and gas capex. The industry is not funded by one type of investor. National oil companies can spend through national production targets and resource-security plans. International oil companies screen projects through returns, emissions, portfolio fit, and shareholder expectations. Independents often respond to basin economics and commodity prices. Service companies benefit from drilling, offshore, LNG, and maintenance activity, but they also absorb cost cycles.
The Middle East data illustrates the role of state-backed investment. Saudi Arabia and Kuwait show 100% in-country NOC investment shares for upstream oil and gas in the research sheet, while foreign-source investment is around 40% in the UAE and Oman. Iraq is different, with foreign investment around 70%, showing how country ownership structures can vary even within the same region. These differences matter because NOC-led spending may continue through national plans even when listed producers remain more disciplined.
Ownership and capital-allocation benchmarks
• The Middle East holds about 30% of global oil production and 17% of global natural gas production in the research sheet.
• The Middle East’s oil and gas supply investment reaches $130 billion in 2025.
• Saudi Arabia and Kuwait have 100% in-country NOC investment shares in upstream oil and gas.
• Foreign investment accounts for about 70% of Iraq’s upstream oil and gas investment.
• The UAE and Oman each show a 40% foreign-source investment share for upstream oil and gas.
• Aramco reported $53.3 billion in capital investment in 2024 and $50.4 billion in organic capex.
• Aramco’s 2025 guidance range of $52 billion to $58 billion is larger than many listed-company capex budgets.
• ExxonMobil’s 2025 cash capex guidance midpoint is $28 billion, with a 2026-2030 annual guidance midpoint of $30.5 billion.
• Chevron’s 2025 consolidated organic capex midpoint is $15 billion, while its 2026 total capex guidance midpoint is $18.5 billion.
• Shell’s 2026 cash capex outlook midpoint is $21 billion, and BP’s through-2027 annual capex midpoint is $14 billion.
| Company type | Capex behavior | Strategic signal |
|---|---|---|
| National oil companies | Invest through national production and security plans | Resource control; supply |
| International oil companies | Screen projects by returns, emissions, and cash flow | Portfolio discipline |
| Independents | Follow price cycles and basin economics | Short-cycle specialization |
| Service companies | Benefit from drilling and project activity | Supply-chain signal |
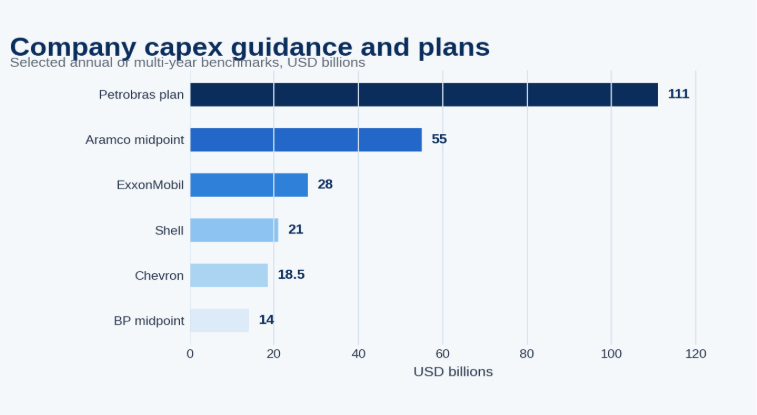
Figure 3. Company capex guidance shows the contrast between state-backed expansion, supermajor discipline, and company-specific portfolio choices.
Regional Oil and Gas Capex Intelligence
Regional capex is where the global number becomes useful. A single global oil and gas capex figure hides very different stories: shale discipline in North America, low-cost NOC expansion in the Middle East, mature offshore resilience in Europe, energy-security and demand-led infrastructure in Asia, execution risk in Africa, and deepwater growth in Latin America. Each region should therefore be read through its own supply, policy, financing, and project-cycle logic.
North America
North America remains a short-cycle and export-infrastructure region. The United States accounts for 20% of global oil and gas output and 25% of total investment in the research sheet. Yet its fossil fuel supply and fossil power share of annual energy investment fell from 60% in 2015 to just under 40% in 2024, showing that oil and gas still matter, but capital competition from electricity, manufacturing, and data-center power demand is rising.
• The United States holds a 20% share of global oil and gas output in the research data.
• The United States accounts for 25% of total investment.
• The fossil fuel supply and fossil power share of US annual energy investment fell by about 20 percentage points from 2015 to 2024.
• Chevron’s 2026 US spend is listed at $10.5 billion, with $6 billion directed to US shale development.
• Phillips 66 plans $2.4 billion in 2026 capital expenditure, with $1.1 billion allocated to midstream and refining.
Middle East
The Middle East is a low-cost resource and NOC-led expansion region. Its $130 billion oil and gas supply investment in 2025 reflects not only upstream spending but also national production strategy, LNG projects, gas development, and downstream integration. Saudi Arabia, Qatar, the UAE, Iraq, Kuwait, and Oman all tell different ownership stories, which is why the region should not be summarized only as a single oil supply hub.
• Middle East oil and gas supply investment reaches $130 billion in 2025.
• The region accounts for 15% of global oil and gas supply investment.
• The Middle East produced about 30% of global oil and 17% of global natural gas in 2024.
• Saudi Arabia’s 2025 upstream oil and gas investment is listed at $40 billion.
• Qatar’s domestic upstream investment ramp-up is listed at 7x over 2015-2025, while foreign investment ramp-up is listed at 4x.
Europe and Eurasia
Europe and Eurasia should be separated because their capital stories are different. Europe’s mature basin and energy-security story differs from Eurasia’s resource concentration and post-2022 investment reset. The research sheet shows Eurasia’s annual energy investment at $143 billion in 2025, down from $190 billion in 2015 but above the $135 billion low point in 2022. Its upstream oil and gas investment is $54 billion, with Russia accounting for about 75% of that total.
• Eurasia’s annual energy investment is $143 billion in 2025.
• The region’s energy investment declined by $55 billion between 2015 and 2022 before rebounding by $8 billion by 2025.
• Eurasia’s upstream oil and gas investment is $54 billion in 2025.
• Russia accounts for about 75% of Eurasia’s upstream oil and gas investment.
• The greenfield share of Eurasian upstream investment fell from 50% in 2015 to less than 20% in 2025.
Asia-Pacific and Southeast Asia
Asia-Pacific is less simple because some countries are major upstream investors, while others are primarily LNG buyers, refining centers, or energy-security planners. China, India, Japan, Korea, Australia, Malaysia, Indonesia, and Southeast Asian markets have different roles. Southeast Asia’s energy demand increased 35% from 2015 to 2025, electricity demand increased 60%, and fossil fuel investment declined from $70 billion to $50 billion while clean energy investment rose from $30 billion to $47 billion.
• Southeast Asian GDP per capita increased 30% between 2015 and 2025.
• Southeast Asian energy demand increased 35%, while electricity demand increased 60%.
• Fossil fuel investment in Southeast Asia fell from $70 billion in 2015 to $50 billion in 2025.
• Clean energy investment in Southeast Asia rose from $30 billion to $47 billion over the same period.
• China’s clean-energy investment exceeds $625 billion in 2024, and its 2025 transmission and distribution investment is listed at $88 billion.
Africa
Africa is an oil and gas opportunity region with a financing and execution problem. The research sheet shows that oil and gas accounted for about 50% of African energy investment over the past decade. At the same time, public and development finance institution funding declined 33%, public and DFI funding was $20 billion in 2024, and around 600 million people still lack electricity access. That means African oil and gas capex must be read beside development finance, access needs, and country risk.
• Oil and gas made up about 50% of African energy investment over the past decade.
• Private-sector clean energy investment in Africa rose from $17 billion in 2019 to almost $40 billion in 2024.
• Public and DFI funding for African energy projects declined 33% over the past decade.
• Algeria plans $60 billion of energy investment for 2025-2029, with 80% allocated to upstream exploration and production.
• Algeria’s implied upstream allocation is $48 billion, while refining and petrochemical allocation is about $12 billion.
Latin America and the Caribbean
Latin America is one of the clearest examples of why country-level capex matters. Regional fossil fuel investment exceeds $90 billion per year, and Brazil, Argentina, and Mexico account for about 70% of that fossil fuel investment. Brazil’s Petrobras plan, Guyana’s offshore exposure through Stabroek, Argentina’s Vaca Muerta, Colombia’s Sirius gas project, and regional grid and transmission investment all create different capex stories within one region.
• Latin America and Caribbean fossil fuel investment exceeds $90 billion per year in 2025.
• Brazil, Argentina, and Mexico account for about 70% of regional fossil fuel investment, equal to roughly $63 billion per year in the derived sheet.
• Petrobras’ 2025-2029 business plan totals $111 billion, with $98 billion in the implementation portfolio.
• Chevron’s proposed Vaca Muerta unconventional oil investment in Argentina is $13.8 billion for 2026.
• Colombia’s Sirius gas project has an estimated investment of $5 billion and expected startup window of 2029-2030.
| Region | Capex theme | Main countries | Strategic implication |
|---|---|---|---|
| North America | Shale discipline, LNG, offshore | US, Canada | Short-cycle supply; exports |
| Middle East | Low-cost expansion | Saudi Arabia, UAE, Qatar, Iraq | Long-term supply lead |
| Europe/Eurasia | Mature basins and resource concentration | Norway, UK, Russia, Kazakhstan | Strategic production with policy and geopolitical risk |
| Asia-Pacific | Gas demand and domestic supply | China, India, Australia, Malaysia | Import security; LNG growth |
| Africa | Offshore, LNG, underdeveloped reserves | Nigeria, Angola, Algeria, Mozambique | High potential; execution risk |
| Latin America | Deepwater and shale growth | Brazil, Guyana, Argentina | Future oil and gas growth |
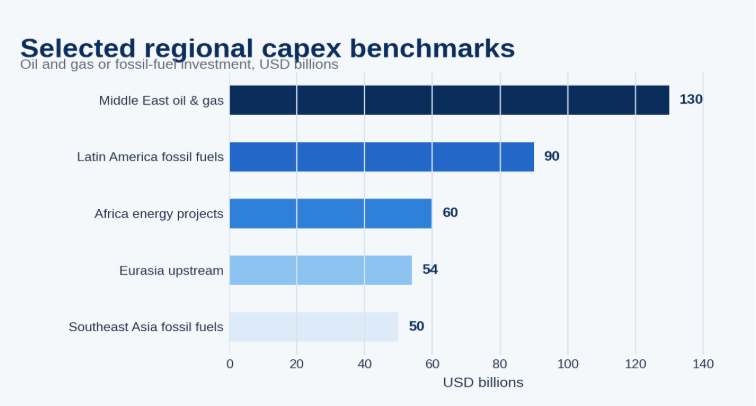
Figure 4. Regional oil and gas capex patterns show why global averages hide very different investment stories across shale, LNG, offshore, refining, and national energy-security programs.
Country-Level Capex Hotspots
Country-level capex makes the article more useful because oil and gas investment does not move evenly. Brazil and Guyana are offshore growth stories. Qatar is an LNG expansion story. The United States is a shale and LNG export story. Norway and the United Kingdom are mature offshore and policy-risk stories. Saudi Arabia and the UAE are low-cost national expansion stories. Algeria is an upstream-and-downstream state investment story. Argentina is a shale opportunity story.
| Country / entity | Useful capex signal | Key statistic from research sheet |
|---|---|---|
| United States | Shale, LNG exports, Gulf of Mexico, public-producer discipline | US share of global oil and gas output: 20% |
| Saudi Arabia | Aramco, low-cost supply, national production planning | Upstream investment: $40 billion in 2025 |
| Qatar | LNG and upstream ramp-up | Domestic upstream investment ramp-up: 7x versus 2015 |
| Iraq | Foreign-led upstream development and licensing | Foreign investment share: 70%; latest rounds: 30 projects |
| Brazil | Petrobras and pre-salt investment | Petrobras 2025-2029 business plan: $111 billion |
| Argentina | Vaca Muerta unconventional oil | Chevron proposed investment: $13.8 billion |
| Colombia | Offshore/gas project development | Sirius gas project estimate: $5 billion |
| Algeria | Energy investment plan with upstream weighting | 2025-2029 energy plan: $60 billion; 80% upstream |
| Eurasia/Russia | Regional upstream concentration | Russia share of Eurasia upstream: 75% |
| China | Domestic energy-security and infrastructure capital | Clean energy investment: more than $625 billion in 2024 |
| India | Refining, gas, grid, import security context | Energy FDI: $5 billion in 2023 |
| Japan and Korea | Import security and low-emissions power investment | Clean-energy share of total investment: 92% |
LNG and Gas Infrastructure Capex
Gas capex is increasingly tied to energy security, LNG trade flexibility, coal-to-gas switching, industrial demand, and import diversification. LNG projects are long-cycle investments, which means decisions made in one investment cycle can shape trade flows and supply options through the 2030s. This makes contract coverage, project cost, permitting, financing, and emissions policy central to the quality of LNG capex.
The Middle East and North America are central to the LNG capex story, but the gas infrastructure theme is broader. Qatar’s upstream ramp-up, US Gulf Coast LNG development, Mozambique LNG security risk, Canada LNG, Australia backfill projects, and Asian demand all make gas investment one of the most regionally connected parts of the oil and gas capex market.
Gas and LNG investment benchmarks
• The Middle East’s 2025 oil and gas supply investment of $130 billion includes the regional capital base that supports gas and LNG expansion.
• Qatar’s domestic upstream investment ramp-up is listed at 7x over 2015-2025, while foreign investment ramp-up is listed at 4x.
• Colombia’s Sirius gas project is estimated at $5 billion, with expected startup in the 2029-2030 window.
• The Sirius gas project has an estimated resource of 6 billion cubic feet and expected marketed gas of 249 million cubic feet per day.
• Algeria’s 2025-2029 plan allocates 80% of $60 billion to upstream exploration and production, supporting gas and oil resource development.
• Japan’s energy self-sufficiency rate is listed at 13%, while Korea’s is 19%, showing why Asian gas security and LNG imports remain important.
• Southeast Asian energy demand increased 35% from 2015 to 2025, while electricity demand increased 60%, supporting long-term gas and power infrastructure planning.
Offshore and Deepwater Capex Statistics
Offshore capex is important because it usually represents long-life supply. Unlike shale wells, offshore developments require larger upfront capital, longer planning cycles, more complex infrastructure, and higher execution risk. When offshore capex rises, the signal is often stronger than a near-term drilling response because the capital is being committed to production systems that can operate for decades.
Latin America is a key offshore growth region. Petrobras’ $111 billion plan, its $98 billion implementation portfolio, Chevron’s acquired 30% stake in the Stabroek Block through the Hess transaction, and Brazil’s pre-salt development all point to deepwater importance. West Africa, the Gulf of Mexico, Norway, and offshore gas projects add to the same theme, even where country-specific figures in the sheet are more limited.
Offshore investment benchmarks
• Petrobras’ 2025-2029 business plan totals $111 billion, with $98 billion in implementation portfolio spending.
• Petrobras’ 2026-2030 business plan is listed at $109 billion, with $91 billion in the implementation portfolio.
• Petrobras’ low-carbon initiatives allocation is $16.3 billion for 2025-2029, equal to about 14.7% of the total plan.
• Brazil’s Espírito Santo plan includes BRL 35 billion in oil and gas projects from 2025-2029 and 76 new wells to be interconnected.
• Chevron’s Hess acquisition value is listed at $55 billion, and the acquired Stabroek Block stake is 30%.
• Chevron’s 2026 offshore ventures spend is listed at $7 billion, while its 2026 upstream capex is $17 billion.
| Offshore capex area | Why spending is rising | Key regions |
|---|---|---|
| FPSOs | Flexible deepwater production systems | Brazil, Guyana, West Africa |
| Subsea systems | Tiebacks and deepwater development | Norway, Gulf of Mexico, Brazil |
| Offshore drilling | Exploration and development wells | Latin America, Africa, US Gulf |
| Platform electrification | Lower operating emissions | Norway, Europe |
| Brownfield tiebacks | Lower-risk additions | Mature offshore basins |
Refining, Petrochemicals, and Downstream Capex
Oil and gas capex should not stop at upstream. Refining, petrochemicals, midstream, and downstream optimization shape how crude and gas become marketable products. The downstream story is especially important in regions where product demand, industrial policy, export competitiveness, and petrochemical integration remain central. Asia and the Middle East are adding or upgrading capacity, while mature markets often face cleaner-fuel rules, asset rationalization, and margin pressure.
Downstream investment benchmarks
• Algeria’s 2025-2029 energy plan allocates 20% of planned spending to refining and petrochemicals, equal to an implied $12 billion.
• Phillips 66 plans $2.4 billion in 2026 capital expenditure, including $1.1 billion allocated to midstream and refining.
• The Phillips 66 midstream and refining allocation equals about 45.8% of its 2026 capex plan.
• Phillips 66 references 100 smaller optimization projects in 2026, showing how downstream capex often appears as many smaller efficiency investments rather than one megaproject.
• TotalEnergies invested $17.1 billion in 2025, with 37% of investment in new oil and gas projects and $3.5 billion in low-carbon energies.
• India’s energy FDI is listed at $5 billion in 2023, and most electricity generation and transmission permits allow 100% FDI, providing context for broader energy infrastructure investment.
Cost Inflation, Project Delays, and Capital Discipline
Oil and gas capex has become harder to interpret because higher spending can come from cost inflation as much as activity growth. The research sheet’s 3% upstream cost increase for 2025 is small compared with total capex, but it matters because upstream budgets are measured in hundreds of billions of dollars. When rig rates, steel, labor, subsea equipment, vessels, financing, local content, and permitting costs rise, the same production program can require more capital.
Capital discipline is the other side of the cost story. Listed companies are not always trying to maximize production growth. They may prioritize free cash flow, debt reduction, dividends, buybacks, reinvestment rate targets, and high-return projects. ExxonMobil’s reinvestment rate target of 40%, down from a previous 50%, is a useful example of how companies can remain large spenders while still signaling discipline.
Capex pressure benchmarks
• Upstream oil and gas costs are set to climb by about 3% in 2025.
• ExxonMobil lists a reinvestment rate target of 40%, down from a previous 50%.
• Chevron’s 2025 capex budget reduction versus the prior year is $2 billion.
• Shell achieved $5.1 billion in structural cost reductions since 2022 and delivered $2 billion in 2025 structural reductions.
• TotalEnergies lists a $7.5 billion capex and opex savings program for 2026-2030 and a $1 billion per year reduction in net capex guidance.
• BP’s through-2027 annual capex range is $13 billion to $15 billion, with $10 billion per year allocated to oil and gas.
| Reason capex rises | What it means | Production impact |
|---|---|---|
| New growth projects | More wells, LNG trains, platforms | Adds future supply |
| Cost inflation | Same activity costs more | Limited direct supply impact |
| Maintenance spending | Protects existing output | Slows decline |
| Emissions compliance | Methane, CCS, electrification | Reduces regulatory risk |
| Project delays | Spending stretches over time | Delays supply impact |
Energy Transition, Emissions, and Low-Carbon Capex
Low-carbon capex inside oil and gas should be analyzed carefully. Some spending reduces emissions from existing hydrocarbon assets, such as methane monitoring, flaring reduction, electrification, and energy efficiency. Other spending builds new businesses such as carbon capture, hydrogen, electricity, or lower-emissions fuels. The distinction matters because emissions-control capex may protect the hydrocarbon portfolio without changing the company’s core business model.
The scale gap is clear in the research sheet. Oil and gas companies’ low-emissions energy investment is listed at $22 billion in 2025, compared with $716 billion in oil and gas supply investment and $567 billion in upstream oil and gas investment. ExxonMobil lists up to $30 billion in lower-emissions opportunities through 2030, Petrobras allocates $16.3 billion to low-carbon initiatives in its 2025-2029 plan, TotalEnergies invests $3.5 billion in low-carbon energies in 2025, and BP’s transition energy capex midpoint is $1.75 billion per year through 2027.
Low-carbon capex benchmarks
• Oil and gas companies’ low-emissions energy investment is listed at $22 billion in 2025.
• Oil and gas companies invested $30 billion in clean energy in 2023 in the research sheet’s IEA-based historical benchmark.
• ExxonMobil lists lower-emissions investment opportunities of up to $30 billion through 2030.
• Petrobras allocates $16.3 billion to low-carbon initiatives for 2025-2029, up 42% versus its previous plan.
• TotalEnergies invested $3.5 billion in low-carbon energies in 2025, equal to about 20.5% of its total investment in the derived sheet.
• Shell allocates 9% of future capex to renewables and energy solutions for 2025-2030.
• BP’s transition energy investment range through 2027 is $1.5 billion to $2 billion per year.
• Algeria targets gas flaring below 1% by 2030 and includes a 520,000-hectare afforestation project area in its broader energy plan context.
| Low-carbon capex type | Oil and gas use case | Business reason |
|---|---|---|
| Methane monitoring | Leak detection and repair | Reduces emissions risk |
| CCS | LNG, gas processing, refining, hydrogen | Supports hard-to-abate assets |
| Electrification | Offshore platforms and facilities | Lowers operational emissions |
| Flaring reduction | Associated gas capture | Efficiency and compliance |
| Digital optimization | Equipment and energy monitoring | Reduces downtime |
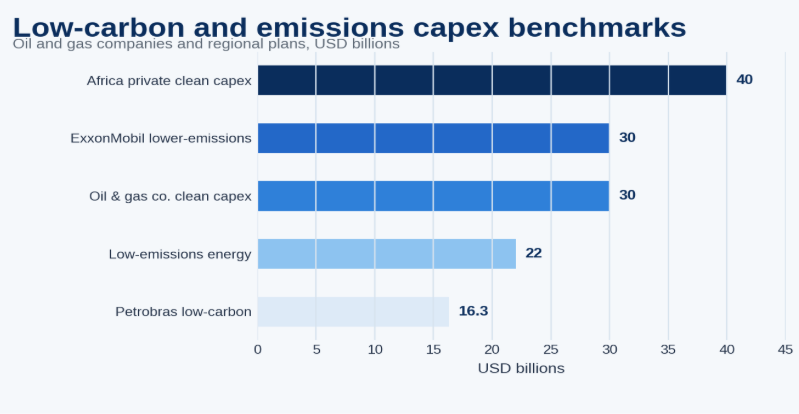
Figure 5. Low-carbon and emissions-linked capex remains much smaller than oil and gas supply spending, so it should be separated by business purpose.
Oil and Gas Capex Risk Diagnostic
A polished capex analysis should end with a diagnostic model because statistics are only useful when they help teams decide what to measure next. Oil and gas capex risk is not only commodity price risk. It includes cost inflation, execution delays, reserve replacement, financing, fiscal policy, emissions pressure, sanctions, local content rules, service-company capacity, and infrastructure bottlenecks.
| Risk area | Core signals to measure | Why it matters |
|---|---|---|
| Commodity price risk | Brent, Henry Hub, LNG prices, crack spreads | Sets project cash flow |
| Cost inflation | Rig rates, labor, steel, vessels, subsea equipment | Separates activity from cost |
| Project execution | Delays, overruns, permitting, procurement | Affects returns and timing |
| Reserve replacement | Discoveries, FIDs, decline rates | Tests future supply support |
| Capital discipline | Free cash flow, debt, dividends, buybacks | Shows investor pressure |
| Emissions risk | Methane, flaring, carbon intensity, CCS | Affects license to operate |
| Regional risk | Fiscal terms, sanctions, security, local content | Shapes investment quality |
90-Day Oil and Gas Capex Benchmark Plan
Statistics become more useful when they are translated into a measurement plan. A practical capex review can be organized into a 90-day cycle that moves from baseline building to interpretation and then to a repeatable scorecard. The purpose is not to chase every number in the market. The purpose is to identify which spending categories explain future production, project risk, regional supply, and capital discipline.
| Timing | What to do | Output |
|---|---|---|
| Days 1-30 | Build the baseline by region, company type, segment, and project stage | Clear global capex map |
| Days 31-60 | Separate growth capex from maintenance, inflation, LNG, offshore, downstream, and emissions spending | Better investment interpretation |
| Days 61-90 | Compare capex with production guidance, FIDs, reserves, free cash flow, and regional risk | Practical capex scorecard |
Metrics Energy Leaders Should Track
The final scorecard should be detailed enough to locate the capex signal without becoming a vanity dashboard. A mature review tracks total capex, but it also separates upstream from downstream, growth from maintenance, short-cycle from long-cycle spending, and traditional oil and gas capex from low-carbon or emissions-control spending.
| Metric | Why it matters |
|---|---|
| Total oil and gas capex | Shows overall investment direction |
| Upstream capex | Indicates future production activity |
| Exploration capex | Shows long-term resource confidence |
| Development capex | Tracks sanctioned project execution |
| Maintenance capex | Protects existing production |
| LNG capex | Shows future gas export capacity |
| Offshore capex | Indicates long-cycle supply growth |
| Shale capex | Shows short-cycle supply response |
| Downstream capex | Tracks refining and product-market investment |
| Low-carbon capex | Shows emissions and transition positioning |
| Capex per barrel | Measures capital efficiency |
| Free cash flow after capex | Shows financial sustainability |
| Reserve replacement ratio | Tests long-term supply health |
| Production growth per capex dollar | Measures investment productivity |
Oil and Gas Capex Statistics FAQ
Common questions
• What is oil and gas capex?
Oil and gas capex is capital expenditure used to explore, develop, maintain, transport, process, and improve oil and gas assets. It includes upstream drilling and production, LNG, pipelines, refining, petrochemicals, asset integrity, and emissions-related investment.
• Why is global oil and gas capex increasing in some categories?
Capex can increase because companies are adding supply, replacing field decline, building LNG and gas infrastructure, upgrading refining assets, meeting national energy-security targets, or paying higher costs for the same activity.
• Which region leads oil and gas capex?
The Middle East is one of the strongest oil and gas capex regions in this sheet, with $130 billion in 2025 oil and gas supply investment and 15% of global oil and gas supply investment.
• What is upstream oil and gas capex?
Upstream capex is spending on exploration, appraisal, drilling, completions, field development, offshore systems, brownfield optimization, and maintenance. The sheet lists global upstream oil and gas investment at $567 billion in 2025.
• How does LNG affect oil and gas capex?
LNG affects capex because liquefaction plants, export terminals, regasification, pipelines, storage, and upstream gas development are large, long-cycle investments. LNG projects can shape gas supply and trade routes through the 2030s.
• Why are national oil companies important?
NOCs are important because they often control resource access and invest through national production or energy-security strategies. Saudi Arabia and Kuwait show 100% in-country NOC investment shares in upstream oil and gas in the research sheet.
• Does higher capex always mean higher production?
No. Higher capex can reflect cost inflation, maintenance, emissions compliance, project delays, or asset integrity work. It should be compared with production guidance, FIDs, reserves, and free cash flow.
• How does offshore capex differ from shale capex?
Shale capex is usually shorter cycle and can influence production faster. Offshore capex is longer cycle, larger upfront, infrastructure-heavy, and often signals long-term supply confidence.
• What role does low-carbon spending play?
Low-carbon spending can reduce emissions from existing oil and gas assets or build new transition businesses. Oil and gas companies’ low-emissions energy investment is listed at $22 billion in 2025, much smaller than oil and gas supply investment.
• Which metrics matter most when tracking oil and gas capex?
The best scorecard combines total capex, upstream capex, LNG capex, offshore capex, shale capex, downstream capex, maintenance capex, low-carbon capex, capex per barrel, reserve replacement, and free cash flow after capex.
Final Takeaway
Global oil and gas capex statistics point to one conclusion: the market is still investing heavily in supply, but the reason behind that spending has become more complex. Capex now funds decline replacement, LNG expansion, offshore development, refining upgrades, energy security, emissions reduction, and asset reliability, not only new drilling. That is why the most useful analysis starts by asking what kind of capex is being measured.
The global numbers show scale. Total energy investment is measured in trillions, oil and gas supply investment is measured in hundreds of billions, and upstream oil and gas investment remains one of the largest industrial spending categories in the world. But the regional and company-level data shows that the market is not uniform. The Middle East is a low-cost, NOC-led expansion story. North America is a shale, LNG, and capital-discipline story. Latin America is a deepwater and Petrobras-centered growth story. Africa combines upstream potential with financing and execution risk. Southeast Asia shows a shifting energy mix alongside rising demand. Eurasia shows concentration and a weaker greenfield profile.
For energy leaders, the practical goal is to build a capex scorecard that separates growth capex from maintenance capex, upstream from downstream spending, LNG from oil production, NOC spending from IOC spending, real activity from inflation, country-level strategy from global averages, and low-carbon spending from traditional production spending. A blended capex total can be impressive, but it does not explain whether the industry is adding supply, replacing decline, controlling emissions, protecting cash flow, or absorbing higher project costs.
The strongest oil and gas capex analysis is therefore not the one with the largest number. It is the one that explains what the money is doing, where it is going, who is spending it, how long it will take to affect supply, and whether the spending creates durable value. That is the difference between a raw statistics article and a useful market intelligence article.


