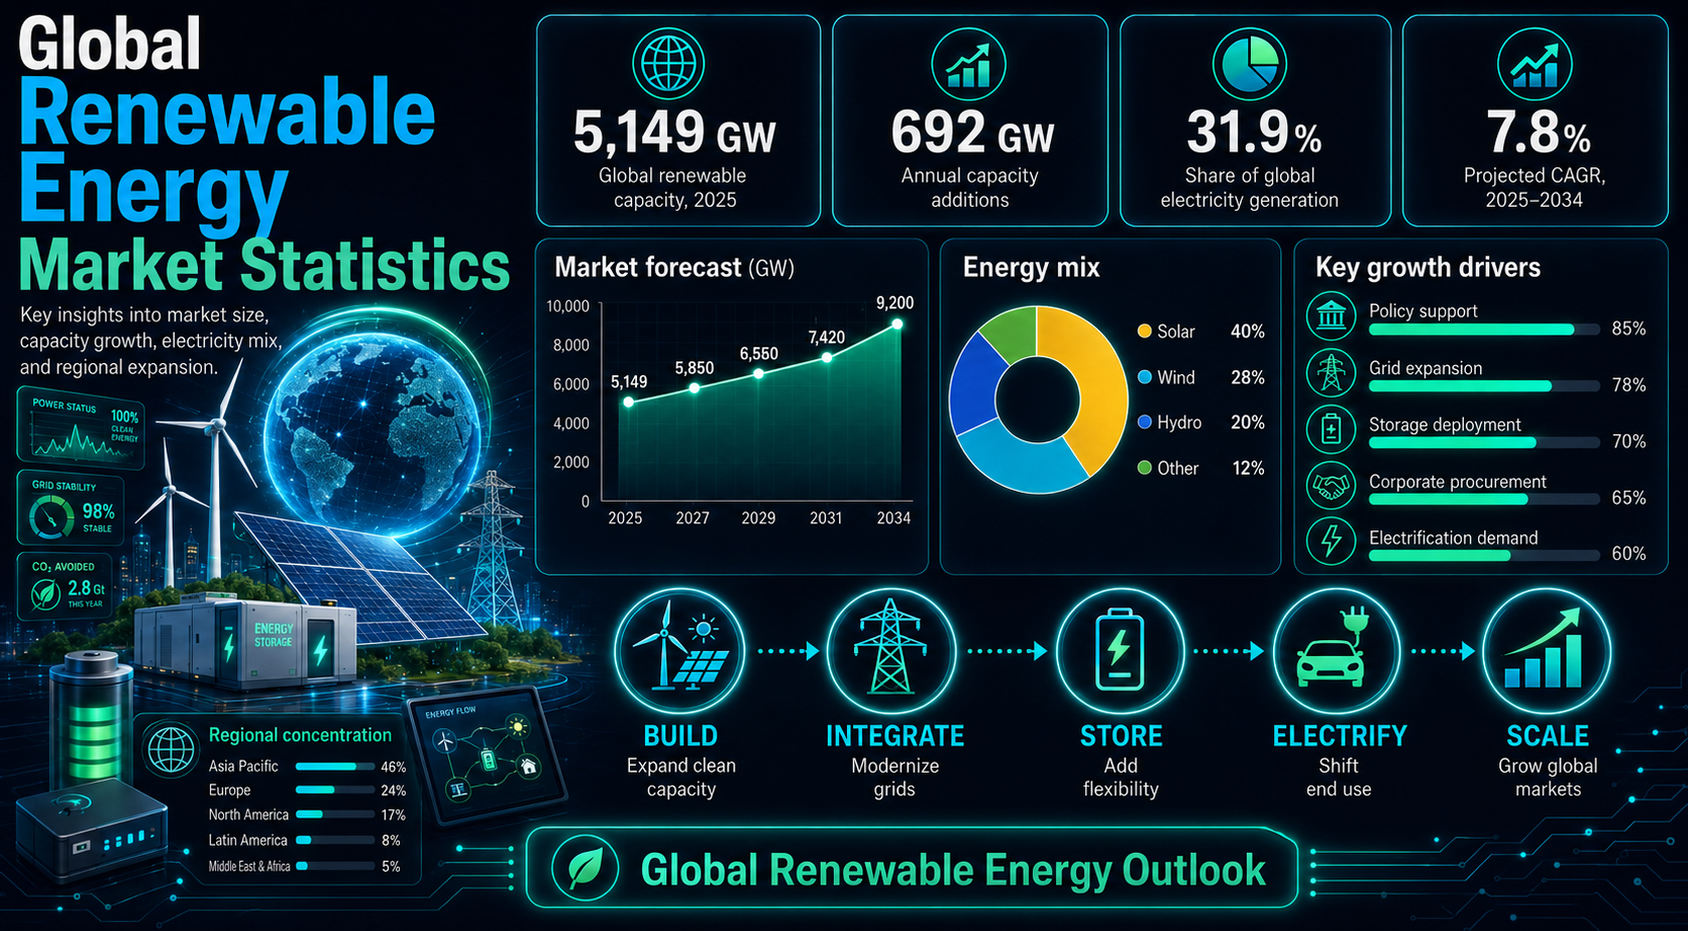
Renewable energy is no longer a side category in the global power market. It now shapes utility investment, national energy security, industrial policy, electricity prices, grid planning, and the way countries prepare for rising power demand.
The strongest statistics show why renewable energy deserves its own market scorecard. Global renewable power capacity reached 5,149 GW at the end of 2025, annual additions reached 692 GW, and renewables moved close to half of total installed power capacity. Those numbers are large enough that small changes in deployment, generation, or grid access now carry major market consequences.
This final-polish version is organized for scanning. Each section starts with a short market explanation, then connects the key statistics to technology mix, regional growth, country leaders, market barriers, and the 2030 outlook.
Executive Renewable Energy Benchmarks
These are the statistics that frame the article. They show the scale of installed capacity, the speed of annual additions, the role of solar and wind, and the difference between a headline renewable number and a market-ready power system.
The numbers that define renewable expansion
• Global renewable power capacity reached 5,149 GW by the end of 2025, giving renewables a near-half share of installed power capacity.
• Renewable capacity increased by 692 GW in 2025, which made the year one of the strongest renewable buildout periods on record.
• Global renewable power capacity grew 15.5% year over year in 2025, showing that expansion is still accelerating from a large base.
• Solar remained the fastest deployment engine, with 511 GW of new solar capacity added in 2025.
• Wind added 109 GW in 2025, keeping it central to utility-scale clean power growth.
• Asia reached 2,891 GW of renewable capacity and added 513.3 GW in 2025, making it the main regional growth center.
• China added 426.6 GW of renewable capacity in 2025, a scale that continues to shape global supply chains, investment totals, and grid planning.
• IEA expects almost 4,600 GW of additional renewable capacity from 2025 to 2030, with solar PV providing most of the growth.
• The market challenge is shifting from “can renewables grow?” to “can grids, storage, permitting, and market rules keep pace?”
Why Renewable Energy Now Carries Global Market Weight
- Renewable energy matters more today because the installed base is large enough for small percentage changes to represent huge volumes of generation equipment, grid connection work, project finance, and supply-chain activity.
- A single year of renewable additions can now exceed the entire power capacity of many national systems.
- That scale changes how analysts should read the market. Renewable growth is not only a climate metric; it is also an electricity-demand, industrial-policy, manufacturing, grid-operations, and capital-allocation metric.
- The market weight is visible in two different ways. First, capacity growth shows where money is being invested and where future generation potential is being built.
- Second, electricity-generation shares show how much those assets are actually serving demand. The difference matters because a country can build solar and wind quickly but still face curtailment, grid congestion, storage gaps, or fossil backup needs.
- A mature renewable-market review therefore asks whether capacity is being built, connected, dispatched, stored, and integrated efficiently.
- Global renewable capacity has also become a strategic energy-security signal. Countries with large clean-power pipelines can reduce exposure to imported fossil fuels, diversify power supply, and support domestic manufacturing.
- Countries with weak grid investment may add projects on paper while still struggling to deliver clean electricity to households and industry.
- That is why renewable energy statistics should be read as a system: capacity, generation, electricity share, regional concentration, technology mix, and infrastructure readiness all matter together.
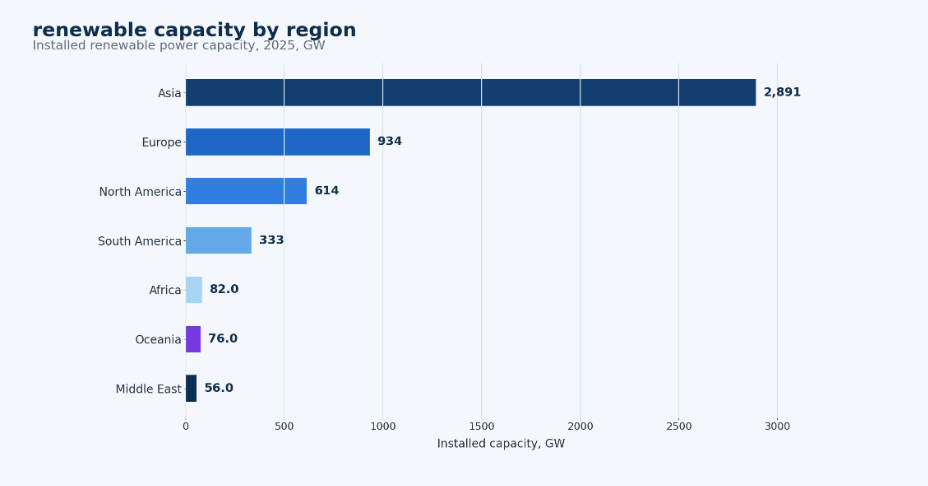
Figure 1. Renewable power capacity by region shows why the global market is concentrated in a few large growth centers, especially Asia.
Renewable Power Capacity: The Main Market Signal
Installed renewable capacity is the clearest signal of market momentum because it shows what the world is physically building before generation, utilization, and grid performance are considered.
Capacity signals worth watching
- Global renewable power capacity reached 5,149 GW in 2025, while annual additions reached 692 GW.
- Renewables represented 49.4% of total installed power capacity, and variable renewables reached 35.3%.
- Solar added 511 GW in 2025, making it the dominant growth source; wind followed with 159 GW.
- Asia added 513.3 GW of renewable capacity, far ahead of Europe at 76.8 GW and North America at 42.1 GW.
- Hydropower, bioenergy, and geothermal still matter, but their 2025 additions were much smaller than solar and wind.
The useful reading is simple: capacity growth is necessary, but it is not sufficient. Strong additions still need to be checked against generation, grid access, curtailment, storage, transmission, and market flexibility.
| Market signal | What it shows | Why it matters |
|---|---|---|
| Installed renewable capacity | Existing clean-power infrastructure | Long-term market scale. |
| Annual capacity additions | New yearly buildout | Shows current momentum. |
| Solar capacity | Fastest deployment channel | Where low-cost, modular power is expanding quickly. |
| Wind capacity | Utility-scale renewable strength | Shows grid-scale clean-power growth and transmission needs. |
| Hydropower capacity | Mature renewable base | Shows large renewable generation and flexibility potential. |
| Variable renewable share | Solar and wind penetration | Shows the need for storage, grid flexibility, and balancing markets. |
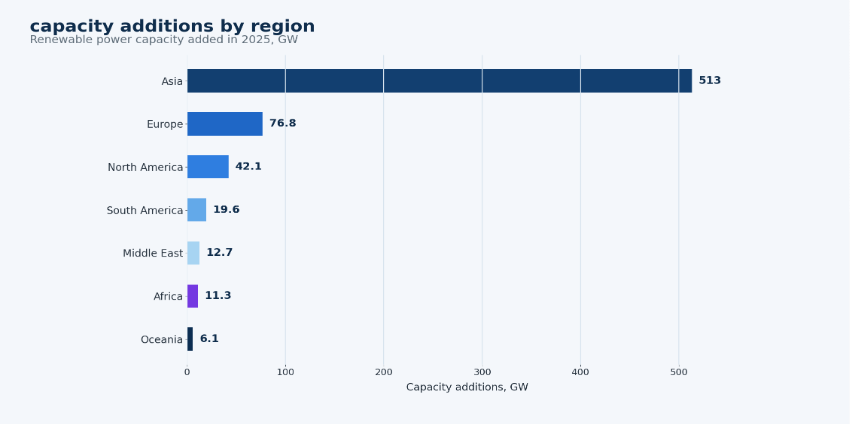
Figure 2. Capacity additions show that renewable growth in 2025 was heavily concentrated in Asia, while other regions grew from very different starting points.
Solar Energy Market Statistics
- Solar is the main growth engine of the renewable energy market. Its advantage is speed.
- Solar can be deployed through utility-scale projects, corporate power-purchase agreements, commercial rooftops, residential systems, rural microgrids, and off-grid applications.
- This flexibility explains why solar additions have accelerated faster than older power technologies. The 2025 capacity data shows solar not only leading renewable growth but dominating it.
- Solar also changes the daily shape of power markets. When solar output rises quickly during daytime hours, power systems need more flexibility in the evening and more tools to manage midday surplus.
- This is where battery storage, demand response, flexible industrial loads, and better forecasting become part of the solar story rather than separate topics.
- China remains the center of global solar expansion. It added 315.1 GW of solar capacity in 2025, far ahead of other major markets.
- India followed with 37.0 GW, the United States added 34.0 GW, Germany added 15.1 GW, and Brazil added 11.6 GW.
- These numbers show how solar growth now comes from both very large centralized markets and countries with strong distributed or utility-scale pipelines.
- Generation data adds another layer. Asia generated 1,269.19 TWh of electricity from solar power in 2024, while Europe generated 333.19 TWh and the European Union generated 307.07 TWh.
- Solar supplied 11.07% of EU electricity generation in 2024, proving that solar is already a visible part of mature electricity mixes.
- Africa generated 35.65 TWh from solar, which points to large future room for growth relative to the continent’s resource potential.
- The market outlook keeps solar at the center of renewable expansion. IEA expects solar PV to represent nearly 80% of worldwide renewable capacity expansion through 2030.
- The business meaning is simple: solar is not only the fastest-deploying renewable technology; it is also the technology most likely to expose storage, curtailment, forecasting, and midday grid-flexibility needs first.
- Solar’s growth also changes the way electricity systems are planned. High daytime solar output can lower wholesale prices during sunny hours, but it also increases the importance of evening flexibility.
- Batteries, demand response, flexible industrial load, interregional transmission, and better forecasting become more important as solar penetration rises.
- That is why solar statistics should be interpreted through both deployment speed and system flexibility.
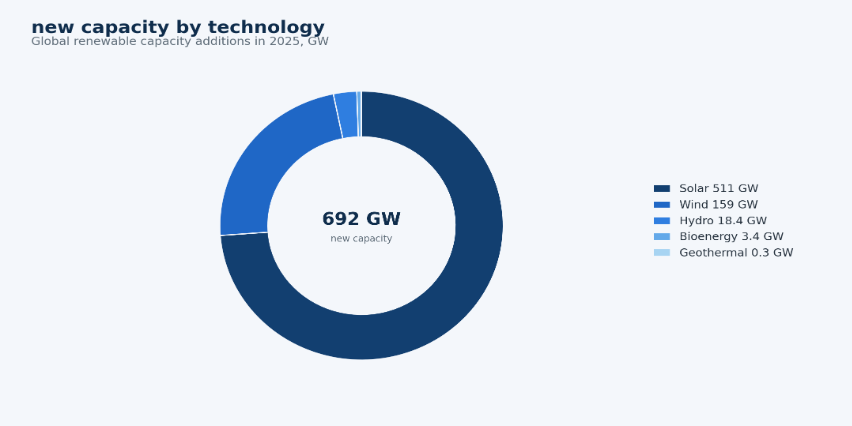
Figure 3. Technology additions show solar’s overwhelming role in the 2025 renewable-capacity buildout, followed by wind.
Wind Energy Market Statistics
- Wind energy remains the second major growth engine in renewable power. It is less modular than solar.
- but it plays a critical role in utility-scale clean electricity, especially in countries with strong wind resources, mature transmission systems, and supportive permitting.
- Wind can complement solar because output profiles often differ by hour and season. That makes wind particularly important for power systems that want higher renewable shares without relying only on midday solar generation.
- Wind is the second major renewable growth engine and remains especially important for utility-scale clean power.
- In 2025, wind energy additions reached 159 GW and global wind capacity grew by 14.0%.
- That growth was heavily concentrated in China, which added 119.4 GW of wind capacity and contributed nearly three-quarters of global wind additions.
- India added another 6.3 GW, showing continued expansion in a major demand-growth market.
- Generation figures show why wind should be measured by grid role, not only by installed capacity.
- Asia generated 1,179.20 TWh of electricity from wind in 2024, while Europe generated 596.68 TWh.
- The European Union alone generated 491.21 TWh from wind, with wind supplying 17.71% of EU electricity generation and 12.83% of Europe’s total electricity generation.
- High-income countries generated 1,177.24 TWh from wind in 2024, showing how mature power markets can turn wind capacity into large-scale output.
- ASEAN generated 18.10 TWh from wind and Africa generated 28.31 TWh, which points to future growth room rather than weak market relevance.
- Wind growth depends on resource quality, transmission access, permitting, procurement design, and project economics.
The practical lesson is that wind markets need more than turbines. They need transmission corridors, reliable forecasting, grid-balancing markets, offshore supply chains where relevant, and policies that can move projects from pipeline to operation.
| Country / region | Wind market signal | Article interpretation |
|---|---|---|
| China | Large wind buildout | Scale-led expansion. |
| United States | Major wind generation base | Strong utility-scale role, especially across wind-rich states. |
| Germany | High wind penetration | Mature renewable integration and balancing challenge. |
| United Kingdom | Offshore wind strength | Important market for offshore wind and grid planning. |
| Denmark | High wind share | Advanced example of wind-heavy grid operation. |
Hydropower Statistics
- Hydropower is the established backbone of renewable electricity. It does not grow as quickly as solar or wind, but it remains essential because large hydro systems can provide major generation volumes and, in many cases, flexibility.
- Hydro-heavy countries often achieve very high renewable electricity shares because reservoirs and river systems supply steady renewable output.
- At the same time, hydropower is exposed to rainfall, drought, reservoir management, ecological constraints, and climate variability.
- Asia generated 2,073.31 TWh from hydropower in 2024, keeping hydro at the center of the region’s renewable output.
- Europe generated 811.55 TWh, Africa generated 164.99 TWh, and ASEAN generated 221.40 TWh from hydropower.
- Hydropower supplied 17.45% of Europe’s electricity, 17.16% of Africa’s electricity, and 16.37% of ASEAN electricity generation in 2024.
- South America reached a 76.79% renewable electricity share in 2024, largely because hydropower already anchors much of the regional system.
- Brazil generated 651.26 TWh of renewable electricity in 2024, while Canada generated 409.28 TWh, showing how hydro-backed systems can operate at very large scale.
- The market lesson is simple: hydro-heavy countries can post high renewable shares, but annual output can still move with rainfall, reservoir conditions, and demand patterns.
The human reading of hydropower statistics is that stability and climate exposure sit side by side. Hydropower can help balance systems with more solar and wind, but drought, rainfall variability, reservoir constraints, environmental rules, and aging assets can change output from year to year.
Bioenergy, Geothermal, and Other Renewables
- Solar, wind, and hydropower dominate the renewable market, but smaller renewable technologies still matter.
- Bioenergy, geothermal, waste-to-energy, marine energy, and off-grid renewables serve specific use cases that solar and wind cannot always cover on their own.
- Their role is less about leading annual capacity additions and more about filling gaps in heat, baseload power, rural access, waste management, and resilience.
- Smaller renewable technologies do not dominate global growth, but they still fill important market roles.
- Bioenergy capacity increased by 3.4 GW in 2025 and grew 2.3%, while geothermal energy added 0.3 GW and grew 1.7%.
- Those figures are modest beside solar and wind, yet they matter because these technologies can serve use cases that variable generation cannot always cover.
- Geothermal can provide steady output in resource-rich markets where heat resources are technically and economically usable.
- Sustainable bioenergy can support electricity, heat, or fuel systems when feedstock is available and responsibly managed.
- Smaller renewable technologies matter most when they solve local problems such as resilience, waste management, rural access, or industrial heat.
Off-grid renewables also deserve attention because they solve a different market problem. Where grid extension is expensive or electricity access remains incomplete, decentralized solar, mini-grids, and hybrid systems can provide power access without waiting for full transmission buildout.
| Technology | Main use | Market role |
|---|---|---|
| Bioenergy | Power, heat, fuels | Useful where sustainable feedstock exists and emissions controls are strong. |
| Geothermal | Baseload power and heat | Strong in selected resource-rich countries. |
| Waste-to-energy | Urban waste and power | Depends on waste policy, emissions rules, and local acceptance. |
| Marine energy | Emerging power source | Still small compared with solar and wind. |
| Off-grid renewables | Rural and remote power | Important for access, resilience, and distributed growth. |
Regional Renewable Energy Market Statistics
- Regional statistics are one of the most useful parts of a renewable energy market report because global averages hide different adoption patterns.
- Asia leads on scale, Europe leads on high renewable shares and policy maturity, North America combines major project depth with grid and permitting challenges, Latin America has a strong hydro base plus new wind and solar growth.
- and Africa and the Middle East have large resource potential but smaller installed bases.
Asia-Pacific
- Asia is the largest renewable capacity center in the world. Its market position is driven by China’s extraordinary scale, India’s fast-growing electricity demand, Japan’s mature solar base, Australia’s strong distributed solar market, and emerging Southeast Asian demand.
- Asia reached 2,891 GW of renewable power capacity in 2025, represented 56.1% of global renewable capacity, and added 513.3 GW during the year.
- That makes Asia the key region for understanding global renewable growth.
Europe
- Europe is important because it combines high renewable electricity shares with mature policy frameworks and strong wind and solar penetration.
- Europe reached 934 GW of renewable power capacity in 2025 and added 76.8 GW during the year.
- In electricity terms, Europe generated 1,954.77 TWh from renewables in 2024, while renewables supplied 42.03% of European electricity generation.
- The European Union generated 1,331.49 TWh from renewables and reached a 48.01% renewable electricity share in 2024.
North America
- North America reached 614 GW of renewable capacity in 2025 and added 42.1 GW.
- The region combines large utility-scale solar and wind resources with a complex grid-expansion challenge.
- The United States generated 1,056.63 TWh of renewable electricity in 2024, while renewables supplied 24.06% of U.S. electricity generation.
- Canada generated 409.28 TWh from renewables and reached a 64.27% renewable electricity share, largely reflecting hydro strength.
Latin America
- Latin America is different from many regions because hydropower has long been central to its electricity mix.
- South America reached 333 GW of renewable capacity in 2025 and generated 1,013.97 TWh of renewable electricity in 2024.
- Renewables supplied 76.79% of South America’s electricity generation, one of the strongest regional shares in the dataset.
- Brazil remains the anchor market, but Chile, Uruguay, Mexico, Argentina, and Colombia are also important for solar, wind, and grid modernization.
Middle East and Africa
- Africa and the Middle East hold large solar-resource potential, but their renewable-market scale remains smaller than Asia, Europe, and North America.
- Africa reached 82 GW of renewable capacity in 2025, added 11.3 GW, and grew by 15.9%.
- Africa generated 237.90 TWh of renewable electricity in 2024, with renewables supplying 24.74% of electricity generation.
- The market opportunity is large, but grid investment, project finance, policy stability, and transmission planning remain central barriers.
- Asia-Pacific should be read as a scale story because China and India can change global totals quickly.
- Europe should be read as an integration story because high wind and solar shares test permitting, grid planning, and balancing markets.
- North America should be read through project pipelines, interconnection queues, and utility-scale solar and wind economics.
- Latin America should be read through hydropower resilience and the speed of new solar and wind additions.
- The Middle East and Africa should be read through solar potential, project finance, and grid expansion capacity.
| Region | Main renewable strength | Main market challenge |
|---|---|---|
| Asia-Pacific | Solar scale, manufacturing depth, and large demand growth | Coal displacement, grid integration, and curtailment management. |
| Europe | Wind, solar, policy support, and high renewable shares | Permitting and transmission. |
| North America | Utility-scale solar, wind, and hydro-backed systems | Interconnection queues, permitting, and grid expansion. |
| Latin America | Hydropower plus new solar and wind growth | Climate variability, financing, and transmission buildout. |
| Middle East & Africa | Solar resource potential and emerging utility-scale projects | Grid investment, project finance, and policy execution. |
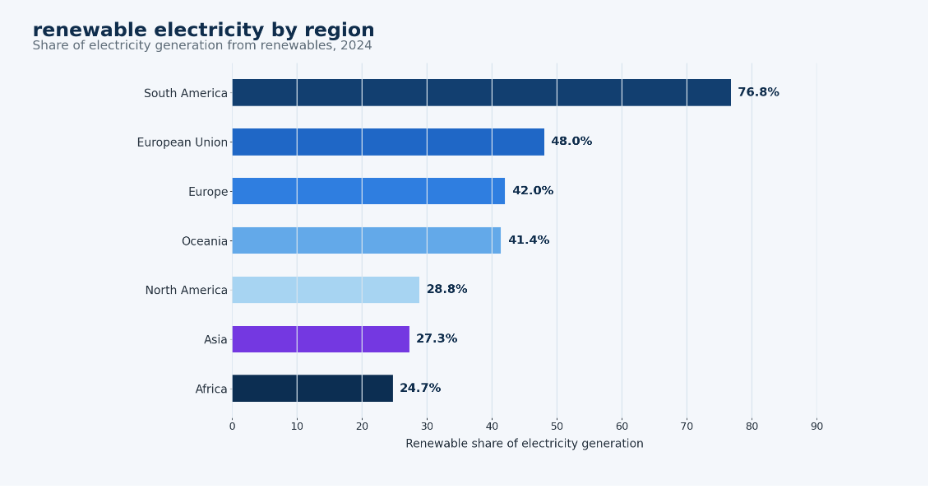
Figure 4. Regional renewable electricity shares show why country and regional context matters more than a single global average.
Country-Level Renewable Energy Statistics
- Country-level data gives the renewable market its real shape. A global statistic can show direction, but country statistics reveal why markets behave differently.
- China shows scale. India shows demand-driven growth. Germany and Spain show mature European integration.
- Brazil and Canada show hydro-backed renewable electricity. Australia shows the effect of distributed solar.
- Norway, Iceland, Paraguay, Uruguay, Costa Rica, and similar markets show how hydro and geothermal resources can produce very high renewable electricity shares.
- Country-level data also protects the article from misleading conclusions. A high renewable share can come from a small hydro-dominated system, while a lower share in a large economy may still represent massive clean-power generation.
- China, the United States, India, Brazil, Germany, and Canada should therefore be compared by capacity, generation, share, and growth together rather than by one isolated number.
- Country-level statistics show that the renewable market is not one global pattern. China generated 3,398.83 TWh of renewable electricity in 2024, and its renewable output increased by 504.61 TWh from 2023 to 2024, a 17.44% annual increase.
- The United States generated 1,056.63 TWh and added 91.89 TWh over the same period, showing a large but different growth profile.
- Brazil and Canada show the importance of hydro-backed systems. Brazil generated 651.26 TWh from renewables in 2024 and reached an 87.33% renewable electricity share.
- Canada generated 409.28 TWh and reached a 64.27% renewable electricity share. India, by contrast, generated 403.39 TWh from renewables and reached a 19.81% share.
- which shows how renewable growth can be strong while total electricity demand remains large and fossil generation still substantial.
- Europe provides several mature-market examples. Germany generated 290.86 TWh from renewables in 2024 and reached a 58.64% renewable electricity share. Australia, Japan, Spain, the United Kingdom, and France remain important because each combines renewable capacity growth with different policy, grid, and market-design challenges.
- High-share countries tell another story. Paraguay, Ethiopia, Iceland, the Democratic Republic of Congo, Nepal, Bhutan, and Albania each recorded 100% renewable electricity shares in the dataset for 2024.
- Costa Rica reached 99.91%, Uruguay 98.88%, Norway 98.61%, Uganda 97.07%, and Tajikistan 94.59%. These countries prove that high renewable shares are possible, but the mix often depends heavily on hydropower, geography, and national system size.
| Country | Renewable strength | Why it matters |
|---|---|---|
| China | Solar, wind, and hydro scale | Largest renewable buildout market and main driver of global additions. |
| United States | Wind and solar scale | Major utility and private-sector market. |
| Brazil | Hydropower with solar and wind growth | Latin American renewable leader with high renewable electricity share. |
| India | Solar expansion and rising demand | Major demand-growth market where clean power can shape future generation. |
| Germany | Wind and solar integration | Mature clean-power transition market. |
| Spain | Solar and wind resources | Strong European solar/wind market. |
| Australia | Rooftop and utility solar | High solar adoption example. |
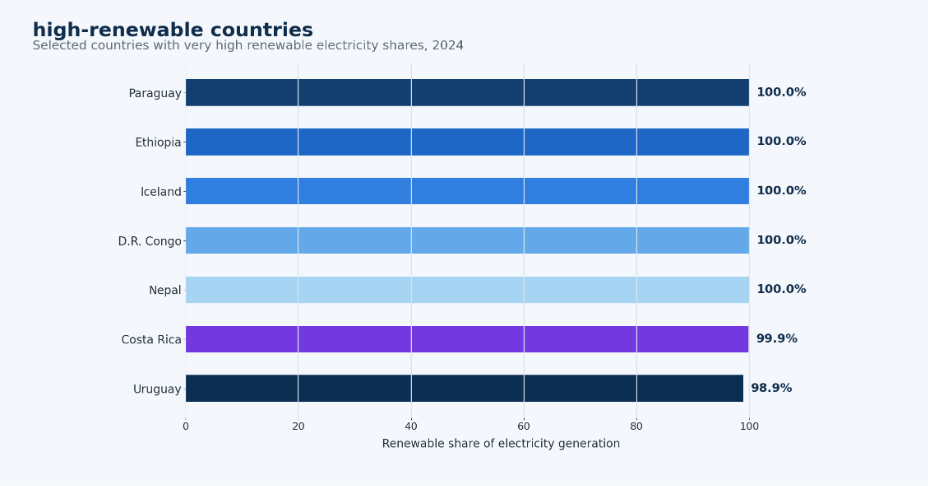
Figure 5. High-renewable countries show that small or hydro-rich power systems can reach renewable electricity shares far above the global average.
Renewable Electricity Generation and Electricity Mix
Capacity and generation are different market signals. Capacity shows how much renewable infrastructure exists, while generation shows how much electricity those assets actually produced. In 2024, global renewable electricity generation reached 9,877.61 TWh, supplying 31.93% of global electricity.
Regional output shows why the mix matters. Asia generated 4,911.29 TWh from renewables in 2024, Europe generated 1,954.77 TWh, North America generated 1,596.12 TWh, and South America generated 1,013.97 TWh. South America also had the highest renewable electricity share at 76.79%, largely supported by hydropower.
- Technology roles differ by grid need. Hydropower provides established renewable output, wind supports utility-scale supply, solar is rising quickly but needs storage and flexibility, and smaller sources such as bioenergy or geothermal serve targeted power and heat niches.
- That is why capacity, generation, and electricity share should be read together rather than as one blended number.
| Electricity metric | What it tells analysts | How to use it |
|---|---|---|
| Installed capacity | How much renewable infrastructure exists | Use for investment scale and project pipeline analysis. |
| Electricity generation | How much renewable output was produced | Use for real power-market contribution. |
| Renewable electricity share | How much of demand renewables served | Use for transition progress and fossil displacement. |
| Technology mix | Which technologies supply renewable output | Use for grid flexibility, storage, and balancing needs. |
| Annual generation change | Whether renewable output is growing | Use for trend analysis and policy impact. |
Renewable Energy Growth Trends
• Renewable growth should be read through new capacity, generation change, renewable-share growth, technology mix, and regional distribution because the fastest-growing market is not always the market with the highest renewable share.
• China increased renewable electricity generation by 504.61 TWh from 2023 to 2024, up 17.44%, making its single-year increase larger than the total renewable output of many national markets.
• Other large markets still added meaningful clean electricity: the United States increased renewable generation by 91.89 TWh and grew 9.52%, while India added 33.42 TWh and grew 9.03%.
• Brazil added 21.07 TWh and grew 3.34%, Germany added 13.76 TWh and grew 4.97%, while Canada changed by -10.17 TWh, or -2.42%, showing how hydro conditions and demand shifts can move mature renewable markets.
• Growth statistics become useful when read by cause: solar-led gains often signal deployment speed, wind-led gains reflect utility-scale expansion, and hydro movement can reflect rainfall as much as new investment.
| Growth signal | What to measure | Why it matters |
|---|---|---|
| Annual renewable additions | New installed capacity | Shows current investment momentum. |
| Renewable generation growth | Clean electricity output | Shows real electricity impact. |
| Solar growth | Fastest scalable technology | Shows deployment speed and flexibility needs. |
| Wind growth | Utility-scale expansion | Shows grid-scale renewable progress. |
| Renewable share growth | Market penetration | Shows fossil displacement progress. |
Renewable Energy Investment and 2030 Outlook
The 2030 outlook is strong, but it should be read as a delivery test rather than a simple growth forecast. Renewable projects still need permits, interconnection, finance, equipment, storage, and transmission before capacity turns into usable electricity.
2030 investment signals to watch
- IEA projects almost 4,600 GW of renewable power capacity additions globally between 2025 and 2030, roughly double the deployment recorded during 2019-2024.
- Solar remains the largest contributor. IEA expects solar PV to represent nearly 80% of worldwide renewable electricity capacity expansion through 2030.
- Distributed solar PV accounts for 42% of overall PV expansion, which makes rooftop, commercial, and behind-the-meter systems important to grid planning.
- The annual pace also needs to rise. IEA’s tracker shows global yearly renewable additions rising to almost 890 GW by 2030.
- IRENA’s 1.5°C pathway points to 11.17 TW of renewable power capacity needed by 2030, leaving a gap of about 6.02 TW versus the end-2025 base.
These figures show why the forecast is both an opportunity and a pressure point. Solar-heavy growth can lower generation costs, but it also raises the value of batteries, flexible loads, interconnectors, demand-side management, and price signals that move consumption into clean-power hours.
Market Barriers: Grid, Storage, Permitting, and Policy
The renewable market challenge is no longer only project construction. The stronger test is whether grids, permits, storage, finance, and policy systems can turn planned capacity into usable electricity.
Barriers analysts should separate
- Grid congestion shows whether clean power can move from resource-rich areas to demand centers.
- Interconnection queues show whether project pipelines are turning into connected assets.
- Storage gaps show whether solar and wind growth is being matched by flexibility.
- Permitting delays show whether policy ambition is moving faster than project approvals.
- Financing costs and policy uncertainty can slow otherwise viable renewable projects.
| Barrier | Why it affects renewable growth | Likely solution |
|---|---|---|
| Grid congestion | Clean power cannot move efficiently | Transmission expansion |
| Interconnection delays | Projects wait before connecting | Faster approval systems |
| Storage gaps | Solar and wind vary by time | Batteries and flexible demand |
| Permitting delays | Projects slow before construction | Streamlined planning |
| Financing cost | Higher rates raise project cost | Stable policy and lower-risk capital |
| Curtailment | Renewable output is wasted | Better grid balancing |
Renewable Energy Market Diagnostic
- A polished renewable energy benchmark should help a team decide where to look next.
- The most useful model connects statistics to action. If capacity is rising but generation share is flat, the issue may be demand growth, curtailment, low capacity factors, or fossil generation that is not being displaced.
- If solar is growing quickly but evening fossil generation remains high, the issue may be storage and flexibility.
- If a country has high renewable share but low growth, the market may be hydro-rich but mature.
| Problem area | Core metric to measure | What it reveals |
|---|---|---|
| Capacity growth | Annual renewable additions | Investment momentum and project delivery. |
| Generation impact | Renewable electricity output | Real clean-power contribution. |
| Technology mix | Solar, wind, hydro, bioenergy, geothermal shares | Market structure and grid needs. |
| Regional growth | Capacity and additions by region | Where investment is concentrated. |
| Country performance | Renewable share by country | National transition progress. |
| Grid readiness | Curtailment, connection delays, transmission buildout | Infrastructure weakness. |
| Storage readiness | Battery, pumped storage, and flexible capacity | Ability to handle variable renewables. |
90-Day Renewable Energy Market Research Plan
Statistics become useful when they are translated into a research plan. A renewable energy review can be organized into a 90-day cycle that first establishes the baseline, then compares country and regional growth, and finally evaluates the infrastructure and policy risks that determine whether renewable projects become reliable electricity supply.
| Timing | What to analyze | Output |
|---|---|---|
| Days 1-30 | Review global capacity, generation, technology mix, regional growth, and annual additions. | Baseline renewable market map. |
| Days 31-60 | Compare country-level growth, solar/wind adoption, electricity shares, and high-renewable countries. | Country opportunity ranking. |
| Days 61-90 | Evaluate grid, storage, policy, permitting, curtailment, and investment barriers. | Market outlook and risk scorecard. |
Metrics Renewable Energy Analysts Should Track
The final scorecard should be detailed enough to locate the market signal without becoming a vanity dashboard.
A useful renewable energy dashboard compares investment, output, market share, technology structure, and grid readiness.
These metrics also help prevent misleading conclusions. High capacity growth is encouraging, but it should be checked against actual generation, curtailment, and fossil-fuel displacement.
Interconnection timelines show whether projects can move from pipeline to delivered electricity.
Capacity factors, curtailment, and power prices during renewable-heavy hours show how well the grid is absorbing clean output.
Battery deployment, transmission buildout, procurement volumes, and corporate power-purchase agreements reveal whether the market is transforming the electricity system, not just adding equipment.
This scorecard approach also makes the article easier to use in a business setting.
Instead of treating renewable energy as one broad trend, analysts can separate growth into infrastructure built, electricity delivered, market share gained, and system constraints still unresolved.
That separation helps explain why two countries with similar renewable capacity can have very different market outcomes.
| Metric | Why it matters |
|---|---|
| Installed renewable capacity | Total renewable infrastructure and long-term market scale. |
| Annual capacity additions | Current growth momentum and project-delivery speed. |
| Renewable electricity generation | Actual clean-power output. |
| Renewable share of electricity | Power-mix transformation and fossil displacement. |
| Solar generation share | Solar penetration and storage/flexibility pressure. |
| Wind generation share | Utility-scale renewable penetration. |
| Hydropower generation | Mature renewable contribution and weather sensitivity. |
| Grid curtailment | Wasted renewable output and infrastructure bottlenecks. |
| Storage capacity | Flexibility readiness. |
| Investment volume | Capital-market confidence and policy support. |
| Country-level renewable share | National transition progress and market differences. |
Global Renewable Energy Market Statistics FAQ
What is the size of the global renewable energy market?
The most direct capacity measure is global renewable power capacity, which reached 5,149 GW by the end of 2025. The market is also measured through annual additions, electricity generation, investment, and the share of electricity supplied by renewable technologies.
How much renewable power capacity exists globally?
Global renewable power capacity reached 5,149 GW at the end of 2025 after 692 GW of additions during the year.
Which renewable energy source is growing fastest?
Solar is the fastest growth engine. Solar capacity increased by 511 GW in 2025 and expanded by 27.2%, far ahead of other renewable technologies.
Which country leads the renewable energy market?
China is the largest renewable expansion market in the dataset. It added 440.1 GW of renewable capacity in 2025, including 315.1 GW of solar and 119.4 GW of wind.
Which region has the largest renewable capacity?
Asia has the largest regional renewable capacity. It reached 2,891 GW in 2025 and represented 56.1% of global renewable capacity.
What is the difference between renewable capacity and renewable generation?
Capacity measures how much renewable power infrastructure exists. Generation measures how much electricity those assets actually produced. Electricity share measures how much of total power demand renewables served.
Why is solar energy growing so quickly?
Solar is modular, relatively fast to deploy, scalable from rooftops to utility projects, and supported by falling equipment costs and broad policy adoption. Its growth also increases the need for storage and grid flexibility.
What are the biggest barriers to renewable energy growth?
The biggest barriers include grid congestion, interconnection delays, permitting, storage gaps, financing cost, policy uncertainty, curtailment, and supply-chain risks.
Which numbers are most useful for a 2030 market outlook?
Solar and wind capacity only create market value when electricity can be connected, moved, stored, and used at the right time. Grid congestion, curtailment, interconnection delays, and storage gaps explain why strong capacity additions may not immediately translate into higher renewable electricity share.
Why should renewable statistics include grid and storage indicators?
A high renewable electricity share can come from a mature hydropower system with limited new buildout, while a lower share in a large economy can still represent massive clean-power generation. That is why country statistics should compare capacity, generation, growth, technology mix, and grid readiness together rather than relying on one headline percentage.
Why can a high renewable share be misleading?
A strong market is not only the one that adds capacity quickly. It is the one where new projects connect on time, generate useful electricity, reduce fossil dependence, manage curtailment, attract stable investment, and build enough storage and transmission to support the next wave of solar and wind additions.
What makes a renewable energy market stronger than its headline growth rate?
Regional data should be used to identify what type of renewable market is developing. Asia shows scale and manufacturing depth, Europe shows policy maturity and wind integration, Latin America shows hydro-backed clean power, and the Middle East and Africa show large solar potential that depends on grid investment and project finance.
Final Takeaway
The strongest renewable energy review therefore connects headline numbers to operating reality. Capacity, generation, electricity share, regional mix, storage readiness, and policy execution should be read together so the article explains what is growing, where it is growing, and whether that growth is turning into dependable clean electricity.
Global renewable energy statistics point to one conclusion: clean power is now a mainstream electricity-market force. The market is defined by installed capacity, annual additions, solar and wind deployment, hydropower stability, regional growth patterns, and the ability to turn new assets into dependable electricity.
The strongest scorecard reads capacity, generation, electricity share, technology mix, grid readiness, and 2030 delivery risk together. Solar is expanding fastest, wind remains central to utility-scale decarbonization, and hydropower continues to anchor many high-renewable systems, but capacity alone can mislead when grids, storage, transmission, permitting, financing, and policy stability lag behind project pipelines.
For analysts, investors, utilities, and policymakers, the key is to understand what each indicator reveals. Capacity reflects what is being developed, generation shows how much electricity is actually being produced, and the share of electricity from renewables highlights how significantly the energy mix is changing. Grid readiness then indicates whether existing infrastructure can accommodate the next phase of renewable growth. Together, these factors provide a practical framework for assessing the global renewable energy market through 2030, while tools such as a consulting invoice template can support the organization of related professional services and project costs.
For readers, the practical takeaway is to treat renewable energy statistics as a connected operating system: capacity shows what has been built, generation shows what is being delivered, electricity share shows how the mix is changing, and infrastructure readiness shows whether the market can keep scaling without wasting clean power.


