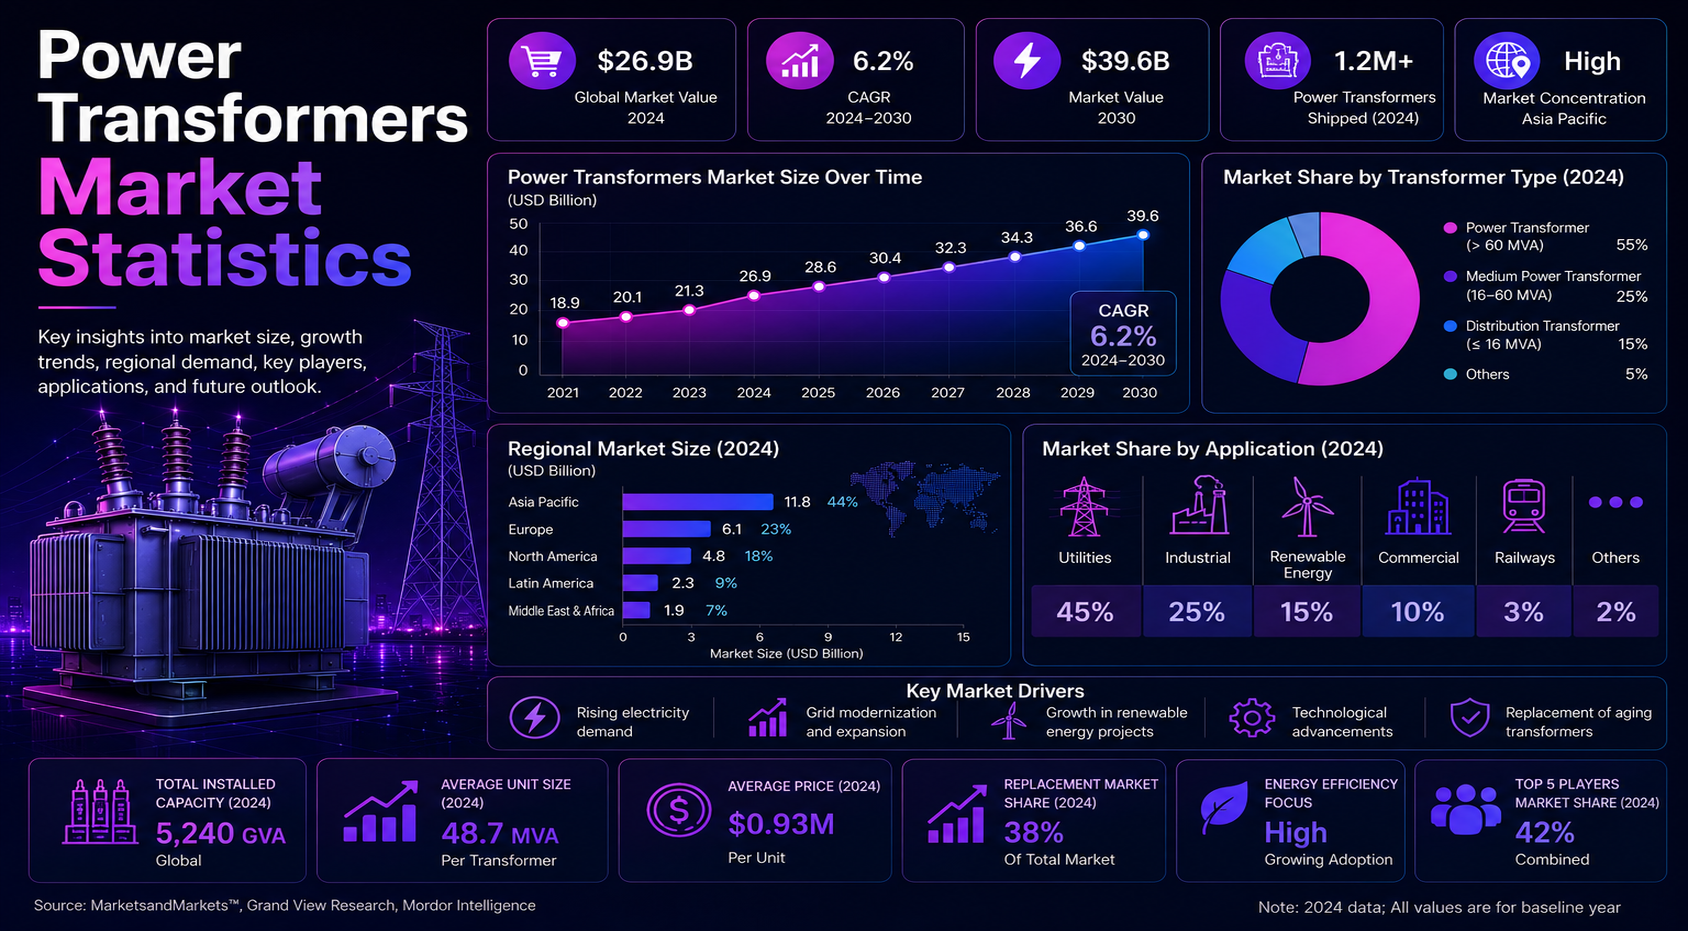
Power transformers sit at the center of electricity delivery, grid expansion, renewable integration, and industrial power reliability. Every large transmission corridor, utility substation, power plant interconnection, offshore wind zone, industrial electrification program, and hyperscale data center ultimately depends on transformer capacity. That makes the power transformers market a grid-infrastructure story, not only an equipment-sales story.
The strongest statistics show why this market now deserves its own scorecard. The global power transformer market is measured in tens of billions of dollars, annual grid investment is moving above USD 400 billion, large power transformer procurement can take up to four years, and U.S. generator step-up transformer demand has increased 274% since 2019. At the same time, China is preparing a USD 574 billion grid investment cycle, Europe is redesigning networks for renewables, and India is expanding transmission capacity to support rising electricity demand.
Executive Power Transformer Benchmarks
These are the statistics that frame the market. They show the scale of demand, the intensity of grid investment, the importance of regional buildout, and the supply-chain pressure now shaping transformer procurement. A strong benchmark view should separate market value, grid investment, product mix, regional demand, and lead-time risk instead of treating transformer growth as one simple forecast line.
The numbers that define the power transformer market
• The global power transformer market was valued at USD 28.88 billion in 2024 and is forecast to move above USD 41 billion by 2030.
• A separate market estimate places the power transformers market at USD 24.78 billion in 2025 and USD 35.51 billion by 2031.
• The main global forecast range points to annual growth of around 6% to 7% through the late 2020s.
• Global grid investment is set to surpass USD 400 billion in 2025, creating a direct demand signal for transformers, substations, cables, and switchgear.
• Annual grid investment needs to rise by roughly 50% by 2030 from today’s USD 400 billion level to keep pace with electrification and clean-energy connection needs.
• Large power transformer procurement can take up to four years, which turns transformer availability into a project-schedule issue rather than a simple purchasing issue.
• Average lead times for large power transformers have almost doubled since 2021.
• U.S. generator step-up transformer demand has risen 274% since 2019, while U.S. substation transformer demand has risen 116% in the same period.
• U.S. transformer prices increased about 80% over a five-year period, showing how shortage pressure can reach project budgets.
• China’s State Grid plans USD 574 billion of grid investment over 2026-2030, making China one of the most important demand centers for high-voltage equipment.
• Italy’s grid operator has outlined more than EUR 23 billion of grid investment over 2025-2034, reflecting Europe’s long-cycle modernization need.
• The high-voltage power transformer market was estimated at USD 9.1 billion in 2024 and is projected to reach USD 12.3 billion by 2029.
• The oil-immersed power transformer market was estimated at USD 21.88 billion in 2024 and is forecast to reach USD 35.81 billion by 2032.
The headline numbers show a market with strong demand but limited flexibility. Power transformers cannot be added as quickly as software capacity, warehouse capacity, or short-cycle electrical components. Design, testing, materials, transport, site preparation, and utility approval all stretch the timeline. That makes the market especially sensitive to planning mistakes. When grid operators underestimate future load, the impact can show up years later as interconnection delays, transformer backlogs, higher bid prices, and slower renewable deployment. A useful benchmark view therefore needs to read market growth beside lead times and manufacturing capacity.
Editorial readout
The headline data points to five linked forces: grid modernization, renewable integration, electrification-driven load growth, replacement of aging infrastructure, and supply-chain pressure. A useful market view should separate those forces because each one creates a different transformer buying pattern. Utility replacements, renewable step-up projects, data-center substations, and national transmission corridors do not move on the same schedule, even when they all increase demand for large electrical equipment.
Market Size and Grid-Level Demand
Power transformer market sizing matters because the product category is tied directly to the physical expansion of electricity networks. A market-size figure alone does not show why orders are rising, but it becomes more useful when it is read beside grid investment, transmission expansion, and electrification trends. The market is not growing only because utilities are buying more equipment. It is growing because electricity systems are being asked to carry more power, connect more variable generation, and serve more high-load users.
Market-size and grid-investment benchmarks
• The global power transformer market is estimated at USD 28.88 billion in 2024 and around USD 30.76 billion in 2025.
• The same global forecast path places the market near USD 32.76 billion in 2026, USD 34.89 billion in 2027, and USD 37.15 billion in 2028.
• By 2030, the global power transformer market is expected to move into the USD 41 billion to USD 42 billion range.
• Another forecast path estimates a USD 24.78 billion 2025 market and a USD 35.51 billion 2031 market, showing that definitions vary but the growth direction is consistent.
• Global electricity-sector investment is measured at about USD 1.5 trillion in 2025, with grid infrastructure representing a major part of that capital cycle.
• Grid investment above USD 400 billion in 2025 creates demand not only for transformers, but also for substations, cables, switchgear, protection systems, and control equipment.
• Transmission and distribution infrastructure spending reached USD 78.6 billion in the United States in 2023 when transmission and distribution categories are reviewed together.
Market-size estimates should also be read with some caution because different reports draw the category boundary differently. Some focus only on large power transformers used in transmission networks, while others include broader utility-grade transformer categories. The more reliable conclusion is directional: the market is expanding because the physical grid has to become larger, more resilient, and more capable of handling variable generation and new load centers. In that context, growth around the late 2020s is less about a temporary replacement cycle and more about structural pressure from electrification.
| Market view | Base year | Market value | Forecast year | Forecast value | Growth signal |
|---|---|---|---|---|---|
| Global power transformers | 2024 | USD 28.88B | 2030 | USD 41B+ | Mid-single-digit CAGR |
| Alternate global forecast | 2025 | USD 24.78B | 2031 | USD 35.51B | About 6% CAGR |
| High-voltage power transformers | 2024 | USD 9.1B | 2029 | USD 12.3B | Transmission-led growth |
| Oil-immersed power transformers | 2024 | USD 21.88B | 2032 | USD 35.81B | Utility and high-capacity demand |
| Global grid investment | 2025 | USD 400B+ | 2030 | 50% increase needed | Infrastructure constraint |
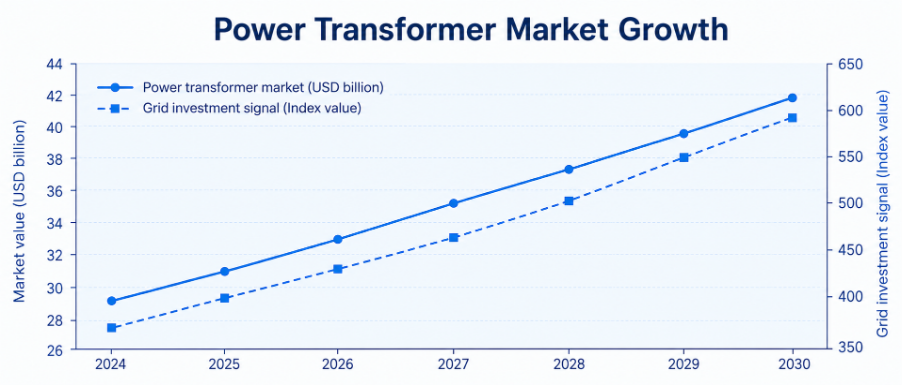
Figure 1. Power transformer market growth and grid investment should be reviewed together because transformer demand rises when countries expand, replace, and modernize transmission infrastructure.
Market-size interpretation
Different market estimates use different category definitions, voltage ranges, and manufacturer coverage. That is why the direction of growth is more important than a single isolated market value. The useful conclusion is that the market is moving upward while grid investment is also expanding, which means demand is being supported by physical infrastructure needs rather than only by short-term equipment replacement.
Demand Drivers: Grid Expansion, Renewables, and Electrification
Power transformer demand rises when electricity networks become larger, more complex, or more stressed. The strongest growth signals are not limited to new power plants. They include renewable interconnection, long-distance transmission corridors, aging-grid replacement, data-center load growth, EV charging, industrial electrification, and resilience programs. Each demand driver affects a different part of the transformer market, so it helps to separate them before making conclusions.
Demand drivers worth separating
• Renewable integration increases the need for step-up transformers, collection substations, grid-tie equipment, and transmission reinforcement.
• Transmission expansion creates demand for high-voltage and extra-high-voltage transformers that can move large blocks of power across regions.
• Aging infrastructure raises replacement demand because older transformers face insulation deterioration, thermal stress, and higher outage risk.
• Data centers increase localized substation demand because high-density computing loads require dependable, redundant, and high-capacity power delivery.
• Industrial electrification raises power demand in manufacturing, mining, metals, chemicals, rail, oil and gas, and heavy process industries.
• EV charging creates load-growth pressure at distribution and sub-transmission levels, especially where charging depots, fleets, and highway corridors develop quickly.
• Grid resiliency programs increase transformer demand when utilities harden networks against storms, heat, flooding, fire, and reliability events.
• Utility capital expenditure remains a core demand signal because large transformer projects usually sit inside multi-year grid plans, not short procurement cycles.
The demand-driver data also shows why transformer buyers do not all behave the same way. A renewable developer may need a step-up transformer tied to a specific interconnection date. A utility may be replacing an aging substation bank inside a multi-year capital plan. A data-center operator may need redundant transformer capacity before a campus can energize. An industrial customer may need equipment sized for future expansion rather than today’s load. These different demand paths create the same market outcome – more transformer orders – but they carry different urgency, voltage requirements, financing models, and delivery risks.
| Demand driver | Transformer impact | Main owner | Planning signal |
|---|---|---|---|
| Renewable integration | More step-up and grid-tie transformers | Utilities, IPPs, EPCs | Interconnection queues and renewable zones |
| Aging grid replacement | Higher replacement and refurbishment demand | Utilities and grid operators | Asset age, failure risk, and outage cost |
| Data centers | Higher substation and redundancy demand | Data center operators and utilities | Power availability and local grid capacity |
| Industrial electrification | More high-load site equipment | Industrial firms and utilities | New plants, process electrification, and load requests |
| Transmission expansion | More high-voltage transformer installations | TSOs and governments | New corridors, substations, and grid plans |
How to use demand-driver data
Transformer demand should not be viewed as one blended number. Renewable projects, transmission upgrades, aging asset replacement, and industrial load growth each have different procurement cycles, technical requirements, and risk profiles. A market forecast becomes more useful when each growth driver is connected to a buyer, a voltage class, a timeline, and a constraint.
Transformer Type, Voltage, and Application Mix
Segmentation is important because not every transformer market statistic describes the same buying behavior. Oil-immersed transformers are used heavily in utility and high-capacity applications. Dry-type units are more common in commercial, industrial, and indoor environments. High-voltage transformers are tied to transmission expansion, while smart and digital transformer categories are tied to monitoring, automation, and predictive maintenance. A clean segmentation view prevents the article from treating every transformer as interchangeable.
Product and application benchmarks
• Oil-immersed transformers represent one of the largest product categories, with revenue-share estimates above 60% in several market views.
• A 2025 segment estimate places oil-immersed share near 68.3%, reflecting the continued role of liquid-insulated units in utility and high-capacity service.
• Utility application share is estimated near 48.5% in one market view, confirming that grid operators remain the largest structural demand base.
• SPT voltage-rating demand is estimated at 57.2% in one segment breakdown, showing the importance of sub-transmission and utility-grade voltage categories.
• Medium power rating demand in Asia-Pacific is estimated near 54.7%, supported by regional grid expansion and industrial load growth.
• Three-phase transformer share in Asia-Pacific is estimated near 64.2%, reflecting the region’s large industrial, utility, and grid-expansion base.
• High-voltage power transformer demand is forecast to rise from USD 9.1 billion in 2024 to USD 12.3 billion by 2029.
• Oil-immersed power transformer market value is forecast to rise from USD 21.88 billion in 2024 to USD 35.81 billion by 2032.
This segmentation also explains why average market growth can hide pressure in specific product classes. A shortage in large high-voltage transformers cannot always be solved by capacity in smaller distribution units, and growth in dry-type products does not automatically solve utility transmission needs. Buyers have to match voltage class, insulation design, cooling method, efficiency expectations, monitoring capability, and installation environment. For article readers, this means product mix matters as much as total market size. The most important question is which transformer categories are constrained where demand is rising fastest.
| Segment | Common use case | Demand signal |
|---|---|---|
| Oil-immersed transformers | Utility substations and high-capacity grid use | Transmission, replacement, and power-plant interconnection |
| Dry-type transformers | Buildings, industrial sites, and safer indoor areas | Commercial growth and industrial modernization |
| Smart transformers | Digital substations and remote diagnostics | Grid automation and predictive maintenance |
| High-voltage transformers | Transmission corridors and bulk transfer | Utility capex and long-distance power movement |
| Extra-high-voltage transformers | National or interregional power corridors | Large renewable zones and UHV expansion |
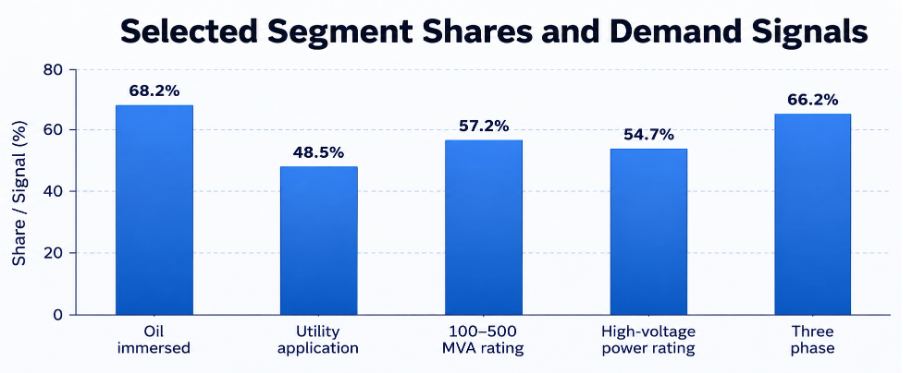
Figure 2. Transformer demand should be segmented by insulation type, voltage level, and application because each segment follows a different investment cycle.
Segment interpretation
The most useful segmentation question is not which product category is largest. It is which product category is exposed to the strongest combination of grid spending, replacement demand, lead-time pressure, and regional growth. Oil-immersed and high-voltage units are especially important because they are deeply tied to utility substations, transmission corridors, and renewable interconnection projects.
Utility, Industrial, Renewable, and Data Center Applications
Power transformers support several end-use markets at the same time. Utilities buy them for transmission, substations, replacement, reliability, and voltage conversion. Renewable developers need them to connect solar, wind, hydro, and storage projects to the grid. Industrial firms need them to support high-load facilities, and data centers need them because digital infrastructure depends on large, stable, redundant power systems. The market therefore behaves like a shared infrastructure category rather than a single-customer equipment category.
Application benchmarks
• Utility applications remain the anchor demand base because transmission systems and substations require large transformers across long planning cycles.
• Renewable power projects create transformer demand at project substations, collection networks, grid-tie points, and step-up stages.
• Grid-scale storage adds another interconnection layer because battery projects still require transformer and substation equipment to connect safely to the grid.
• Industrial demand is strongest where manufacturing, mining, metals, energy production, rail, chemicals, and large process facilities expand or electrify.
• Data centers increase local power requirements and often require substation upgrades, redundancy, backup planning, and grid-capacity coordination.
• Urbanization and infrastructure development increase load density, which can require transformer upgrades even when the broader national grid is not expanding quickly.
• Replacement cycles remain important because many large transformer assets were installed decades ago and now face higher loading than their original design environments.
| Application | What to measure | Why it matters |
|---|---|---|
| Utility transmission | Capex, replacement age, substation additions | Largest long-cycle demand base |
| Renewable power | Capacity additions, interconnection queues, grid connection | Creates step-up and grid-tie transformer demand |
| Industrial facilities | New plants, load requests, electrification programs | Drives site-level high-capacity demand |
| Data centers | Power capacity, redundancy, local grid constraints | Raises demand for dependable high-capacity infrastructure |
| Grid-scale storage | Battery capacity, interconnection points, substation access | Adds transformer demand to clean-energy buildouts |
Application interpretation
Utilities remain the main market owner, but the demand base is widening. Renewable developers, hyperscale data centers, heavy industry, and infrastructure programs increasingly depend on transformer availability. That means transformer shortages can slow projects that appear unrelated on the surface: a solar farm, a semiconductor plant, a data center campus, and a utility reliability upgrade may all be competing for similar grid equipment.
Regional and Country-Level Transformer Intelligence
Regional data is one of the most useful parts of a power transformer market report. Global averages can hide large differences in grid age, renewable capacity, industrial growth, domestic manufacturing, import dependence, procurement timelines, and government infrastructure plans. A strong regional section should explain not only which region is largest, but why demand is rising and what could slow deployment.
North America
North America’s transformer demand is shaped by a rare combination of old infrastructure and new load growth. Utilities are replacing aging assets, hardening grids against extreme weather, connecting renewable projects, and preparing substations for data-center clusters, industrial electrification, and higher electricity use. The United States is especially important because transformer lead times, domestic manufacturing limits, and replacement needs are now directly tied to grid reliability.
North America benchmarks worth tracking
• The United States power transformer market was estimated at USD 2.8 billion in 2024.
• A broader U.S. transformer market forecast places the market near USD 7.91 billion in 2025 and above USD 12 billion by 2031.
• U.S. utilities spent USD 27.7 billion on transmission infrastructure in 2023.
• U.S. utilities spent USD 50.9 billion on distribution infrastructure in 2023.
• U.S. utilities spent USD 7.5 billion on distribution transformers in 2023.
• U.S. distribution transformer investment increased 23% from 2022.
• U.S. substation equipment spending increased 15% from 2022, reaching about USD 6.1 billion in 2023.
| North America signal | What it shows | Market implication |
|---|---|---|
| Aging grid assets | Replacement need is rising | Utilities need earlier procurement planning |
| Data-center load | Power demand is clustering around high-growth locations | Substations and transformers become site-readiness constraints |
| Domestic supply limits | Lead times remain a planning risk | Manufacturing capacity matters as much as demand |
| Renewable interconnection | Transmission and substation upgrades are needed | Transformer demand follows grid connection bottlenecks |
Regional readout
North America shows why transformer demand cannot be measured only by market value. The region has strong demand from replacement, grid resilience, renewables, and data centers, but supply constraints can slow deployment. That makes lead times, utility capital spending, and domestic manufacturing capacity just as important as headline market growth.
Europe
Europe’s transformer demand is tied to energy transition planning, offshore wind, interconnectors, grid reinforcement, and the need to absorb more variable generation. The region is not only adding grid equipment; it is rebuilding electricity routes so renewable generation, industrial load, and cross-border balancing can work together more reliably.
Europe benchmarks worth tracking
• Italy’s grid operator plans more than EUR 23 billion of investment over 2025-2034.
• Germany’s transformer demand is shaped by energy transition planning and grid reinforcement for renewable-heavy regions.
• The United Kingdom’s demand is linked to offshore wind, transmission upgrades, and network reinforcement for net-zero planning.
• France, Italy, and Spain require transformer demand linked to grid modernization, renewable growth, and transmission resilience.
• Eastern Europe’s demand is more heavily tied to modernization, reliability, and replacement of older electricity infrastructure.
• European grid demand is tied to offshore wind zones, interconnectors, renewable connection queues, and cross-border balancing needs.
| Europe signal | What it shows | Market implication |
|---|---|---|
| Offshore wind | Generation is often far from load centers | High-voltage and substation equipment demand rises |
| Interconnectors | Countries need stronger cross-border flows | Transformer demand follows transmission reinforcement |
| Aging networks | Older assets face new load patterns | Replacement and modernization remain steady demand sources |
| Renewable zones | Grid connection timing can limit deployment | Transformer availability becomes part of energy-transition delivery |
Europe readout
Europe’s transformer market is best understood through grid programs rather than one regional average. Germany, the United Kingdom, Italy, France, Spain, and Eastern Europe each have different investment logic. The common theme is that renewable integration needs stronger transmission, better substations, and more reliable equipment replacement.
Asia-Pacific
Asia-Pacific remains the largest demand center because it combines electricity-demand growth, industrial expansion, renewable deployment, transmission buildout, and major national grid programs. China and India are the two most important country stories, while Southeast Asia, Japan, South Korea, and Australia add replacement, reliability, and renewable-integration demand.
Asia-Pacific benchmarks worth tracking
• Asia-Pacific power transformer market value is estimated near USD 9.9 billion in 2024 and above USD 13.6 billion by 2033 in one regional forecast path.
• China’s grid investment plan of USD 574 billion over 2026-2030 makes it one of the largest infrastructure-led transformer demand stories globally.
• China’s UHV buildout supports demand for high-voltage and extra-high-voltage transformer equipment.
• India’s demand is tied to rising electricity consumption, renewable targets, transmission expansion, and distribution-grid reinforcement.
• Japan and South Korea create demand through replacement, reliability, industrial power needs, and grid modernization.
• Australia’s demand is closely connected to renewable zones, long-distance transmission, and grid stability requirements.
• Southeast Asian markets combine electrification, urbanization, industrial load, and renewable additions, creating steady medium-term transformer demand.
| Asia-Pacific signal | What it shows | Market implication |
|---|---|---|
| China UHV investment | Large-scale power transfer remains a national priority | High-voltage transformer demand stays structurally important |
| India load growth | Electricity demand and renewable targets are rising together | Transmission and distribution reinforcement remain central |
| Southeast Asia urbanization | Industrial and city load is expanding | Medium-transformer demand broadens across markets |
| Australia renewable zones | Clean power needs long-distance grid access | Grid-tie and transmission transformers become enabling assets |
Asia-Pacific readout
Asia-Pacific is the scale region, but it should not be treated as one uniform market. China is infrastructure-led, India is growth-and-grid-led, Southeast Asia is electrification-led, and Australia is renewable-zone-led. The shared takeaway is that transformer demand follows both electricity growth and the grid capacity needed to move that electricity.
Latin America, Middle East, and Africa
Latin America, the Middle East, and Africa show where transformer demand can be project-driven rather than evenly distributed. Brazil, Chile, Mexico, Saudi Arabia, the UAE, South Africa, and parts of Sub-Saharan Africa each create different demand pockets through transmission auctions, renewable corridors, industrial load, utility mega-projects, and reliability needs.
Latin America, Middle East, and Africa benchmarks worth tracking
• Brazil remains the most important Latin American transformer market because of transmission auctions, renewable growth, hydropower infrastructure, and industrial demand.
• Chile’s transformer demand is linked to renewable integration and long-distance power movement from resource-rich regions.
• Mexico combines industrial demand, manufacturing growth, nearshoring activity, and grid-capacity needs.
• Saudi Arabia and the UAE create transformer demand through utility mega-projects, renewable programs, industrial development, and large infrastructure plans.
• South Africa’s transformer demand is tied to reliability, grid constraints, maintenance, and replacement of stressed electricity assets.
• Sub-Saharan African markets require transformer investment for electrification, distribution expansion, and basic grid reliability improvements.
| Regional signal | What it shows | Market implication |
|---|---|---|
| Brazil transmission auctions | Grid capacity is expanded through project pipelines | Demand is tied to procurement timing and project awards |
| Chile renewables | Generation zones need long-distance connection | Step-up and transmission equipment demand follows renewable buildout |
| Gulf infrastructure | Utility and industrial projects are concentrated and large | Transformer demand can move in project waves |
| South Africa reliability | Existing grid stress drives replacement and maintenance | Reliability spending becomes a demand signal |
Project-market readout
These regions should be read through project timing, grid reliability, and infrastructure finance. The opportunity is strongest when renewable growth, industrial load, transmission planning, and procurement capacity line up. That is why country-level detail matters more here than broad regional market share.
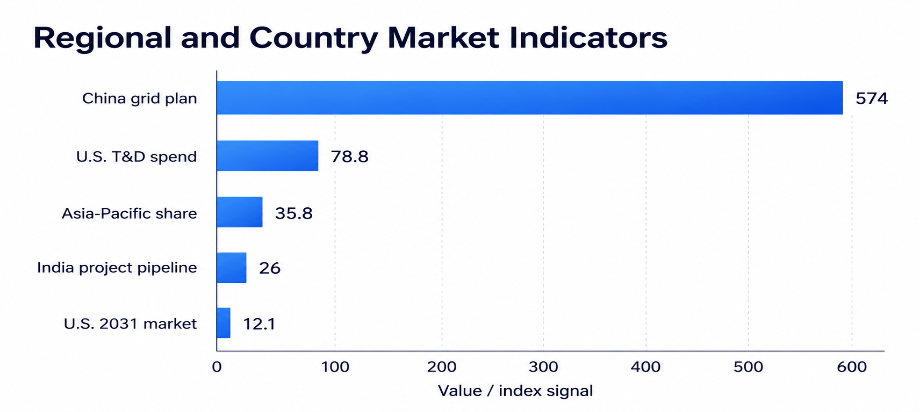
Figure 3. Regional transformer demand should be measured through grid investment, renewable capacity, replacement cycles, and transmission expansion rather than only by global market share.
Country-Level Demand Map
Country-level data keeps the article from becoming too general. A global transformer forecast can say the market is growing, but country-level detail explains how that growth appears in procurement. The United States may show demand through lead times and replacement spending. China may show it through UHV corridors and grid capex. India may show it through transmission expansion. Germany and the United Kingdom may show it through renewables and grid reinforcement. Brazil may show it through auctions and project pipelines.
| Country | Main transformer demand driver | Article angle |
|---|---|---|
| United States | Replacement, grid resiliency, data centers, and shortage pressure | Supply pressure and aging infrastructure |
| China | UHV expansion, renewable integration, and grid investment | Largest infrastructure-led demand base |
| India | Electricity demand growth, renewables, and transmission expansion | Fast-growth grid development market |
| Germany | Energy transition and grid reinforcement | Renewable integration market |
| United Kingdom | Offshore wind and transmission upgrades | Grid connection and network modernization |
| Brazil | Transmission auctions, hydropower, and renewables | Latin America growth anchor |
| Saudi Arabia | Utility mega-projects and industrial load | Middle East infrastructure demand |
| Australia | Renewable zones and long-distance transmission | Grid stability and clean-energy connection |
| South Africa | Reliability constraints and replacement demand | Grid resilience and maintenance pressure |
Country-level interpretation
The strongest country stories often combine demand growth with constraint. A country may have large power demand, but transformer procurement can be slowed by import dependence, factory capacity, permitting, grid planning, or financing. The most useful country-level analysis therefore looks at both sides of the market: the projects that need transformers and the supply system that must deliver them.
Supply Chain, Materials, and Lead-Time Pressure
Supply-chain pressure is one of the most important transformer market themes because demand cannot translate into completed projects unless equipment is available on time. Large power transformers are specialized, heavy, long-cycle assets. They depend on factory capacity, skilled labor, design engineering, electrical steel, copper, transformer oil, transport logistics, and testing capacity. When the supply chain tightens, grid projects, renewable projects, industrial facilities, and data centers can all face delays.
Supply-chain benchmarks worth tracking
• Large power transformer procurement can take up to four years, making early planning essential for utilities and developers.
• Average large transformer lead times have almost doubled since 2021.
• U.S. generator step-up transformer demand increased 274% since 2019.
• U.S. substation transformer demand increased 116% since 2019.
• U.S. transformer prices increased about 80% over a five-year period.
• GSU transformer deliveries have averaged about 143 weeks in shortage conditions.
• U.S. transformer imports increased more than 65% from 2023 to 2024, showing how buyers turn to global supply when domestic capacity is constrained.
• Electrical steel, copper, aluminum, insulation materials, and transformer oil all influence transformer pricing and availability.
• Heavy transport and installation logistics can add complexity because large transformers are difficult to move, store, test, and replace quickly.
The supply-chain section is critical because transformer shortages can change the economics of the whole market. A project may be financially viable and technically approved, but still be delayed if the transformer cannot be delivered on time. Longer delivery windows also force buyers to make decisions earlier, carry more procurement risk, and reserve production slots before final project details are complete. This is why utilities, renewable developers, and large industrial buyers increasingly treat transformer availability as a strategic planning issue rather than a standard purchasing task.
| Supply-chain issue | What it affects | Market impact |
|---|---|---|
| Long lead times | Project schedules | Delays grid, renewable, data-center, and industrial projects |
| Electrical steel supply | Transformer cores | Raises procurement risk and efficiency constraints |
| Copper and aluminum prices | Windings and materials | Affects transformer pricing and bid margins |
| Factory capacity | Large transformer output | Extends delivery windows when demand rises |
| Import dependence | Availability and resilience | Encourages localization and domestic production |
| Heavy transport | Delivery and installation | Raises logistics cost and replacement complexity |
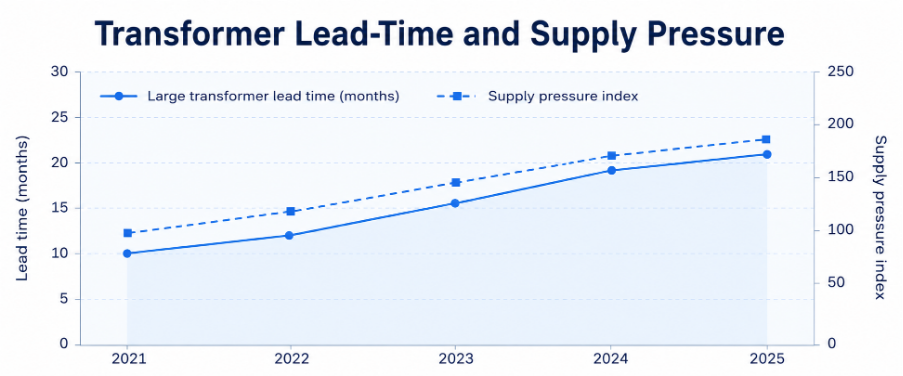
Figure 4. Transformer lead times, material pressure, and manufacturing capacity now affect project schedules as much as demand growth.
Supply-chain interpretation
Transformer demand is not only about the number of grid projects. Availability, lead time, material inputs, factory capacity, transport, and testing all shape whether projects can actually move from planning to energization. A strong market analysis should therefore treat supply risk as a demand modifier, not as a separate footnote.
Reliability, Replacement, and Grid Resilience
Replacement demand is different from new-build demand because it is tied to the asset condition of the existing grid. Transformers can operate for decades, but aging insulation, thermal loading, moisture, extreme weather, oil quality, mechanical stress, and short-circuit events all affect useful life. Utilities need to decide which assets can continue operating safely and which assets create unacceptable outage, safety, and financial risk.
Reliability benchmarks and replacement signals
• Many large transformers operate for several decades, which means asset age is useful but not sufficient for estimating replacement need.
• Load growth can shorten asset life when transformers operate closer to capacity for longer periods.
• Thermal stress, insulation health, moisture, and oil condition are central indicators of transformer risk.
• Extreme weather increases replacement and hardening demand where substations face flooding, heat, wildfires, storms, or physical damage.
• Monitoring systems can improve replacement planning by identifying rising temperature, partial discharge, oil-quality issues, or abnormal loading patterns.
• The cost of transformer failure is not limited to equipment replacement; it can include outages, emergency procurement, customer disruption, and delayed grid projects.
Reliability planning also plays an important role in assessing transformer market demand. A transformer that remains operational may still present significant risk if it is overloaded, exposed to extreme temperatures, affected by deteriorating insulation, or serving a critical load center with limited backup capacity. Utilities therefore evaluate more than asset age when making replacement decisions. Factors such as oil condition, thermal history, moisture levels, load patterns, fault exposure, and maintenance records help determine whether equipment should be monitored, refurbished, derated, or replaced. This creates opportunities not only for new transformer installations but also for diagnostics, condition monitoring, maintenance, and lifecycle services, with tools such as a receipt maker helping service providers organize related transaction records.
| Risk area | What to measure | Why it matters |
|---|---|---|
| Aging assets | Installed age and load history | Indicates replacement priority |
| Thermal stress | Temperature and load profile | Affects transformer life |
| Moisture and oil condition | Insulation health | Predicts failure risk |
| Extreme weather | Flood, heat, wildfire, and storm exposure | Raises resilience investment |
| Monitoring gaps | Sensor and diagnostics coverage | Limits predictive maintenance |
| Outage impact | Critical load and restoration time | Connects reliability risk to business value |
Reliability interpretation
Replacement demand is not driven only by age. It is shaped by load conditions, external risk, maintenance history, and the value of uninterrupted service. A transformer serving a critical substation, industrial cluster, hospital district, or data-center corridor can carry a much higher resilience priority than a similar unit in a lower-risk location.
Power Transformer Market Diagnostic
A polished market benchmark should help a reader decide what to look at next. The useful question is not only whether the market is growing. It is where growth is concentrated, which product categories are constrained, which regions face procurement pressure, and how reliability risk turns into replacement demand. The diagnostic model below links the main statistics to practical market signals.
| Problem area | Core signals to measure | Useful benchmark from this report |
|---|---|---|
| Grid expansion | Transmission capex, substation additions, renewable zones | Grid investment above USD 400B and rising transmission needs |
| Replacement cycle | Asset age, failure risk, refurbishment backlog | Aging infrastructure increases replacement demand |
| Supply pressure | Lead time, backlog, material availability | Large transformer procurement can take up to four years |
| Regional demand | Country grid plans, renewable targets, industrial load | Asia-Pacific, North America, and Europe lead demand |
| Technology shift | Monitoring, efficiency, digital substations | Smart transformer adoption grows with grid automation |
| Application pressure | Data centers, renewables, industrial load | High-load users compete for utility-grade equipment |
Market diagnostic rule
A strong transformer market analysis separates demand volume from delivery risk. A country may show high growth potential, but long lead times, manufacturing bottlenecks, or material shortages can slow actual deployment. The best scorecard looks at market size, regional plans, transformer type, supply availability, and reliability pressure together.
90-Day Power Transformer Market Research Plan
Statistics become useful when they are translated into a repeatable research workflow. For power transformers, the first step is to validate market size and regional demand. The second is to organize segments, applications, and supply-chain constraints. The third is to turn the findings into a scorecard that can support content planning, investment analysis, or market positioning.
| Timing | What to do | Output |
|---|---|---|
| Days 1-30 | Validate market size, CAGR, regional shares, and country-level grid investment. | Clean benchmark base for the article. |
| Days 31-60 | Build section-level stats for product type, voltage, application, supply chain, and renewables. | Strong body sections with tables and graphs. |
| Days 61-90 | Review final data logic, remove weak stats, add interpretation boxes, and polish visuals. | Production-ready statistics article. |
Planning principle
The article should not chase every available market number. It should prioritize statistics that explain why transformer demand is rising, where demand is strongest, which segments are growing, and what risks may slow delivery. That keeps the article close to a decision-style report rather than a raw database.
Metrics Power Transformer Market Readers Should Track
The final market scorecard should be detailed enough to locate the demand signal without becoming a vanity dashboard. These metrics help separate global growth from practical project risk.
| Metric | Why it matters |
|---|---|
| Market size | Shows total revenue opportunity. |
| CAGR | Shows growth speed. |
| Regional share | Shows where demand is concentrated. |
| Grid investment | Indicates future transformer procurement. |
| Renewable capacity additions | Signals step-up and interconnection needs. |
| Transmission expansion | Shows high-voltage transformer demand. |
| Utility capex | Shows replacement and expansion budgets. |
| Lead times | Shows supply-chain tightness. |
| Material prices | Affects transformer pricing and margins. |
| Manufacturing capacity | Indicates whether supply can meet demand. |
| Transformer age | Helps estimate replacement demand. |
| Failure and outage risk | Shows reliability investment pressure. |
Power Transformers Market Statistics FAQ
Common questions
• What is the current size of the power transformers market?
The global power transformer market is commonly estimated in the USD 25 billion to USD 30 billion range for the mid-2020s, depending on category definition. One benchmark places the market at USD 28.88 billion in 2024, while another places it at USD 24.78 billion in 2025.
• How fast is the power transformers market growing?
Most current forecasts point to mid-single-digit growth, with major estimates around 6% to 7% CAGR through the late 2020s or early 2030s. Growth is supported by grid expansion, renewables, replacement demand, and electrification.
• Which region leads the power transformers market?
Asia-Pacific is the largest demand center because China, India, Southeast Asia, Japan, South Korea, and Australia all create different forms of grid investment and transformer demand.
• What is driving power transformer demand?
The main drivers are grid modernization, renewable integration, transmission expansion, data-center power demand, industrial electrification, EV infrastructure, and replacement of aging grid assets.
• Why are power transformer lead times increasing?
Lead times are rising because demand is increasing while manufacturing capacity, electrical steel, copper, specialized labor, heavy logistics, and testing capacity remain constrained. Large power transformer procurement can take up to four years.
• Which transformer type has the largest market share?
Oil-immersed transformers are one of the largest categories because they are widely used in utility, high-voltage, and high-capacity applications. Several market views place oil-immersed share above 60%.
• How do renewables affect power transformer demand?
Renewable projects require step-up transformers, grid-tie substations, collector systems, and transmission access. Solar, wind, offshore wind, hydro, and storage projects therefore increase transformer demand even when they use different project designs.
• What metrics matter most when analyzing this market?
The most useful scorecard includes market size, CAGR, regional share, grid investment, renewable additions, transmission expansion, utility capex, lead times, material costs, manufacturing capacity, transformer age, and outage risk.
Final Takeaway
Power transformer market statistics point to one practical conclusion: transformer demand is now connected to nearly every major electricity trend. Grid modernization, renewable energy integration, industrial electrification, data-center expansion, EV infrastructure, and energy security all depend on reliable transformer capacity. The market is growing because electricity systems are expanding, but the biggest challenge is whether transformer supply can keep pace with that expansion.
The most important conclusion is that transformer statistics should be read as grid-readiness indicators. Strong market growth signals investment, but it also reveals strain: equipment queues, material exposure, planning delays, and the need for better long-term procurement. Countries that expand renewable energy, electrify industry, and attract data-center load will need transformer capacity to arrive on time. Manufacturers that can deliver reliable high-voltage equipment, service support, and monitoring capability will be positioned where the market pressure is strongest.
The market opportunity is broad, but it is not evenly distributed. Asia-Pacific carries scale through China and India. North America carries replacement, resilience, and shortage pressure. Europe carries offshore wind, interconnectors, and grid modernization. Latin America and the Middle East show project-led demand through transmission buildout, renewable integration, utility megaprojects, and industrial load. Those regional differences matter because transformer demand is always tied to actual grid plans, not only to global forecasts.
From a market-planning viewpoint, the strongest signal is not only where spending is rising, but where projects can actually be delivered. Regions with grid budgets, renewable pipelines, domestic equipment capacity, and predictable procurement windows will convert demand into completed infrastructure faster than regions with only headline forecasts. For utilities, developers, and manufacturers, the practical lesson is to track transformer availability alongside market value. The most resilient opportunities will appear where replacement cycles, substation expansion, and manufacturing readiness move together.
For market readers, the strongest approach is to connect demand signals with delivery risk. A rising market forecast is useful, but it becomes much more valuable when paired with lead times, material costs, manufacturing capacity, replacement cycles, and project pipelines. The strongest power transformer markets are not simply the ones with the largest forecast numbers. They are the markets where grid investment, renewable integration, reliability needs, and equipment availability are aligned well enough to turn demand into completed infrastructure.


