Ketogenic diet foods have moved beyond a strict weight-loss niche. They now sit inside a wider shift toward low-carb eating, sugar reduction, high-protein snacking, metabolic health, and convenient diet-specific packaged foods. Consumers are not only buying keto products to follow a formal ketogenic meal plan. Many are using keto-labeled foods as quick signals for lower carbohydrates, higher fat, better satiety, and reduced sugar.
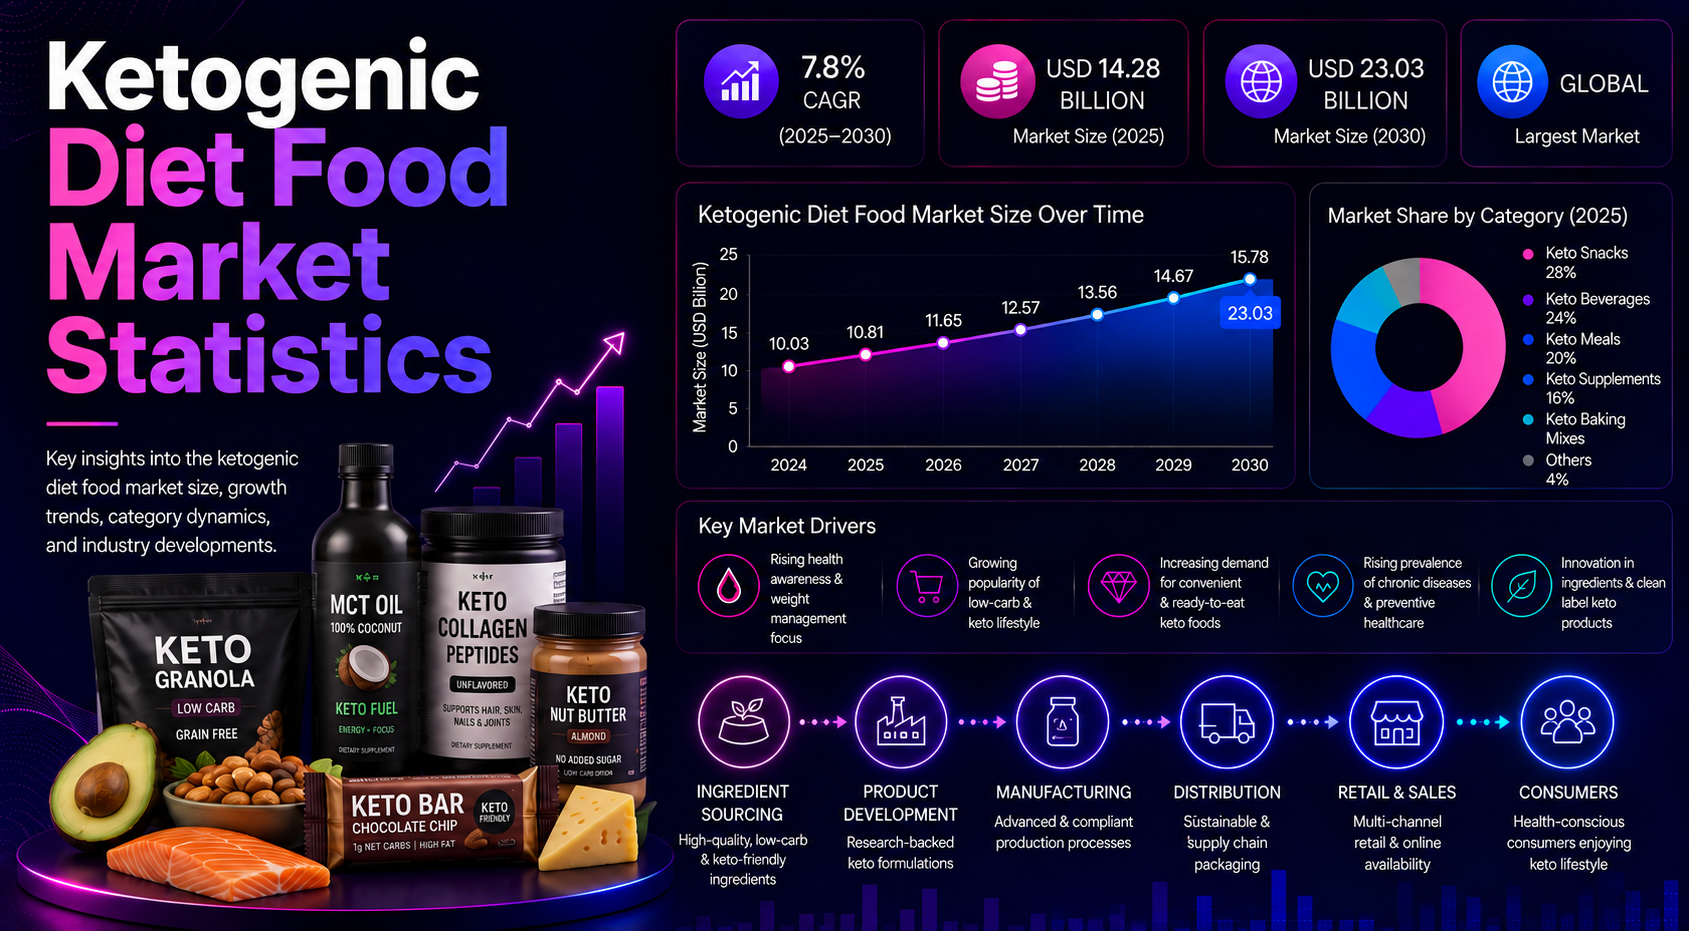
The strongest numbers show a market that is still smaller than the broader health-and-wellness foods industry, but commercially meaningful. Grand View Research estimates the global ketogenic diet market at USD 13.16 billion in 2025 and projects it to reach USD 20.75 billion by 2033. Fortune Business Insights places the category higher, at USD 17.18 billion in 2025 and USD 35.81 billion by 2034. Across those estimates, the direction is consistent: keto foods are growing because shoppers continue to look for structured ways to manage carbohydrates, weight, blood sugar awareness, and everyday snacking habits.
The category is broad. Supplements, snacks, beverages, bakery substitutes, nuts, meat, meal replacements, and online retail all contribute to the market. North America holds the largest regional share, Europe remains important because of sugar reduction and clean-label expectations, and Asia Pacific has one of the strongest growth profiles as urban consumers become more familiar with low-carb and packaged nutrition formats. The practical signal is that keto foods now compete on habit replacement, not only on diet identity.
Executive Ketogenic Diet Food Benchmarks
These are the statistics that frame the market. They show the size of keto demand, the strength of supplements and packaged foods, the regional spread, and the difference between a strict diet trend and a broader low-carb eating pattern.
The numbers that define the ketogenic diet food market
• Grand View Research estimates the global ketogenic diet market at USD 13.16 billion in 2025.
• The same forecast projects the market will reach USD 20.75 billion by 2033.
• Grand View Research expects the market to grow at a 5.9% CAGR from 2026 to 2033.
• Fortune Business Insights places the keto market at USD 17.18 billion in 2025 and projects USD 35.81 billion by 2034.
• Mordor Intelligence estimates the ketogenic diet food market at USD 13.08 billion in 2025 and USD 17.88 billion by 2031.
• North America accounted for 37.5% of global ketogenic diet revenue in 2025.
• Europe represented 28.4% of global ketogenic diet revenue in 2025.
• Asia Pacific represented 20.9% of global ketogenic diet revenue in 2025 and is expected to grow at a 6.5% CAGR through 2033.
• Supplements led the ketogenic diet market with a 58.3% revenue share in 2025.
• Supermarkets and hypermarkets held 46.9% of ketogenic diet food distribution in 2023.
• Online ketogenic diet sales are expected to grow at the fastest 5.7% CAGR from 2026 to 2033.
• Worldwide, 2.5 billion adults were overweight in 2022, while more than 890 million adults were living with obesity.
• The IDF Diabetes Atlas reports 589 million adults aged 20 to 79 living with diabetes worldwide in 2024.
• The global health and wellness foods market was valued at USD 1,015.0 billion in 2025, giving keto products a much larger wellness context.
Editorial readout
The strongest ketogenic diet food statistics point to a market that is not supported by one trend alone. Keto demand is shaped by weight management, sugar reduction, high-protein eating, digestive tolerance, online retail, and the convenience of low-carb replacements for familiar foods. A keto snack, shake, bread, or supplement is strongest when it solves a specific eating problem rather than simply carrying the keto label.
Why Ketogenic Diet Foods Carry Global Market Momentum
Keto food demand has become more durable because it overlaps with several mainstream food behaviors. Consumers may move in and out of strict ketogenic dieting, but low-carb snacking, sugar-free sweets, protein-rich shakes, and carb-replacement bakery products remain familiar parts of the better-for-you food aisle. That gives the category a wider base than a single diet cycle.
Market estimates vary by source because some studies count supplements and meal replacements more broadly, while others focus on keto foods and packaged diet products. Grand View Research uses a 2025 estimate of USD 13.16 billion and a 2033 forecast of USD 20.75 billion. Fortune Business Insights uses a larger 2025 base of USD 17.18 billion and a 2034 forecast of USD 35.81 billion. The useful signal is not the exact midpoint. The useful signal is that multiple models place the market in the low-to-mid tens of billions and expect continued expansion.
Market-size and wellness-context benchmarks
• Market.us placed the keto market at USD 10.60 billion in 2023 and projected USD 18.50 billion by 2033.
• Market Research Future placed the market at USD 11.09 billion in 2024 and projected USD 20.31 billion by 2035.
• Sky Quest placed the keto market at USD 10.71 billion in 2024 and projected USD 17.57 billion by 2033.
• Business Research Insights estimated USD 15.73 billion in 2026 and USD 28.14 billion by 2035.
• UC Davis IIFH described the addressable market for keto diet products as roughly USD 11-12 billion in 2022.
• The health and wellness foods market is projected to reach USD 2,031.1 billion by 2033, which keeps keto foods inside a much larger wellness-food spending pool.
The market context changes the way keto foods should be measured. Keto products do not compete only with other keto-labeled products. They also compete with low-sugar snacks, high-protein foods, gluten-free bakery, sports nutrition, and weight-management foods. The broader consumer motivation is simple: familiar foods with fewer carbohydrates and clearer nutrition tradeoffs.
This wider competitive set matters because a keto brand does not only fight for shelf space against other keto brands. It competes with protein bars, diabetic-friendly foods, gluten-free products, low-sugar snacks, meal replacements, sports nutrition, and premium wellness foods. Strong products are usually those that make the keto benefit clear without forcing consumers to understand every technical detail of ketosis.
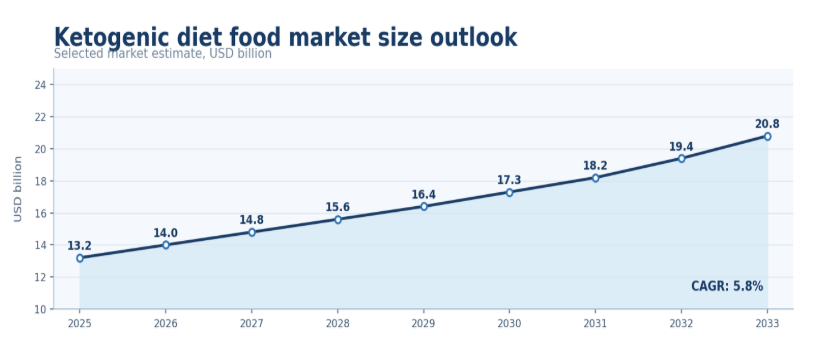
Figure 1. Ketogenic diet food market growth should be reviewed alongside low-carb, weight-management, and sugar-reduction demand because keto products increasingly serve broader better-for-you eating habits.
Product Category Statistics
Keto product demand is strongest where a food replaces a high-carb habit. Bread, cookies, chips, sweets, shakes, and snacks matter because they are everyday eating occasions. Supplements matter because many consumers also connect keto with fitness, satiety, ketosis support, and metabolic routines.
Keto snack benchmarks
• Snacks are repeatedly cited as the fastest-growing keto product segment in North America, Europe, Asia Pacific, Canada, the United Kingdom, Germany, Italy, Spain, France, India, China, Japan, Australia, South Korea, and Brazil.
• Keto snack growth is strongest when products replace familiar high-carb moments such as chips, cookies, chocolate, bars, and on-the-go bites.
• The snack opportunity is also tied to portion control, low-sugar labeling, and high-protein positioning, not only to strict carbohydrate counting.
• Brands that make keto snacks taste closer to mainstream snacks can reach consumers who want low-carb convenience without building every meal around a formal diet plan.
Keto supplement benchmarks
• Supplements led the ketogenic diet market with a 58.3% revenue share in 2025.
• A separate 2023 keto diet food segmentation placed supplements at 48.5% of revenue.
• Based on the 58.3% share, supplement-led keto demand represents about USD 7.67 billion of global demand in 2025.
• That same supplement estimate rises to about USD 12.14 billion by 2033 and USD 13.61 billion by 2035.
• Keto supplement demand growth of 39.2% is highlighted as a future market opportunity.
Keto beverages, bakery, and natural food benchmarks
• Keto beverages are tracked as a dedicated segment because shakes, ready-to-drink products, MCT beverages, and protein drinks help translate keto into on-the-go routines.
• Keto-ready meals and low-carb staples are named packaged product segments, showing that the market is moving beyond supplements alone.
• The meat segment was valued at USD 2.50 billion in the 2024 ketogenic diet market.
• The fruits segment was valued at USD 1.50 billion in 2024 and is projected to reach USD 2.80 billion by 2035.
• The nuts segment was valued at USD 1.00 billion in 2024 and is projected to reach USD 1.80 billion by 2035.
The product mix shows why keto foods are not a single shelf. Supplements often lead market estimates because they are easier to define as keto products and carry premium pricing. Snacks and bakery substitutes are different. They are everyday-food replacements, so their long-term value depends on whether consumers accept the taste and texture compared with conventional products.
Beverages play a different role again. Keto shakes, coffee-based drinks, and ready-to-drink products are often used for satiety, meal replacement, or convenience. Their success is tied not only to carbohydrate count but also to protein level, fat source, sugar content, and whether the drink fits a morning routine, gym routine, or workday schedule.
| Product type | Market role |
|---|---|
| Keto snacks | Low-carb replacements for chips, bars, cookies, and sweets. |
| Keto supplements | Ketosis support through MCT oil, powders, and exogenous ketones. |
| Keto beverages | Convenient low-carb meal support and satiety. |
| Keto bakery | Bread, dessert, and tortilla replacement. |
| Frozen keto meals | Meal planning and convenience. |
| Nuts and seeds | Natural keto-friendly snacking. |
Product-category readout
Keto food demand becomes more practical when products replace a familiar eating habit. Snacks, bread, sweets, shakes, and ready meals are important because they make low-carb behavior easier to repeat. Supplements may lead revenue, but repeat food purchasing depends heavily on taste, texture, price, and convenience.
Consumer Health and Diet Demand
Keto foods are often marketed around weight management, but the underlying demand is broader. Consumers use low-carb foods to manage sugar intake, build higher-protein routines, reduce refined carbohydrates, and find alternatives that feel more structured than general healthy eating. That makes the category closely connected to obesity, diabetes, fitness, and preventive wellness statistics.
Weight and metabolic-health demand benchmarks
• In 2022, 2.5 billion adults worldwide were overweight.
• More than 890 million adults were living with obesity in 2022.
• The global adult overweight prevalence reached 43% in 2022.
• Global adult obesity prevalence reached 16% in 2022.
• About 35 million children under age five were overweight in 2024.
• U.S. adult obesity prevalence was 40.3% during August 2021 to August 2023.
• U.S. adult obesity prevalence was 39.2% among men and 41.3% among women during the same period.
• CDC reported obesity prevalence of 44.3% among U.S. adults aged 40-59 years in 2017-March 2020.
• Across 13 OECD countries with measured data, 60% of people aged 15 and over were overweight or obese in 2023.
• Across 32 OECD countries, 54% of adults were overweight or obese in 2021.
Diabetes and blood-sugar awareness also sit behind low-carb demand, even when products are not positioned as medical foods. IDF reports 589 million adults aged 20 to 79 living with diabetes worldwide in 2024 and projects 853 million by 2050. Diabetes was associated with at least USD 1 trillion in health expenditure in 2024, which explains why carbohydrate awareness has become part of mainstream wellness language.
These health drivers should be handled carefully. Keto foods are not medical products, and consumer needs vary widely. Still, the overlap with weight, sugar, and metabolic-health conversations helps explain why low-carb products remain visible even when the popularity of strict dieting changes. Shoppers may move away from formal keto tracking but continue buying sugar-free snacks, low-carb bread, protein bars, and reduced-carbohydrate meal options.
| Consumer need | Keto food response |
|---|---|
| Weight management | Low-carb meals, snacks, and shakes. |
| Sugar reduction | Sugar-free sweets, bakery, and beverages. |
| Convenience | Bars, shakes, frozen meals, and packaged snacks. |
| Fitness nutrition | Protein-rich snacks and supplements. |
| Blood sugar awareness | Low-glycemic and low-net-carb products. |
Consumer demand interpretation
Not every keto buyer follows strict ketogenic macros. Many use keto-labeled foods as a shortcut for lower carbs, reduced sugar, or higher protein. That widens the addressable market, but it also raises the importance of clear labeling and credible benefits.
Ingredient and Formulation Trends
Keto formulation is difficult because the products must reduce carbohydrates without losing the sensory qualities consumers expect from bread, snacks, sweets, and drinks. That is why ingredient strategy is central to the market. The strongest keto products usually solve three problems at once: lower net carbs, acceptable taste, and a texture that can compete with mainstream alternatives.
Common keto ingredient systems
• Almond flour and coconut flour are common low-carb bakery bases because they replace wheat flour in breads, cookies, and dessert-style products.
• MCT oil is important in keto beverages, powders, coffee products, and supplements because it links the category with high-fat energy routines.
• Stevia, monk fruit, and erythritol are widely used to support sugar reduction in keto sweets and beverages.
• Whey protein, collagen, egg protein, and dairy proteins connect keto products with satiety and fitness nutrition.
• Nuts and seeds support keto snacks because they provide fat, texture, and a cleaner ingredient story.
• Fiber blends help keto bakery and snack products improve texture while managing net-carbohydrate positioning.
• Avocado oil, coconut oil, butter, cream, and cheese help support high-fat formulations in both packaged and whole-food keto occasions.
Formulation is where many keto products win or fail. Low-carb bakery must create softness without wheat flour, snacks must create crunch without starch-heavy bases, and sweets must deliver sweetness without sugar. That makes ingredient systems more complex than the front label suggests. Fiber blends, protein systems, fats, nut flours, and alternative sweeteners often have to work together so the final product feels normal enough for repeat purchase.
Ingredient credibility is also important. A product can technically fit a keto macro target while still feeling overprocessed or difficult to digest. Brands that balance low net carbs with simple ingredient cues, acceptable sweetness, and familiar taste profiles are better positioned than products that rely only on a keto badge.
| Ingredient trend | Keto function |
|---|---|
| Almond flour | Low-carb bakery base. |
| MCT oil | Fat support for drinks, powders, and supplements. |
| Monk fruit and stevia | Sugar reduction. |
| Whey and collagen | Protein and satiety support. |
| Nuts and seeds | Healthy fats and texture. |
| Fiber blends | Texture and net-carb control. |
Ingredient rule
The most defensible keto products do not rely only on a low-carb claim. They combine acceptable taste, digestive tolerance, clear net-carb logic, and ingredients that match the consumer’s reason for buying: convenience, satiety, sugar reduction, fitness support, or meal planning.
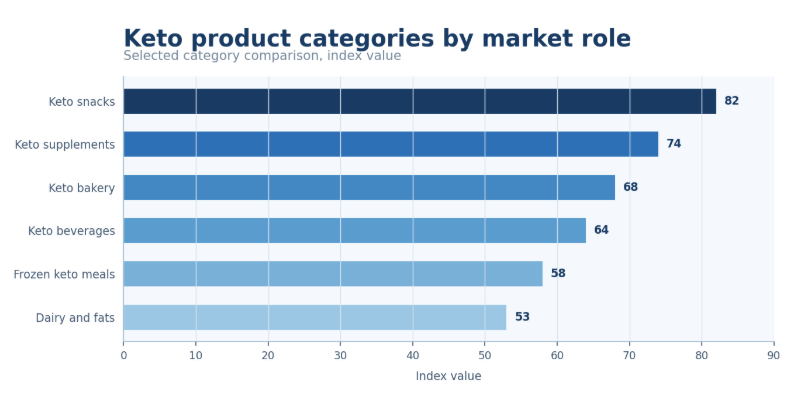
Figure 2. Keto product demand is strongest where low-carb foods replace everyday habits such as snacking, bakery products, beverages, and convenient meal support.
Regional Ketogenic Diet Food Intelligence
Regional data is one of the most useful ways to understand the ketogenic diet food market. Global estimates can hide major differences in diet culture, packaged food adoption, obesity prevalence, regulatory expectations, and willingness to pay for premium low-carb products.
North America
North America remains the strongest keto region because low-carb diets are already familiar, packaged diet products are widely available, and consumers are accustomed to protein bars, supplements, meal replacements, and specialty diet claims. Grand View Research places North America at USD 4,936.6 million in 2025 and projects USD 7,663.4 million by 2033. The region represented 37.5% of global ketogenic diet revenue in 2025 and is expected to grow at a 5.7% CAGR from 2026 to 2033.
Europe
Europe is smaller than North America but still commercially important. The region generated USD 3,740.0 million in ketogenic diet revenue in 2025 and is projected to reach USD 5,943.6 million by 2033. Its expected 6.0% CAGR is supported by sugar reduction, weight management, better-for-you packaged foods, and growing interest in protein-rich snacks. Clean-label expectations and credible health positioning matter more in Europe than in markets where diet labels can carry the product alone.
Asia Pacific
Asia Pacific is one of the strongest growth regions because urban wellness demand, ecommerce, fitness culture, and packaged nutrition are expanding together. The region reached USD 2,750.0 million in 2025 and is projected to reach USD 4,532.9 million by 2033. Its 6.5% CAGR is higher than North America and Europe, but success depends on education and localization. Keto products may need to be positioned as low-carb snacks, sugar-reduced foods, or weight-management options rather than as a direct copy of Western keto dieting.
Latin America
Latin America has a meaningful keto opportunity because weight-management demand and modern retail are expanding, but affordability and accessibility are major constraints. Brazil generated USD 432.7 million in ketogenic diet market revenue in 2025 and is projected to reach USD 667.7 million by 2033. Keto supplements were the largest Brazilian product segment in the source base year, while snacks are cited as the fastest-growing segment through 2033.
Middle East and Africa
Middle East and Africa demand is shaped by urban wellness, premium retail, diabetes awareness, and online specialty nutrition. The IDF regional data shows 85 million adults with diabetes in the Middle East and North Africa and 25 million in Africa in 2024. That does not automatically translate into keto food demand, but it does explain why sugar reduction and metabolic-health positioning can gain attention in urban markets.
The regional pattern shows why one global keto strategy is too broad. North America can support wide product variety because shoppers are already familiar with low-carb language. Europe requires more careful claim discipline and stronger clean-label positioning. Asia Pacific may need more education and localized formats because staple diets, taste expectations, and meal structures differ significantly across countries.
| Region | Ketogenic diet food implication |
|---|---|
| North America | Strongest fit for packaged keto snacks, supplements, meal replacements, and online retail. |
| Europe | Clean label, sugar reduction, and credible health positioning are important. |
| Asia Pacific | Growth depends on education, urban demand, and localized low-carb formats. |
| Latin America | Weight-management demand exists, but pricing and retail access matter. |
| Middle East & Africa | Premium keto products can grow in urban markets with obesity and diabetes concerns. |
Regional interpretation
The best regional view separates market maturity from growth speed. North America has the strongest established demand, Europe rewards credible positioning, and Asia Pacific offers faster growth but requires education and localization.
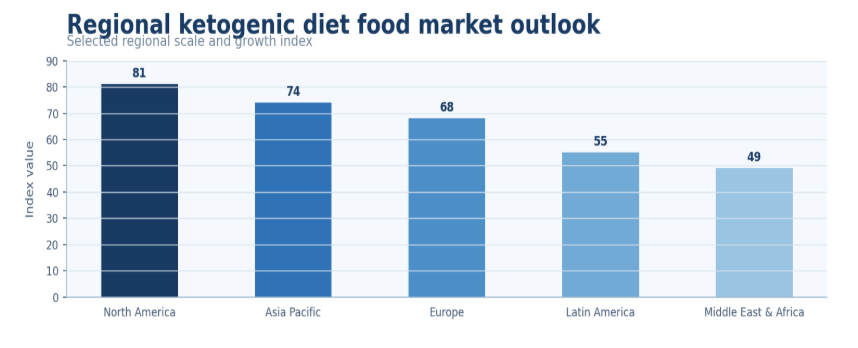
Figure 3. Regional performance should be viewed through both scale and growth potential because keto demand is shaped by low-carb awareness, retail access, and health-driven eating habits.
Country-Level Ketogenic Diet Food Statistics
Country-level data shows how uneven keto demand can be. A market can have strong wellness demand but weak keto education, or strong online nutrition sales but limited mainstream grocery access. The most useful country view is therefore not only the market size. It is the combination of revenue base, expected growth, product format, and consumer understanding.
Country demand signals
• The United States held the largest country-level share of the ketogenic diet market in 2025.
• Canada generated USD 552.9 million in 2025 and is projected to reach USD 944.1 million by 2033, with a 6.9% CAGR.
• The United Kingdom generated USD 733.8 million in 2025 and is projected to reach USD 1,156.6 million by 2033.
• Germany generated USD 535.9 million in 2025 and is projected to reach USD 837.5 million by 2033.
• Italy generated USD 583.4 million in 2025 and is projected to reach USD 892.0 million by 2033.
• Spain generated USD 478.7 million in 2025 and is expected to grow at a 7.1% CAGR through 2033.
• France generated USD 456.0 million in 2019 and is projected to reach USD 738.6 million by 2027.
• India generated USD 493.9 million in 2025 and is projected to reach USD 828.6 million by 2033.
• China generated USD 698.5 million in 2025 and is projected to reach USD 1,140.5 million by 2033.
• Japan generated USD 420.8 million in 2025 and is expected to grow at a 7.0% CAGR through 2033.
• South Korea generated USD 316.3 million in 2025 and is expected to grow at a 7.2% CAGR through 2033.
• Australia generated USD 379.5 million in 2025 and is projected to reach USD 582.0 million by 2033.
• Brazil generated USD 432.7 million in 2025 and is projected to reach USD 667.7 million by 2033.
Country-level sizing should be read together with product fit. A large revenue base does not automatically mean every keto category will work. In one country, supplements and powders may be the easiest entry point. In another, low-carb bakery, snacks, or sugar-free sweets may be more relevant because they replace daily foods that consumers already buy.
Local food culture matters. Keto bread is more difficult to position in markets where bread quality and tradition are central to eating habits. Keto snacks may move faster where packaged snacking is already common. Keto beverages may be easier to grow where protein drinks, meal replacements, and functional coffees already have consumer familiarity.
| Country | Keto market signal |
|---|---|
| United States | Strong demand across snacks, supplements, beverages, and low-carb bakery. |
| Canada | Smaller market but aligned with wellness and low-carb online shopping. |
| United Kingdom | Sugar reduction and better-for-you packaged foods support keto demand. |
| Germany | Clean-label expectations shape keto snacks and supplements. |
| France | Taste, trust, and credible health positioning matter. |
| Italy | Low-carb replacement products must fit traditional eating habits. |
| Spain | Wellness and fitness trends support snacks and beverages. |
| China | Ecommerce and market education are important. |
| India | Urban wellness demand supports snacks and supplements. |
| Japan | Mature functional-food culture supports selective keto products. |
| South Korea | Fitness and premium wellness positioning can support demand. |
Country-level rule
Keto market strategy should not rely on global averages. Some countries are driven by fitness and supplements, others by sugar reduction, ecommerce, obesity awareness, or premium wellness retail. Country-level fit matters as much as overall market growth.
Distribution Channel and Retail Statistics
Keto foods need both credibility and access. Specialty nutrition channels can educate early adopters, but mainstream growth usually requires supermarkets, hypermarkets, online retail, and easy repeat purchasing. The channel mix also differs by product. Supplements and MCT oils work well online and in health stores, while snacks, shakes, and low-carb bakery products need visible everyday placement.
Retail and ecommerce access benchmarks
• Supermarkets and hypermarkets held 46.9% of ketogenic diet food distribution in 2023.
• Store-based ketogenic diet distribution was valued at USD 6.64 billion in 2024.
• Based on the published supermarket/hypermarket share, the channel represented about USD 5.55 billion of keto diet food retail channel value in 2025.
• That same supermarket/hypermarket channel estimate rises to about USD 8.65 billion by 2033.
• Non-store-based ketogenic diet distribution is expected to reach USD 8.31 billion by 2035.
• Online ketogenic diet sales are expected to grow at the fastest 5.7% CAGR from 2026 to 2033.
| Channel | Why it matters |
|---|---|
| Supermarkets and hypermarkets | Give keto products mainstream visibility and support routine household buying. |
| Specialty health stores | Useful for supplements, MCT oil, electrolytes, and premium diet products. |
| Online retail | Supports niche keto brands, subscriptions, reviews, and long-tail product discovery. |
| Pharmacies | Important for weight-management and metabolic-health positioning. |
| Fitness stores | Strong fit for keto supplements, protein products, and meal replacements. |
| Convenience retail | Useful for keto bars, snacks, and ready-to-drink products. |
Channel interpretation
Keto food sales depend on trust and accessibility. Supermarkets make the category visible to mainstream consumers, while online channels help committed low-carb buyers find specialized products that may not yet have broad shelf space.
Brand, Innovation, and Competitive Landscape
Innovation in keto foods is moving in two directions at once. One side focuses on strict keto support through supplements, MCTs, powders, electrolytes, and meal replacement. The other side focuses on mainstream eating occasions: bread, snacks, desserts, bars, beverages, and frozen meals with lower carbohydrate counts.
Competitive and innovation benchmarks
• Danone SA and Nestle SA appear as named participants or relevant companies in ketogenic diet market coverage.
• Perfect Keto, Metrologic, Privat, Bulletproof, Keto Chow, Keto and Co, Quest Nutrition, and Love Good Fats are also named in competitive coverage.
• Keto-ready meals are tracked as a packaged product segment in market analysis.
• Low-carb staples are tracked as a packaged keto food segment.
• Keto beverages are included as a dedicated product segment, creating room for shakes, coffee-based drinks, and ready-to-drink nutrition.
Innovation should not be measured only by novelty. Many keto launches fail because they solve a macro target but do not solve a real eating moment. A low-carb cookie that tastes too different, a bread that does not toast well, or a shake that feels too heavy can attract trial but struggle to hold repeat demand. The best innovations are usually familiar foods rebuilt around lower carbohydrates without asking consumers to accept too many tradeoffs.
Private label can also change the category. As supermarkets add more low-carb and keto-friendly options, price gaps may narrow and trial may become easier. That can help the category move beyond committed keto shoppers toward consumers who simply want lower-sugar or more controlled packaged foods.
| Innovation area | Market impact |
|---|---|
| Keto bakery | Helps replace bread, cookies, tortillas, and dessert occasions. |
| Sugar-free sweets | Connects keto with broader sugar-reduction demand. |
| MCT products | Supports beverages, powders, coffee products, and supplements. |
| High-protein keto | Links keto with sports nutrition, satiety, and meal replacement. |
| Frozen keto meals | Makes keto easier for daily meal planning. |
| Private-label keto | Can make the category more affordable and mainstream. |
Pricing, Claims, and Repeat-Purchase Economics
Keto foods sit in a premium corner of the grocery and wellness market. That creates opportunity, but it also raises the performance bar. A shopper may accept a higher price once because a product is low carb, sugar free, or macro friendly. Repeat purchase usually requires a clearer reason: better taste, convenient packaging, visible satiety, simple net-carb communication, and enough availability to make the product easy to buy again.
Trial can be created by diet interest, influencer recommendations, health goals, or a strong claim on the front of pack. Durable demand depends on whether the product earns a place in a weekly basket without needing the consumer to feel like they are starting a new diet every time they buy it.
Commercial benchmarks and operating signals
• Supermarkets and hypermarkets held 46.9% of ketogenic diet food distribution in 2023, showing that mainstream visibility already matters to category expansion.
• Online ketogenic diet sales are expected to grow at a 5.7% CAGR from 2026 to 2033, which keeps subscriptions, reviews, and specialty product discovery important.
• Supplements led the ketogenic diet market with a 58.3% revenue share in 2025, but food formats such as snacks, bakery, beverages, and ready meals are more closely tied to everyday repeat occasions.
• Asia Pacific is expected to grow at a 6.5% CAGR through 2033, suggesting that education, local taste, and ecommerce access may matter more than simple keto labeling in high-growth markets.
• Canada is projected to grow at a 6.9% CAGR through 2033, while Spain, Japan, and South Korea are also cited with growth rates around 7.0% or higher in available country estimates.
• The global health and wellness foods market was valued above USD 1,015.0 billion in 2025, which means keto brands compete inside a much larger field of low-sugar, high-protein, clean-label, and functional-food products.
• A 33.5% digestive-issue challenge shows why ingredient systems, sugar alcohol levels, and fiber blends should be treated as commercial risks, not only formulation details.
• More than 890 million adults were living with obesity in 2022, and 589 million adults aged 20 to 79 were living with diabetes in 2024, keeping weight and carbohydrate awareness visible in consumer health conversations.
Price architecture is especially important because keto products often use expensive inputs such as almond flour, collagen, whey protein, MCT oil, specialty fats, alternative sweeteners, and fiber systems. Those inputs can support a premium position, but the premium must feel justified at the eating occasion. A higher-priced keto bread, cookie, shake, or snack has to deliver a benefit that is clear enough to survive comparison with mainstream, gluten-free, high-protein, and sugar-free alternatives.
Claims also need discipline. A product can say keto, low carb, net carb, no added sugar, high fat, high protein, or gluten free, but too many claims can make the package harder to understand. The stronger approach is usually to make the primary benefit obvious, then support it with simple nutrition proof. For shoppers who are not strict macro trackers, clarity can matter more than technical detail.
| Commercial signal | How to read it |
|---|---|
| High trial but weak repeat | The product may have a strong keto claim but weak taste, texture, price value, or digestive tolerance. |
| Strong online reviews | Specialist buyers understand the product, but mainstream retail may still need clearer packaging and simpler claims. |
| Higher basket value | Premium keto positioning may work, but brands should compare returns, discounting, and repeat rate. |
| Regional growth gap | Education, local flavors, price point, and channel access may be limiting adoption in some countries. |
| Strong snack performance | The product is likely solving a repeatable eating occasion rather than only selling a diet promise. |
Commercial readout
The most useful keto economics test is whether a product can move from trial to repeat purchase without leaning only on the keto label. Durable products usually combine clear net-carb logic, credible taste, manageable price, and a normal eating occasion such as breakfast, snacking, dessert, or meal replacement.
Ketogenic Diet Food Market Challenges
Keto has strong commercial signals, but it also has real constraints. Many consumers find strict keto difficult to maintain. Some products are expensive. Some rely heavily on sugar alcohols or fiber systems that can create digestive concerns. Others fail because the taste and texture do not match the food being replaced.
Adoption, labeling, and repeat-purchase risks
• A 33.5% digestive-issue challenge is cited as a restraint on sustained keto adoption.
• Consumers may be confused by net carbs, total carbs, sugar alcohols, and fiber claims when comparing products.
• Premium pricing can limit repeat purchases when keto products cost more than mainstream snacks or bakery alternatives.
• Taste and texture are major constraints in low-carb bread, bakery, and dessert products.
• Some keto products compete directly with simpler low-carb, high-protein, sugar-free, or gluten-free products that do not use keto branding.
• Medical caution matters because strict ketogenic eating may not suit every consumer, especially those with specific health conditions or medication routines.
• Regulatory and labeling expectations can differ by country, especially where health claims and diet claims are closely monitored.
• Short diet cycles can create trial purchases without durable repeat behavior if products do not solve everyday eating occasions.
The challenge is not only scientific or regulatory. It is also emotional. Diet products often carry a promise of control, and consumers can lose trust quickly when taste, claims, digestion, or results disappoint them. Keto foods need to feel helpful rather than punitive. Products that make daily eating easier are more likely to survive beyond a trend cycle.
Clear communication can reduce some of the risk. Net carbs, total carbs, fiber, sugar alcohols, and serving size should be presented in a way that normal shoppers can understand. When the label feels like a puzzle, the product may lose consumers who are interested in low-carb eating but not willing to study nutrition math at the shelf.
Taste remains the most immediate test. A shopper may understand the carbohydrate benefit, but repeat purchase usually depends on whether the product feels close enough to the food it replaces. Keto bakery, desserts, and snacks therefore face a higher sensory bar than supplements. Brands that explain net carbs clearly and deliver familiar texture are better positioned to survive beyond trend-driven trial.
Risk interpretation
Keto products can gain attention quickly, but repeat purchase depends on taste, price, digestibility, clear labeling, and trust. A product that only carries a keto label without replacing a real eating habit is less likely to build durable demand.
Keto Market Diagnostic
| Problem area | Core signals to measure |
|---|---|
| Market growth | Market size, CAGR, forecast value. |
| Product category | Snacks, supplements, beverages, bakery, meals. |
| Consumer demand | Weight loss, sugar reduction, fitness, metabolic health. |
| Regional fit | Region and country-level demand. |
| Channel strategy | Supermarket, online, pharmacy, fitness retail. |
| Product risk | Taste, price, claims, net carbs, sugar alcohols. |
Core diagnostic signals
The useful question is not only whether keto is growing. The better question is which product format, country, consumer need, and channel can turn low-carb interest into repeat purchasing. That keeps the analysis focused on market behavior rather than diet-label hype.
90-Day Ketogenic Diet Food Benchmark Plan
| Timing | What to do |
|---|---|
| Days 1-30 | Capture baseline by product type, region, claim, price point, and channel. |
| Days 31-60 | Compare snacks, supplements, beverages, bakery, and meal replacements. |
| Days 61-90 | Review country demand, label claims, ingredient risks, and retail channels. |
Planning principle
The strongest keto market analysis separates durable low-carb demand from short-term diet hype. Products tied to everyday habits such as snacking, bread replacement, sugar reduction, and meal convenience are more likely to hold demand.
Metrics Keto Food Leaders Should Track
| Metric | Why it matters |
|---|---|
| Market size | the total commercial opportunity. |
| CAGR | expected growth speed. |
| Segment share | Identifies whether snacks, supplements, beverages, or bakery lead. |
| Regional growth | where expansion is strongest. |
| Country-level demand | Helps localize product positioning. |
| Repeat purchase | whether keto products work beyond trial. |
| Net-carb positioning | Helps compare product claims. |
| Sugar-free share | Tracks overlap with sugar-reduction demand. |
| Channel performance | where consumers discover and buy. |
| Premium price tolerance | Measures whether keto labeling supports higher pricing. |
Ketogenic Diet Food Market Statistics FAQ
Common questions
• What is the size of the ketogenic diet food market?
Grand View Research estimates the global ketogenic diet market at USD 13.16 billion in 2025 and projects USD 20.75 billion by 2033. Other market estimates are higher, with Fortune Business Insights placing the category at USD 17.18 billion in 2025 and USD 35.81 billion by 2034.
• Why is the ketogenic diet food market growing?
Growth is supported by low-carb eating, weight-management demand, sugar reduction, high-protein snacking, metabolic health awareness, and convenient packaged foods that help consumers replace high-carb habits.
• Which keto food category is strongest?
Supplements are the leading category in several market datasets, with Grand View Research placing supplements at 58.3% of 2025 revenue. Snacks are repeatedly cited as the fastest-growing product segment across multiple regions and countries.
• Which region leads the ketogenic diet food market?
North America leads the market, accounting for 37.5% of global ketogenic diet revenue in 2025. The region reached USD 4,936.6 million in 2025 and is projected to reach USD 7,663.4 million by 2033.
• Which countries have strong keto food demand?
The United States holds the largest country-level share. The United Kingdom, China, Italy, Canada, Germany, India, Spain, Brazil, Japan, Australia, and South Korea also appear as important country markets in available estimates.
• Are keto snacks part of the ketogenic diet food market?
Yes. Keto snacks are a core part of the market because they replace high-carb snack occasions such as bars, cookies, chips, sweets, and portable foods. Snacks are also cited as a fastest-growing product segment in many country and regional datasets.
• What ingredients are common in keto foods?
Common ingredients include almond flour, coconut flour, MCT oil, butter, cream, cheese, nuts, seeds, collagen, whey protein, stevia, monk fruit, erythritol, fiber blends, avocado oil, and coconut oil.
• What are the biggest challenges for keto food brands?
The main challenges include high prices, taste and texture limitations, net-carb confusion, sugar-alcohol tolerance, regulatory claim limits, and the difficulty of turning short-term diet interest into repeat purchasing.
Final Takeaway
Ketogenic diet food growth depends on five systems working together: clear low-carb positioning, good taste and texture, reliable nutrition claims, strong retail and online access, and country-level fit. The category is strongest where it helps consumers replace familiar high-carb routines without making the eating experience feel too restrictive.
The strongest products will be those that make low-carb behavior feel routine rather than temporary. A keto snack, shake, bread substitute, supplement, or ready meal does not need every shopper to follow a strict ketogenic plan. It needs to deliver a credible low-carb benefit while fitting ordinary eating occasions, retail shelves, and repeat weekly use.
Strict keto dieting may rise or fall in popularity, but the wider low-carb and sugar-reduction movement gives keto foods a broader base. Consumers may stop calling their routine keto, but they can continue choosing fewer refined carbohydrates, more protein, cleaner snacks, and sugar-free desserts. That keeps keto brands under pressure to compete on product quality rather than label recognition alone.
For long-term market planning, the useful question is not only whether consumers recognize the keto label. The stronger question is whether the product gives them an easier, better-tasting way to manage carbohydrates during normal eating occasions. That is where market growth becomes more durable.