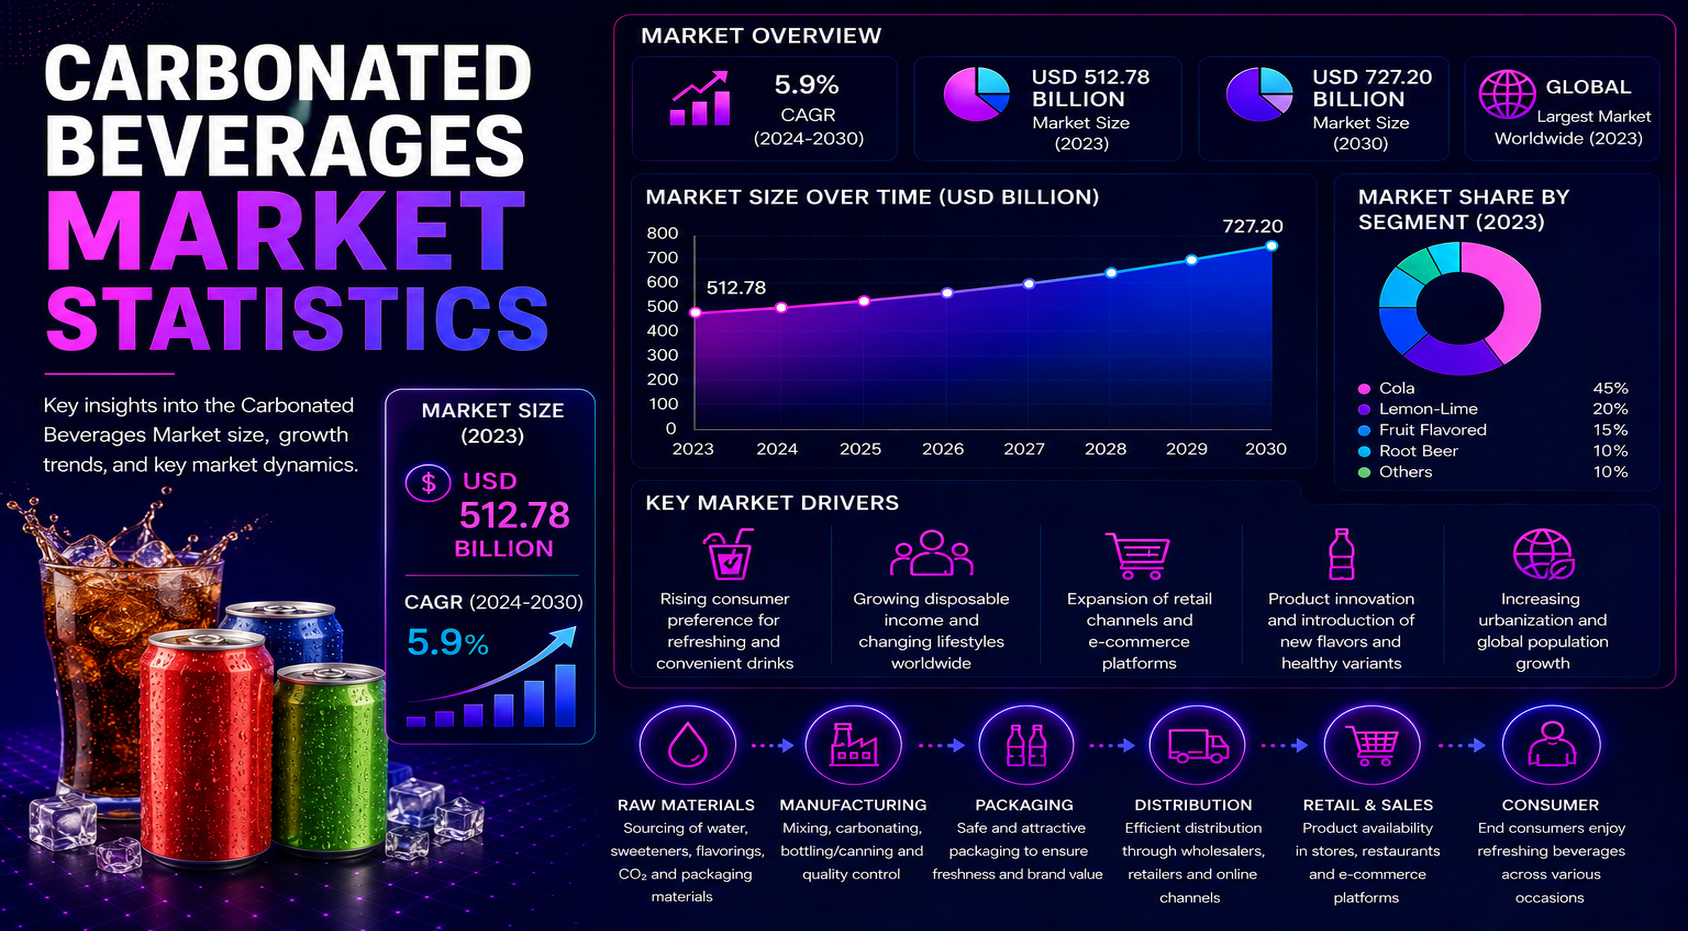
Carbonated beverages remain one of the world’s most visible drink categories, but the market is no longer a simple soda-volume story. Classic cola and flavoured carbonated soft drinks still carry large global value, while zero-sugar portfolios, flavoured sparkling water, functional soda, premium mixers, mini cans, multipacks, and foodservice fountain formats are changing how the category grows.
The strongest benchmark signals show a category with two realities at once. On one side, global market estimates remain very large: Fortune Business Insights valued the global carbonated soft drinks market at USD 473.72 billion in 2025 and projected it to reach USD 978.68 billion by 2034. On the other side, mature markets are dealing with sugar pressure, water substitution, packaging costs, and volume softness. This is why carbonated beverage statistics have to be read by value, volume, product type, channel, and region instead of as one simple number.
Reads carbonated beverages as a benchmark system, not a single market-size headline. It separates market size from consumption volume, carbonated soft drinks from broader carbonated beverages, full-sugar demand from zero-sugar reformulation, and global averages from regional and country-level realities. The goal is to show where the market is still scaling, where it is changing, and which statistics beverage leaders should track before making product, pricing, packaging, and channel decisions.
Executive Carbonated Beverage Benchmarks
These benchmarks define the carbonated beverages market. They show a category that is large, mature in some countries, still expanding in others, and increasingly shaped by sugar positioning, price-pack architecture, retail channel execution, and policy exposure.
For brands and bottlers, the most useful benchmarks are the ones that reveal where growth quality is strongest. A market with modest volume growth can still be valuable if price realization is strong and zero-sugar adoption is rising. A faster-growing market can still be risky if affordability pressure, packaging cost, or weak cold availability limits profitable distribution.
• Fortune Business Insights valued the global carbonated soft drinks market at USD 473.72 billion in 2025 and projected it at USD 494.93 billion in 2026.
• The same forecast places the global carbonated soft drinks market at USD 978.68 billion by 2034, implying an 8.9% CAGR for 2026-2034.
• Custom Market Insights valued the broader carbonated beverages market at USD 496.46 billion in 2024 and projected USD 771.3 billion by 2033.
• Market Research Future valued carbonated soft drinks at USD 432.6 billion in 2024 and projected USD 785.46 billion by 2035.
• Asia Pacific held 34.23% of the global CSD market in 2025, making it one of the most important regional demand pools.
• North America CSD revenue reached USD 121.64 billion in 2023, while consumption volume reached 64.9 billion liters.
• U.S. per-capita carbonated soft drink consumption was 34.8 gallons in 2024, while bottled water reached 47.3 gallons per person.
• Coca-Cola reported 2% sparkling soft drink volume growth for full year 2024 and 11% price/mix growth, showing that value growth and volume growth can move differently.
• Low/no-calorie drinks accounted for 75.7% of UK total soft drink sales in 2024, making the UK a strong reformulation benchmark.
• North America’s 2018-2023 revenue CAGR of 5.2% contrasted with only 0.2% volume CAGR, showing how pricing and mix can lift value even when liters are nearly flat.
Table 1. Executive carbonated beverage benchmarks
| Metric | Latest benchmark | Why it matters |
|---|---|---|
| Global CSD value | USD 473.72 billion in 2025 | Establishes the category as a large global market |
| Global CSD forecast | USD 978.68 billion by 2034 | That market value can continue expanding |
| Broader carbonated beverages | USD 496.46 billion in 2024 | Captures a wider view including adjacent carbonation |
| Asia Pacific share | 34.23% in 2025 | Where population and demand scale matter |
| U.S. CSD consumption | 34.8 gallons/person in 2024 | Shows mature-market category behavior |
| UK low/no calorie share | 75.7% of soft drink sales in 2024 | Reformulation and sugar-positioning pressure |
Editorial readout:
The headline statistics should not be read as one simple growth story. Carbonated beverages grow differently by region, channel, sugar level, and pack format. Mature markets can gain value through pricing, zero-sugar growth, mini cans, and premium packs, while emerging markets can gain volume through affordability, distribution, urbanization, and cold availability.
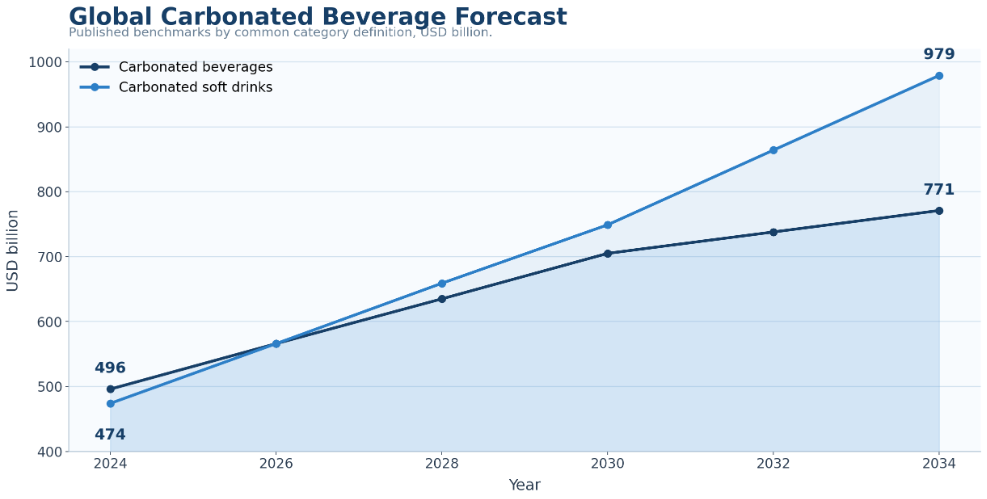
Figure 1. Global carbonated beverages market size and forecast show that category maturity does not remove value-growth potential when pricing, pack mix, and zero-sugar reformulation are moving together.
Why Carbonated Beverages Still Carry Global Beverage Scale
Carbonated beverages still matter because they combine habit, brand equity, bottling reach, retail visibility, foodservice pairing, impulse purchasing, and packaging scale. A carbonated soft drink is not only a flavor. It is a product architecture built around cold availability, familiar brands, price points, take-home packs, and immediate refreshment occasions.
The category also benefits from routine. Carbonated beverages are purchased with meals, during commutes, in convenience-store trips, through grocery pantry loading, at restaurants, in cinemas, through vending, and during social occasions. Few beverage categories touch as many channels and moments with the same frequency. That broad occasion base is why even small product, pack, or pricing shifts can carry large commercial consequences.
- The North America example is useful. Revenue grew at a 5.2% CAGR from 2018-2023, while volume grew at only 0.2% CAGR.
- This gap shows how price realization, pack mix, inflation, and premiumization can lift value even when physical consumption is almost flat. For a beverage company, the question is not only whether people drink more liters. It is whether the company can protect value per occasion.
Table 2. Why carbonated beverages still matter
| Scale driver | What it shows | Business implication |
|---|---|---|
| Brand equity | Long-running global beverage names still shape purchase behavior | Large brands can defend shelf space and fountain contracts |
| Bottling reach | Production and distribution are already built in many markets | Scale supports availability and speed-to-market |
| Foodservice pairing | CSDs attach naturally to QSR meals and fountain formats | Restaurant contracts remain strategically important |
| Convenience impulse | Chilled single-serve packs support immediate consumption | Price-pack and cold box execution matter |
Editorial readout:
The category’s scale means beverage leaders should look beyond total market value. The most useful benchmark questions are where value is protected, where liters are stable or falling, which pack sizes support margin, which channels drive velocity, and which product positions keep consumers inside the carbonation habit.
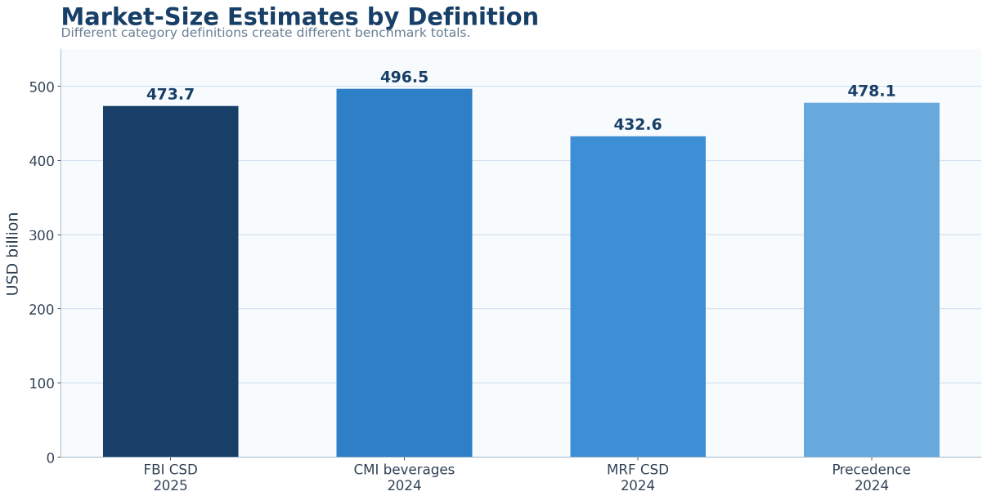
Figure 2. Market-size estimates should be grouped by definition because a narrow CSD estimate and a broader carbonation-platform estimate answer different business questions.
Global Market Scale and Forecast Statistics
Market-size data needs careful reading because sources define carbonated beverages differently. Some figures measure traditional carbonated soft drinks. Others include broader carbonated beverages, flavored sparkling products, mixers, functional carbonated drinks, or adjacent ready-to-drink formats. A strong benchmark article should explain this definition gap rather than force every estimate into one number.
A useful way to read the category is to separate headline value from the source of that value. A carbonated beverage market can look healthy because average prices, multipacks, mini cans, and premium formats are lifting revenue, even when liters are not accelerating at the same pace. That distinction makes the forecast more actionable for brands and retailers: growth quality matters as much as growth rate.
- Fortune Business Insights placed carbonated soft drinks at USD 473.72 billion in 2025 and projected USD 978.68 billion by 2034.
- Custom Market Insights valued the broader carbonated beverages market at USD 496.46 billion in 2024 and projected USD 771.3 billion by 2033.
- Market Research Future placed carbonated soft drinks at USD 432.6 billion in 2024 and projected USD 785.46 billion by 2035.
Table 3. Market-size estimates and what they measure
| Market definition | What it includes | How to use it |
|---|---|---|
| Carbonated soft drinks | Traditional soda-style beverages, including cola and flavored CSDs | Use for core soda category benchmarking |
| Carbonated beverages | CSDs plus broader ready-to-drink carbonated products | Use for wider category opportunity analysis |
| Sparkling water and seltzer | Unsweetened or lightly flavored carbonated water formats | Use for health and sugar-reduction analysis |
| Premium mixers | Tonic, ginger beer, and adult mixer occasions | Use for premium and foodservice strategy |
| Functional carbonation | Prebiotic, caffeinated, or wellness-positioned sparkling products | Use for innovation and challenger-brand tracking |
Editorial readout:
Market-size estimates should be treated as lenses, not contradictions. The broadest lens shows the refreshment value of carbonation. The narrowest lens shows the performance of traditional carbonated soft drinks. Both are useful when the article clearly states which definition is being used.
Consumption and Volume Statistics
Consumption statistics give the value story a demand check. Revenue can rise through pricing, pack mix, and premium formats while actual drinking volume stays flat or softens. That split matters most in mature markets, where shoppers may still buy carbonated beverages but shift toward mini cans, zero-sugar products, sparkling water, or higher-value multipacks.
For emerging markets, the stronger signal is often volume expansion. Wider retail reach, urbanization, hot climates, better cold availability, and affordable pack sizes can make a market strategically important even before average price per liter reaches mature-market levels.
Table 4. Consumption signals beverage teams should separate
| Consumption signal | What it measures | Why it matters |
|---|---|---|
| Per-capita consumption | How much each person drinks in a market | Category habit and maturity |
| Retail volume | How many liters move through stores | Household and take-home demand |
| Foodservice volume | Fountain and restaurant-related demand | Meal attachment and away-from-home strength |
| Purchase frequency | How often shoppers return to the category | Whether demand is habitual or occasional |
| Pack-size mix | Single-serve, multipack, mini-can, or bottle balance | Whether growth is convenience-led or household-led |
| Comparator categories | Water, energy drinks, coffee, tea, and juices | Where carbonated beverages are losing or gaining occasions |
Editorial readout:
Value and volume should be read together. A market can look healthy in dollars while liters are flat, and another can show volume upside but limited value if price-pack strategy is weak. The useful benchmark separates revenue, liters, price, pack size, and channel.
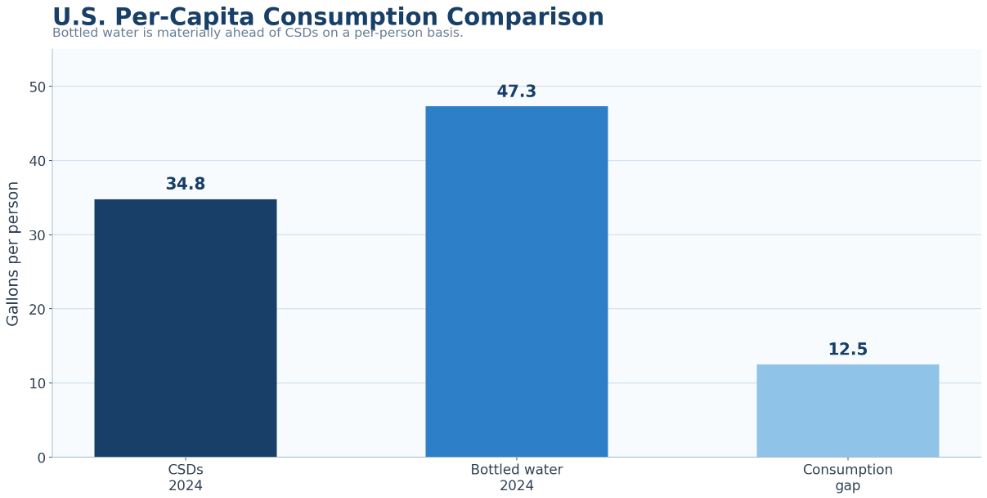
Figure 3. U.S. per-capita consumption shows why carbonated soft drinks should be benchmarked against bottled water and other refreshment categories, not only against their own past performance.
Product Segment Statistics
Carbonated beverages should not be analyzed as one uniform shelf. Cola remains the category anchor, but lemon-lime, fruit flavors, mixers, premium soda, regional flavors, and functional carbonated drinks serve different consumer occasions.
Segment data shows where the shelf is stable and where it is changing. The useful question is not only which segment is largest, but which formats help brands defend loyalty, reach new occasions, or respond to changing taste and sugar preferences.
Table 5. Carbonated beverage segments and market meaning
| Segment | Demand signal | Market implication |
|---|---|---|
| Cola | Core brand habit and fountain attachment | Still anchors the category and protects scale |
| Lemon-lime | Lighter flavor and meal-pairing occasions | Useful for broad household and QSR demand |
| Fruit-flavored carbonates | Flavor variety and regional taste preference | Supports innovation and younger consumers |
| Tonic and mixers | Premium adult occasions | Connects CSD infrastructure to premium drinking occasions |
| Diet/zero sugar | Health-led reformulation demand | Protects soda occasions under sugar pressure |
| Functional soda | Wellness and challenger-brand positioning | Competes through benefits, not only taste |
Editorial readout:
Segment share becomes useful when it is tied to occasion. Cola protects scale, lemon-lime and fruit flavors support refreshment variety, mixers add premium value, and functional soda competes through benefit-led positioning.
Zero-Sugar, Diet, and Low-Calorie Carbonated Beverage Statistics
Health pressure is not ending carbonation demand. It is changing sugar levels, portion sizes, sweetener choices, reformulation strategy, and shelf architecture. This is one of the most important shifts in the carbonated beverages market because it allows consumers to stay inside the category while changing what they buy.
For operators, the practical signal is not only whether zero-sugar products are growing. The stronger question is whether zero-sugar lines are expanding the category, defending existing cola occasions, or shifting shoppers from full-sugar products into lower-calorie versions within the same brand family. That is why the article treats sugar positioning as a portfolio issue rather than a single product trend.
For beverage companies, this means sugar strategy is a portfolio issue. A balanced portfolio may need classic full-sugar products, zero-sugar hero SKUs, diet variants, mini cans, lightly sweetened options, and functional carbonated alternatives. The benchmark question is whether the portfolio gives enough choice without confusing the shelf.
- The UK offers a strong reformulation benchmark. Low/no-calorie drinks accounted for 75.7% of total soft drink sales in 2024.
- That number is important because it shows that low-sugar positioning can become mainstream rather than niche. In a policy-heavy market, reformulation, smaller packs, and zero-sugar portfolio depth become tools for defending category relevance.
- The shift is not simply from sweet to unsweetened. It is a move toward segmented sweetness. Some consumers still choose classic full-sugar products for taste and habit. Others switch to zero-sugar versions, diet sodas, mini cans, reduced-sugar formulas, flavored seltzers, sparkling water, or functional sodas.
- The carbonated beverage shelf is becoming more segmented because consumers are using different products for different trade-offs: taste, sugar, calories, price, convenience, and function.
Table 6. Sugar-positioning signals
| Product position | What to measure | Why it matters |
|---|---|---|
| Full-sugar CSD | Volume, price, promotion depth, and pack size | Whether classic demand remains resilient |
| Diet CSD | Legacy low-calorie demand and brand loyalty | Mature low-calorie behavior |
| Zero-sugar CSD | Growth, repeat purchase, and shelf share | Whether reformulation protects soda occasions |
| Reduced-sugar soda | Portfolio transition and tax exposure | How brands manage health pressure |
| Mini cans | Portion-control demand and price per ounce | How smaller packs protect value |
| Functional low-sugar carbonation | Benefit-led demand | Where challenger innovation is expanding |
Editorial readout:
The category is not moving in one straight line away from sweetness. It is moving toward choice. Brands that can offer full-sugar, zero-sugar, portion-controlled, sparkling, and functional options can defend more occasions than brands that rely on one formulation.
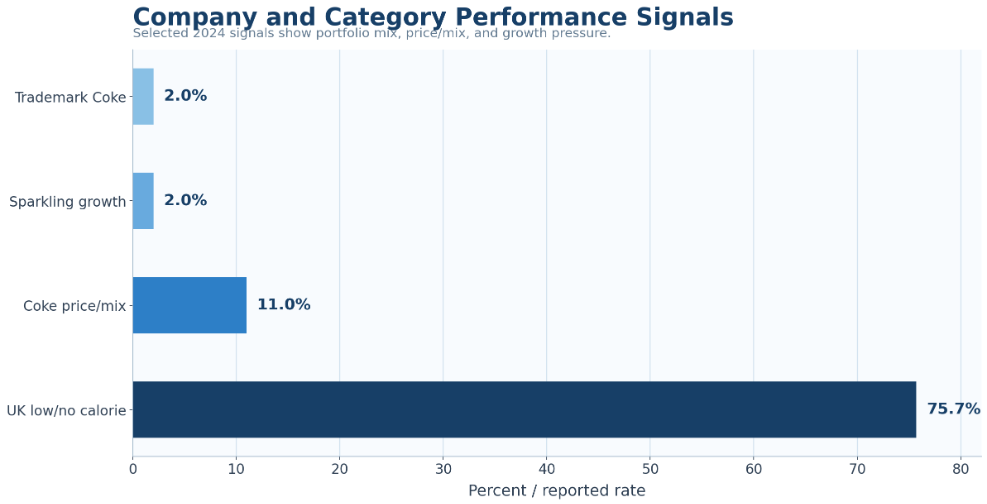
Figure 4. Company and category signals show how volume growth, price/mix, and low/no-calorie positioning can move at different speeds inside the same carbonated beverage market.
Sparkling Water, Seltzer, and Functional Carbonation
Sparkling water, seltzer, and functional carbonation represent the growth edge of the broader carbonation platform. These products matter because they keep shoppers inside the fizz habit while reducing sugar, calories, or traditional soda occasions.
This changes the competitive set. Functional sodas, flavored seltzers, premium mixers, and caffeinated sparkling drinks compete with water, energy drinks, tea, coffee, and wellness beverages, not only with classic CSDs.
Table 7. New carbonation growth spaces
| Growth space | Consumer reason | Competitive pressure |
|---|---|---|
| Sparkling water | Carbonation without heavy sugar | Pulls hydration occasions away from soda |
| Flavored seltzer | Flavor variety and low-calorie refreshment | Competes with diet soda and bottled water |
| Prebiotic soda | Functional benefit plus treat positioning | Challenges classic soda through wellness messaging |
| Premium mixers | Adult occasions and foodservice quality | Competes through taste, packaging, and price |
| Caffeinated sparkling drinks | Energy and refreshment crossover | Competes with energy drinks and coffee |
| Adult non-alcoholic carbonation | Social drinking without alcohol | Creates premium occasions outside traditional soda |
Editorial readout:
Functional carbonation matters because it changes the competitive set. A carbonated beverage company is no longer only competing against another soda company. It is competing for refreshment, hydration, energy, wellness, and adult occasions.
Packaging and Format Statistics
Packaging is a business-performance issue, not only a sustainability issue. Carbonated beverages are sold by occasion, and each occasion has a preferred format: single-serve bottles, grocery multipacks, mini cans, fountain drinks, glass bottles, or returnable packs.
Packaging also changes how the same beverage is valued. A mini can may reduce serving size but improve portion control and price realization. A PET bottle may win on convenience, while a multipack can defend household replenishment. A fountain drink depends on foodservice traffic and meal attachment. These differences make packaging a commercial metric, not only a sustainability topic.
Pack-format data should therefore be read beside channel data. Grocery favors stock-up economics, convenience favors immediate cold availability, foodservice favors fountain attachment, and premium occasions often favor glass or specialty formats.
Table 8. Packaging formats and market implications
| Format | Where it wins | Risk or constraint |
|---|---|---|
| Aluminum cans | Multipacks, convenience, recycling narratives | Input cost and promotion pressure |
| PET bottles | Portability, single-serve, and affordability | Plastic policy and sustainability scrutiny |
| Glass bottles | Premium soda, mixers, and foodservice presentation | Weight, breakage, and logistics costs |
| Fountain drinks | QSR meals and refill occasions | Foodservice traffic and syrup contract dependence |
| Mini cans | Portion control and value per ounce | Requires clear occasion and pricing logic |
| Returnable bottles | Affordability in selected emerging markets | Reverse logistics complexity |
Editorial readout:
Packaging is where market strategy becomes visible. A brand’s pack mix shows whether it is chasing affordability, convenience, premiumization, portion control, or household volume. The same beverage can perform very differently when the package changes.
Retail, Foodservice, and Ecommerce Channel Statistics
Channel statistics should be read through shopper mission. Grocery, convenience stores, mass retail, club stores, foodservice, vending, ecommerce, andquick commerce each solve a different buying occasion.
Grocery is often a stock-up environment. Convenience retail is built around immediate cold refreshment. Foodservice connects carbonation to meals. Ecommerce and quick commerce make heavy packs more accessible for planned or repeat buying.
Table 9. Carbonated beverage channel logic
| Channel | Primary format | Why it matters |
|---|---|---|
| Grocery | Multipacks, cans, bottles, mini cans | Protects household and replenishment occasions |
| Convenience store | Chilled single-serve bottles and cans | Captures impulse and immediate refreshment |
| Mass retail | Value packs and broad assortment | Supports scale and promotion |
| Club store | Large packs and bulk value | Supports high-volume household purchases |
| QSR and foodservice | Fountain drinks and meal bundles | Protects attachment and away-from-home occasions |
| Ecommerce | Bulk packs and repeat orders | Requires careful margin and delivery economics |
Editorial readout:
Channel statistics should always be read with pack size and price point. A channel can grow in value while a brand loses margin if promotion depth, shipping cost, or pack architecture is weak.
Brand and Company-Level Carbonated Beverage Statistics
Carbonated beverage competition is concentrated at the top, but pressure often comes from many directions: private label, premium mixers, functional soda challengers, sparkling water brands, regional soda companies, and retailers optimizing shelf economics. Large beverage companies defend their position through distribution, brand equity, reformulation, marketing, foodservice contracts, and price-pack architecture.
Brand data should also be read through route-to-market strength. Large beverage companies do not only compete through flavor; they compete through bottling systems, shelf space, cold equipment, foodservice contracts, advertising scale, and price-pack architecture. Smaller brands can grow quickly in premium or functional niches, but national scale usually depends on distribution depth and repeat purchase.
A strong brand section should separate category power from category disruption. Coca-Cola, PepsiCo, and Keurig Dr Pepper explain much of the established competitive base, while premium mixers, craft sodas, sparkling water brands, and functional soda challengers explain where consumer curiosity is moving.
- Coca-Cola’s 2024 signals show why company-level statistics should separate volume from price/mix.
- The company reported 2% sparkling soft drink volume growth for the full year and 11% price/mix growth.
- That combination indicates that value management can be as important as unit growth. Trademark Coca-Cola also grew 2% for the full year, showing that the core brand platform remained relevant while the portfolio continued to adapt.
- For PepsiCo, Keurig Dr Pepper, and other competitors, the same logic applies: the most useful benchmark is not only total beverage revenue.
- The better questions are which brands are gaining share, how zero-sugar portfolios are performing, where Dr Pepper-style flavor positioning is gaining attention, how private label affects value, and which challenger brands are changing expectations around function, sweetness, or premium packaging.
Table 10. Brand competition map
| Company or brand group | Carbonated beverage strength | Strategic signal |
|---|---|---|
| The Coca-Cola Company | Global cola scale, sparkling portfolio, bottling reach | Defends category leadership through brand equity and price/mix |
| PepsiCo | Large beverage portfolio and retail relationships | Competes through cola, flavors, promotion, and cross-category scale |
| Keurig Dr Pepper | Strong flavored CSD and Dr Pepper positioning | Shows the value of differentiated flavor platforms |
| Private label | Value-driven shelf alternative | Pressures pricing in inflation-sensitive periods |
| Premium mixers | Higher-price adult occasions | Supports premium packaging and foodservice relevance |
| Functional soda challengers | Health-adjacent carbonated alternatives | Changes shopper expectations around benefits and ingredients |
Editorial readout:
Company statistics should be treated as market signals. Volume growth shows demand. Price/mix shows revenue management. Brand mix shows portfolio strength. Reformulation shows whether a company can defend relevance under sugar pressure.
Pricing, Promotion, and Price-Pack Architecture Statistics
Pricing is one of the clearest reasons carbonated beverage value can keep rising even when physical consumption is mature. The article’s North America benchmark illustrates the point: revenue expanded at a 5.2% CAGR from 2018 to 2023 while volume increased at only 0.2% CAGR. That gap means a meaningful share of value creation came from price realization, mix, package architecture, and premiumization rather than from consumers simply drinking more liters. For commercial teams, this distinction is essential because a market can look healthy in dollars while underlying consumption remains almost flat.
Revenue Growth Versus Volume Growth
Value and volume should therefore be reviewed as separate operating signals. Revenue growth can be supported by list-price increases, reduced promotion depth, a shift toward smaller high-value packs, premium mixers, or stronger single-serve sales. Volume growth, by contrast, shows whether more physical product is moving. When revenue grows faster than liters, beverage leaders need to determine whether the improvement is durable or whether it depends too heavily on pricing. The most useful scorecard compares net revenue, liters, average selling price, price per ounce, channel mix, and pack-size mix on the same page.
Coca-Cola’s 2024 results provide another useful benchmark. Sparkling soft drink volume increased 2%, while price/mix increased 11%. Those figures do not mean every market or SKU behaved the same way, but they demonstrate why company-level analysis should separate demand from revenue management. A portfolio can protect value through pricing and mix while unit growth remains modest. That creates a different management question from a market in which both volume and value are accelerating.
Pack Architecture as a Pricing Ladder
Pack architecture converts pricing strategy into something shoppers can see. A single-serve chilled bottle, a standard can, a mini can, a household multipack, a club pack, a fountain drink, and a returnable bottle may contain the same core beverage but serve different occasions and price expectations. Smaller packs can support portion control and a higher price per ounce, while larger packs can protect household volume and perceived value. Returnables can support affordability in selected emerging markets, while glass can reinforce premium positioning in mixers and foodservice.
The important benchmark is therefore not the average category price alone. Teams should track price by pack, channel, sugar position, and occasion. A grocery multipack competes on replenishment economics; a convenience-store single serve competes on immediate cold availability; a fountain drink competes through meal attachment; and a premium mixer competes through presentation and adult occasions. If these formats are blended into one price metric, the company can miss where margin is actually improving or eroding.
Promotion Depth and Channel Economics
Promotion adds another layer to the value story. Carbonated beverages often rely on high-visibility retail promotions, multipack offers, foodservice bundles, and seasonal displays. Strong promotional volume can protect shelf velocity, but it can also weaken revenue quality if discounts become the main reason shoppers buy. The better benchmark compares base sales with promoted sales, average discount depth, post-promotion repeat purchase, and margin after trade spending. The goal is to understand whether a promotion recruits demand, shifts timing, or merely gives away value to purchases that would have happened anyway.
Channel economics should be read alongside promotion. Convenience stores can support stronger price realization on cold single-serve products, while grocery and club channels can move much larger take-home packs at lower unit economics. Ecommerce can expand access to heavy multipacks, but shipping and fulfillment costs can change profitability. Foodservice can protect fountain and meal-bundle occasions, yet the economics depend on traffic, contracts, and attachment rates. A useful carbonated beverage benchmark therefore connects price, pack, promotion, and channel rather than evaluating each one independently.
What Beverage Teams Should Monitor
A practical pricing dashboard should include average selling price, revenue per liter, price per ounce, promotion depth, mix by pack size, zero-sugar versus full-sugar pricing, channel margin, and regional affordability. These measures help explain whether growth is coming from true demand, inflation, premiumization, portion control, or channel shift. They also make it easier to identify risk. If price rises while volume and purchase frequency fall, the category may be protecting short-term value at the expense of long-term demand. If smaller packs lift revenue per liter without weakening repeat purchase, price-pack architecture may be strengthening the portfolio.
The broader lesson is that pricing should not be treated as a single annual increase. In carbonated beverages, price is embedded in package size, channel, promotion, temperature, convenience, formulation, and brand position. The strongest operators manage those variables together. That approach is especially important in a category where mature-market liters can be stable while value continues to expand, and where emerging markets may require affordable entry packs before premium formats can scale.
Regional Carbonated Beverage Intelligence
Regional carbonated beverage data is essential because global averages hide major differences in consumption, affordability, channel structure, flavor preference, policy, packaging, and retail maturity.
The table below treats each region as a market signal rather than a geography note, so the section reads like market intelligence instead of a location list.
- North America is a mature high-value market: USD 121.64 billion in CSD revenue in 2023 and 64.9 billion liters of volume show why pricing, zero sugar, convenience, and pack architecture matter more than volume acceleration.
- Europe is the policy-led benchmark. Sugar taxes, deposit systems, packaging rules, and the UK’s 75.7% low/no-calorie share in 2024 show how regulation can move the shelf toward reformulation.
- Asia Pacific is the growth-scale benchmark. Its 34.23% global CSD share in 2025 and rising carbonated beverage value make local flavors, affordability, urban retail, and distribution central.
- Latin America signals consumption culture and affordability, while the Middle East and Africa signal climate-driven demand and distribution opportunity. Both regions need pack-price discipline and cold availability.
Table 11. Regional carbonated beverage intelligence
| Region | Category signal | Market implication |
|---|---|---|
| North America | High value, mature volume, strong convenience and foodservice channels | Focus on price/mix, zero sugar, and pack architecture |
| Europe | Sugar taxes, reformulation, low/no-calorie share, packaging rules | Focus on compliance, low-sugar portfolios, and premium formats |
| Asia Pacific | 34.23% global CSD share and growing market value | Focus on distribution, local flavors, affordability, and urban retail |
| Latin America | Strong soda culture and policy exposure | Focus on affordability, returnables, and sugar-tax adaptation |
| Middle East & Africa | Warm climate, youth demographics, distribution expansion | Focus on cold availability and pack-price strategy |
Editorial readout:
Regional statistics should be read as operating signals. North America highlights value management, Europe highlights reformulation, Asia Pacific highlights scale, Latin America highlights affordability, and Middle East and Africa highlight distribution potential.
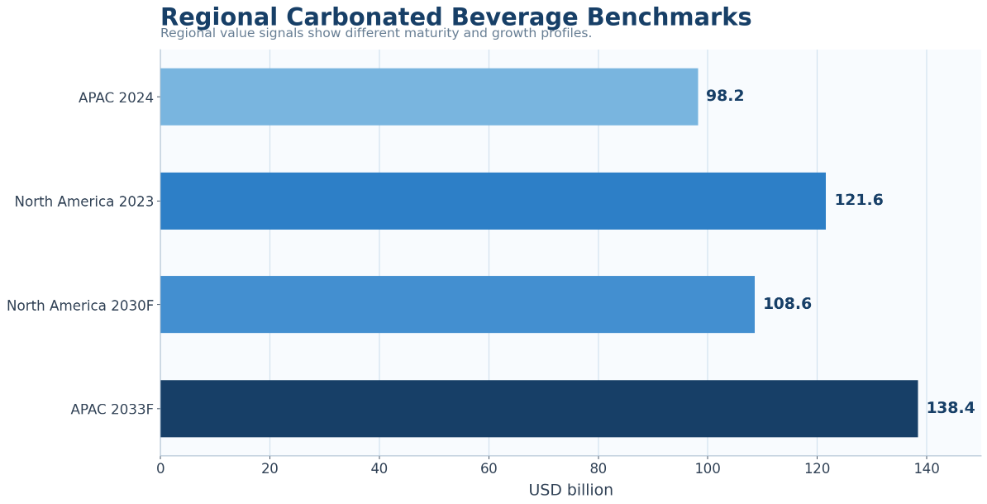
Figure 5. Regional carbonated beverage benchmarks show why mature, emerging, and policy-heavy markets need separate strategies for sugar, packaging, pricing, and distribution.
Country-Level Carbonated Beverage Statistics
Country-level statistics matter because local taste, income, pricing, retail access, sugar policy, bottling infrastructure, and packaging habits decide how carbonation demand develops. The country lens prevents global averages from becoming misleading. Two countries can sit in the same region but behave differently because of sugar taxes, income levels, modern trade penetration, local flavors, returnable packaging, foodservice habits, and climate. Country-level statistics therefore help explain whether a market is a value opportunity, a volume opportunity, a reformulation challenge, or a distribution build-out.
A practical country section should treat each market as a signal. The United States shows mature-market substitution between CSDs, bottled water, and zero-sugar options. Mexico and Brazil show the importance of consumption culture and affordability. The UK shows reformulation pressure, while China, India, Japan, and South Korea show different combinations of scale, innovation, and retail expansion.
- The United States is the mature benchmark. CSD consumption of 34.8 gallons per person in 2024 still shows a large habit, but bottled water at 47.3 gallons per person shows how hydration leadership has shifted. That makes the U.S. useful for studying substitution, zero-sugar portfolios, and price-pack discipline.
- Mexico and Brazil remain high-importance Latin American markets because consumption culture, population scale, affordability, returnable packaging, and policy exposure shape performance. The UK is best used as a reformulation benchmark because low/no-calorie soft drinks accounted for 75.7% of total soft drink sales in 2024.
- China and India should be read as different growth models. China brings large urban retail value and intense beverage competition. India brings population scale, income growth, distribution expansion, and long-term cold-availability upside.
Table 12. Country-level carbonated beverage signals
| Country | Key signal | Market implication |
|---|---|---|
| United States | 34.8 gallons per person in CSD consumption in 2024 | Mature market where value protection matters |
| Mexico | Strong soft-drink culture and sugar-policy exposure | Balance affordability, reformulation, and pack strategy |
| Brazil | Large Latin American beverage market | Track affordability, returnables, and regional flavors |
| United Kingdom | 75.7% low/no-calorie soft drink sales share in 2024 | Use as a reformulation benchmark |
| Sweden | 1.05 billion liters in 2023 and 1.07 billion liters forecast by 2028 | Mature European consumption profile |
| China | Large population and retail value base | Focus on urban channels and local preferences |
| India | Long-term population and distribution opportunity | Focus on affordability and availability |
| Japan/South Korea | Innovation-heavy retail environments | Track functional, flavor, and convenience formats |
Editorial readout:
Country analysis should combine volume, value, policy, and channel structure. Population size alone is not enough. The better question is whether a country has the income, cold availability, bottling network, retail channel, and product mix needed to convert demand into profitable sales.
Health, Sugar, and Policy Statistics
Health policy is one of the most important forces shaping carbonated beverages. Sugar taxes, labeling rules, school restrictions, marketing limits, deposit systems, and public-health campaigns affect formulation, packaging, pricing, and portfolio design.
The useful benchmark is not regulation alone. Policy exposure should be read beside zero-sugar adoption, mini-can performance, reformulation pace, sparkling-water growth, and brand messaging.
Table 13. Policy and health pressure signals
| Policy area | What it affects | Market impact |
|---|---|---|
| Sugar tax | Price, formulation, pack size, and promotion | Pushes brands toward reformulation and zero-sugar options |
| Front-of-pack labeling | Consumer perception and product comparison | Creates pressure for clearer nutrition positioning |
| School restrictions | Youth-oriented occasions and channel access | Limits some full-sugar exposure |
| Marketing restrictions | Advertising claims and targeting | Changes communication strategy |
| Deposit systems | Packaging cost, recovery, and logistics | Requires compliance and packaging planning |
| Portion-size strategy | Mini cans and smaller packages | Allows indulgence with moderation messaging |
Editorial readout:
Health policy is best understood as a portfolio pressure, not only a sales risk. It forces brands to decide which products, packages, price points, and messages can protect demand while responding to public health expectations.
Carbonated Beverage Growth-Leak Diagnostic
A useful carbonated beverage benchmark should help teams decide where growth is leaking. A high global CAGR does not show whether a brand is losing share because of sugar pressure, weak pack architecture, poor channel execution, private label, pricing, or regional underperformance.
The diagnostic section should work like a management checklist. If value is rising but volume is soft, teams should inspect pricing, pack mix, and promotion depth. If volume is falling, they should inspect sugar pressure, competitive switching, channel weakness, and product relevance. If one region underperforms, they should inspect affordability, distribution, local flavor fit, and cold availability.
Table 14. Carbonated beverage growth-leak diagnostic
| Problem area | Core signals to measure | Useful benchmark |
|---|---|---|
| Market scale | Market value, CAGR, and forecast range | Compare narrow CSD and broader beverage definitions |
| Volume softness | Liters, per-capita consumption, purchase frequency | Compare revenue growth with volume growth |
| Sugar pressure | Full-sugar share, zero-sugar share, policy exposure | Track reformulation and portion control |
| Packaging economics | Can, PET, glass, fountain, mini-can, multipack mix | Map format to channel and margin |
| Channel execution | Convenience velocity, grocery multipacks, foodservice fountain | Connect sales to occasions |
| Regional affordability | Price points, local income, returnable packs | Separate value growth from accessible volume |
Editorial readout:
This model keeps the article from becoming a statistic dump. Each metric belongs to a business question: is demand weakening, is product mix shifting, is pricing protecting value, are channels supporting the right formats, and is policy pressure changing the shelf?
90-Day Carbonated Beverage Benchmark Plan
The numbers become more useful when they turn into a repeatable operating rhythm. This 90-day plan converts external market statistics into an internal scorecard for beverage teams.
Table 15. 90-day carbonated beverage benchmark plan
| Timeline | Focus | Output |
|---|---|---|
| Days 1–30 | Analyze markets, products, channels, and pricing | Carbonated Beverage Benchmark Map |
| Days 31–60 | Compare sales, volume, pricing, and growth trends | Opportunity & Pressure Matrix |
| Days 61–90 | Prioritize markets, channels, and packaging opportunities | Carbonated Beverage Scorecard |
Editorial readout:
The best beverage teams do not chase every market-size estimate. They compare external benchmarks against their own shipments, scanner data, channel mix, pricing, promotional depth, pack architecture, and regional execution.
Metrics Beverage Leaders Should Track
The most useful carbonated beverage metrics are not only category totals. They connect market scale with practical operating decisions. The following scorecard keeps the article practical and decision-ready.
The metrics table should be used as a recurring scorecard rather than a one-time summary. A useful review compares market value, liters, price realization, pack mix, sugar mix, channel mix, and regional growth on the same page. When those signals move in different directions, leaders can see whether growth is being created by real demand, pricing, premiumization, channel shift, or portfolio reformulation.
Key Carbonated Beverage Statistics
- More than 60% of carbonated beverage revenue in many developed markets is generated through off-trade retail channels.
- Zero-sugar carbonated beverages account for over 30% of category sales in several mature markets.
- Premium sparkling water segments have recorded double-digit annual growth in numerous countries.
- Smaller pack formats often generate higher revenue per liter than larger family-size packages.
- Convenience stores typically achieve higher price realization than supermarkets for single-serve beverages.
- Health-conscious consumers continue driving growth in low-calorie and reduced-sugar carbonated drinks.
- PET bottles remain the dominant packaging format across most global carbonated beverage markets.
- Aluminum can adoption continues increasing due to sustainability and recycling initiatives.
- Emerging markets frequently deliver stronger volume growth than mature beverage markets.
- Price increases have become a larger contributor to category value growth than volume expansion in many regions.
- Multi-pack purchases represent a growing share of household beverage consumption.
- E-commerce beverage sales continue expanding faster than traditional retail channels in several markets.
- Regional sugar taxes have accelerated reformulation efforts among major beverage manufacturers.
- Flavored sparkling water is one of the fastest-growing segments within carbonated beverages.
- Premium and functional carbonated drinks often achieve higher margins than traditional soft drinks.
Table 16. Metrics beverage leaders should track
| Metric | Why it matters |
|---|---|
| Market value | The dollar size of the category opportunity |
| Market CAGR | Whether value is expanding and at what speed |
| Retail volume | Physical demand and household purchasing behavior |
| Per-capita consumption | Category habit by market |
| Average selling price | Pricing power and inflation impact |
| Pack-size mix | Whether growth comes from convenience, multipacks, or portion control |
| Channel share | Where demand is captured |
| Full-sugar share | Classic soda resilience |
| Zero-sugar share | Reformulation progress |
| Sparkling water share | Competition from low-sugar carbonation |
| Brand share | Competitive concentration |
| Private label share | Price pressure |
| Sugar-tax exposure | Policy and reformulation risk |
| Regional growth rate | Where distribution and investment should be prioritized |
Carbonated Beverages Market Statistics FAQ
What is the carbonated beverages market?
The carbonated beverages market includes drinks that contain dissolved carbon dioxide for fizz. It can be defined narrowly as carbonated soft drinks or broadly to include sparkling water, flavored seltzer, mixers, and functional carbonated beverages.
How large is the global carbonated beverages market?
Depending on definition, the market is valued in the hundreds of billions of dollars. Custom Market Insights valued the broader carbonated beverages market at USD 496.46 billion in 2024, while Fortune Business Insights valued carbonated soft drinks at USD 473.72 billion in 2025.
Are carbonated beverages still growing?
Yes, market value is still projected to grow, but growth is uneven by region and segment. Mature markets often grow through price, pack mix, and zero-sugar reformulation, while emerging markets can grow through distribution and affordability.
What is the difference between carbonated beverages and carbonated soft drinks?
Carbonated soft drinks usually refer to traditional soda-style beverages such as cola and flavored CSDs. Carbonated beverages can be broader and may include sparkling water, mixers, and functional carbonated drinks depending on the source.
Which region matters most?
Asia Pacific is a major demand region and held 34.23% of the global CSD market in 2025. North America remains important because it is a high-value mature market with large brand concentration and channel infrastructure.
Are zero-sugar carbonated drinks important?
Yes. Zero-sugar, diet, and low-calorie formats are important because they let consumers remain inside the carbonation habit while reducing sugar or calories. The UK is a strong benchmark, with low/no-calorie drinks accounting for 75.7% of total soft drink sales in 2024.
How are sugar taxes affecting the category?
Sugar taxes and health policy usually change product mix before they eliminate demand. They encourage reformulation, zero-sugar portfolios, smaller packs, and more careful brand messaging around choice and moderation.
Which companies lead carbonated beverages?
The Coca-Cola Company, PepsiCo, and Keurig Dr Pepper are key global or regional leaders, depending on market and segment. Competition also comes from private label, premium mixers, sparkling water brands, and functional soda challengers.
What metrics should beverage leaders track?
They should track market value, retail volume, per-capita consumption, pack-size mix, channel share, full-sugar share, zero-sugar share, sparkling water share, brand share, private label pressure, and sugar-policy exposure.
Final Takeaway
Carbonated beverages remain a global-scale category, but the market is shifting from a simple soda-volume story into a segmented refreshment platform. Cola and flavored CSDs still matter, but zero-sugar products, sparkling water, functional carbonation, premium mixers, pack-size strategy, and regional taste differences are reshaping where growth comes from.
The best way to read the category is through five systems: market value and volume, product mix and sugar positioning, packaging and channel execution, regional and country-level demand, and health-policy durability. These systems explain why one market can grow through pricing, another through distribution, another through reformulation, and another through premium or functional innovation.
For beverage leaders, the practical goal is not only to measure global market size. The goal is to understand which segments are gaining share, which countries still have consumption upside, which channels protect margin, which packaging formats fit each occasion, and how health policy is changing the portfolio. The strongest carbonated beverage strategy will combine scale, reformulation, flavor innovation, regional execution, and disciplined price-pack management.