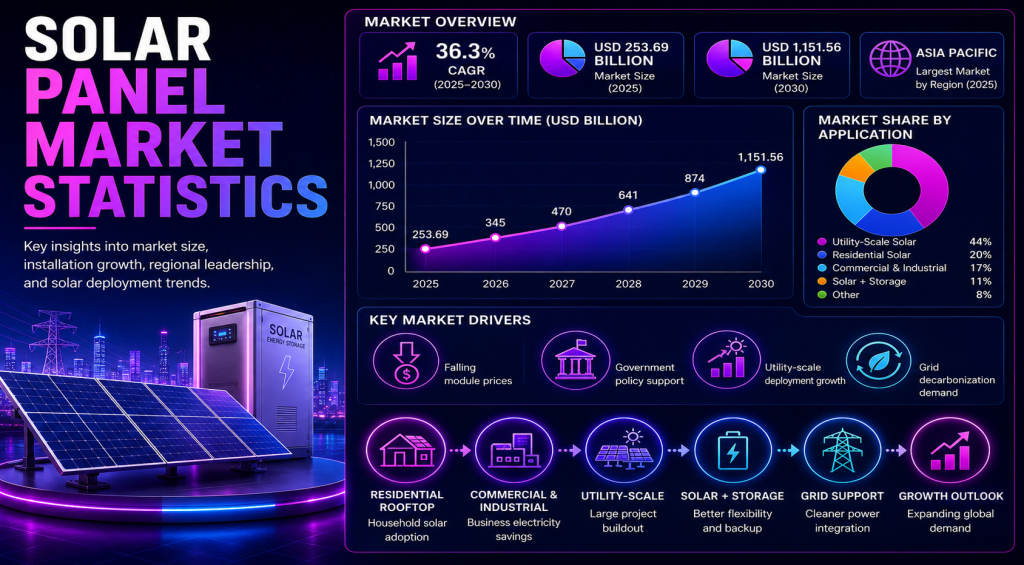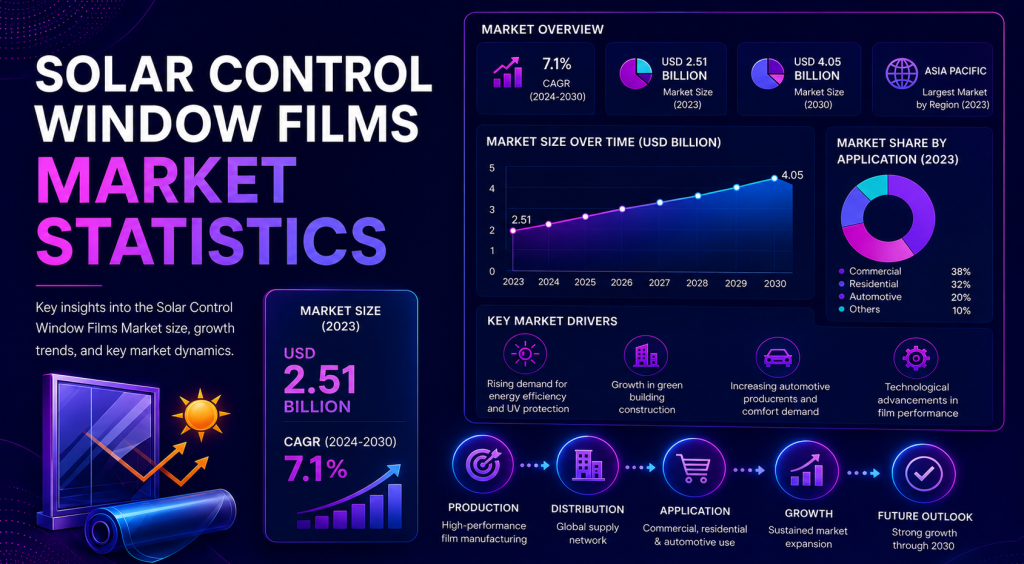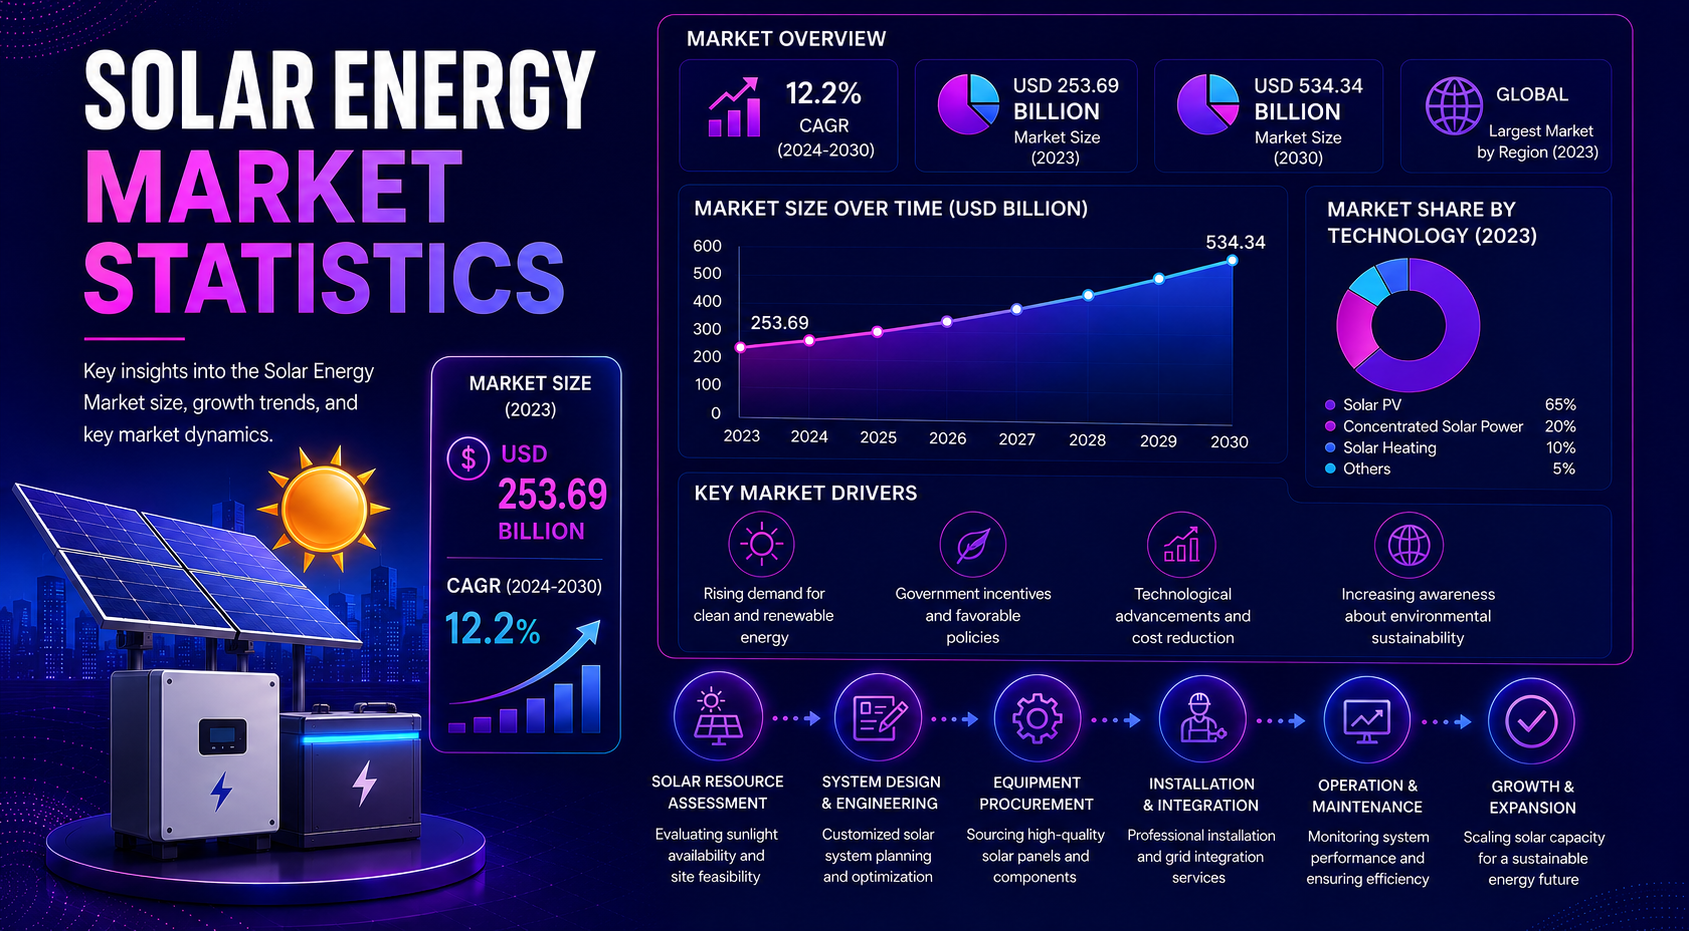
Solar energy is where electricity demand, clean-energy investment, manufacturing scale, grid planning, storage deployment, and energy security now meet. The market is no longer measured only by how many panels are installed. It is measured by how quickly countries add capacity, how much electricity solar generates, and whether grids can absorb rising daytime output.
The strongest solar statistics show why the category deserves its own market scorecard. IRENA-related 2025 data placed solar capacity near 2.4 TW, solar added about 510.3 GW during 2025, solar supplied about 8.75% of global electricity, and China alone added 315.1 GW of solar capacity. Those numbers show why solar now affects deployment, manufacturing, pricing, grid planning, and supply-chain decisions.
Executive Solar Energy Benchmarks
They show the scale of solar deployment, the speed of annual installations, the difference between installed capacity and electricity generation, and the rising importance of grid readiness, storage, and supply-chain stability.
The numbers that define the solar market
• IRENA reported global renewable power capacity of 5,149 GW at the end of 2025, showing that renewables are approaching half of installed power capacity worldwide.
• Solar power added about 510.3 GW of capacity in 2025, making solar the largest contributor to renewable capacity expansion.
• IRENA-related 2025 data placed solar capacity at about 2,392 GW after an annual increase of more than 511 GW.
• At the end of 2024, IRENA reported 1,865 GW of global solar power capacity, equal to 42% of global renewable capacity.
• IRENA reported solar capacity additions of 452 GW in 2024, while Solar Power Europe estimated 597 GW of global solar installations for the same year.
• IEA estimated that installed solar PV capacity worldwide reached about 2.2 TW in 2024.
• IEA reported that solar PV supplied about 7% of global electricity in 2024 and rose to more than 8% in 2025.
• Our World in Data and Ember-based rows in the workbook show global solar electricity generation of 2,778.6 TWh in 2025 and a global solar share of 8.75%.
• China generated about 1,175 TWh of solar electricity in 2025, making it the largest solar generation market in the dataset.
• The United States generated about 388.8 TWh of solar electricity in 2025, while India generated about 196 TWh.
• IRENA reported China added 315.1 GW of solar capacity in 2025, while India added 37.0 GW and the United States added 34.0 GW.
• IEA projects renewable power capacity will increase by almost 4,600 GW between 2025 and 2030, with solar PV representing roughly 80% of that growth.
• Solar and wind together accounted for 96.6% of net renewable additions in 2024, showing that variable renewables now dominate new clean-power deployment.
• High-solar-share markets such as Chile, Spain, Australia, Germany, and Pakistan show that solar is no longer only a capacity story; it is becoming a meaningful electricity-share story.
Solar market readout
A useful solar scorecard should not treat all growth as equal. Capacity growth shows construction volume, generation shows actual output, investment shows confidence, and grid readiness shows whether the system can absorb more variable power without wasting electricity through curtailment.
Why Solar Energy Now Carries Terawatt-Scale Market Stakes
Solar optimization matters more when the market operates at terawatt scale. Capacity figures do not tell a developer exactly where to build or a policymaker exactly which incentive to change, but they show why small percentage changes in deployment, curtailment, financing cost, or module price can become material when the market is measured in hundreds of gigawatts per year.
The solar market has also become a power-system planning issue. When annual additions are measured in hundreds of gigawatts, solar affects transmission planning, storage procurement, wholesale power prices, manufacturing margins, land use, grid queues, and corporate electricity strategies. That is why market-size statistics should be reviewed beside generation and grid-readiness statistics.
Market-size and growth benchmarks
• Global renewable capacity rose by 585 GW in 2024 and by about 692 GW in 2025, according to IRENA-related data points used in this article.
• Renewables accounted for 92.5% of all installed power capacity expansion in 2024.
• The renewable share of total installed power capacity rose to 46.4% in 2024 and about 49.4% in 2025.
• Solar represented 42% of global renewable power capacity at the end of 2024, making it the largest renewable technology by installed capacity.
• Solar Power Europe reported that global cumulative installed solar PV capacity reached 2.2 TW by the end of 2024.
• IEA expects renewable capacity growth through 2030 to be dominated by solar PV, which is forecast to account for about 80% of new renewable capacity additions.
• Global solar generation increased by about 600 TWh in 2025, the largest one-year increase ever recorded for any renewable source in the IEA data referenced in the workbook.
• By 2025, the workbook shows the world producing 337.6 kWh of solar electricity per person, which makes solar output a visible part of electricity supply rather than only an installation statistic.
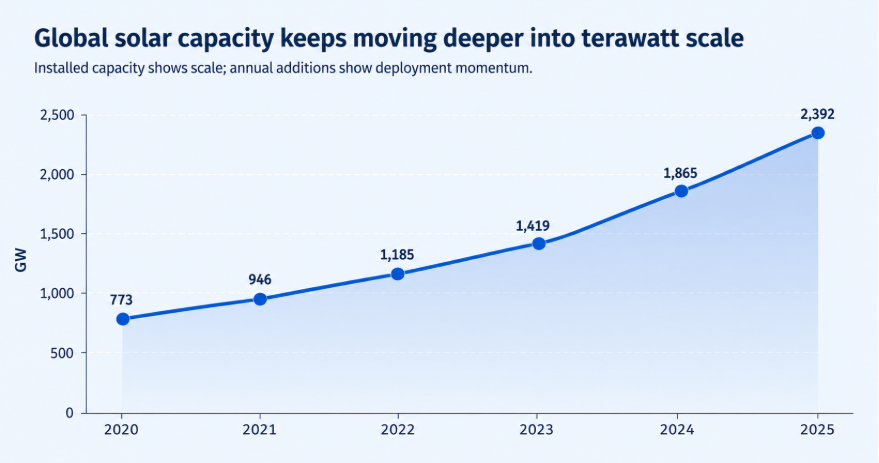
Figure 1. Global solar capacity and annual additions should be reviewed together because cumulative capacity shows market scale, while annual additions show where deployment momentum and capital allocation are strongest now.
| Metric | Latest benchmark | Why it matters |
|---|---|---|
| Global renewable capacity | 5,149 GW in 2025 | The clean-power system is approaching half of installed capacity. |
| Global solar capacity | About 2,392 GW in 2025 | Solar has moved deeply into terawatt scale. |
| Annual solar additions | About 510.3 GW in 2025 | Deployment momentum and project pipeline strength. |
| Global solar generation | 2,778.6 TWh in 2025 | Installed panels are producing large-scale electricity. |
| Solar share of electricity | 8.75% globally in 2025 | Solar is becoming a visible part of the power mix. |
Market-scale interpretation
The most important planning lesson is that terawatt-scale solar changes the size of every related market. More solar capacity creates demand for inverters, trackers, mounting systems, cables, transformers, digital forecasting tools, battery storage, grid services, recycling capacity, and skilled installation labor.
Global Solar Capacity and Annual Additions
Installed capacity shows how large the solar market has become. Annual additions show where momentum is strongest now. Both metrics are needed because a mature market can have a large cumulative base but slower new deployment, while a newer market can reveal strong current demand through fast annual additions.
Capacity benchmarks worth separating
• Global solar capacity reached 1,865 GW at the end of 2024 in IRENA data and about 2,392 GW in 2025 in IRENA-related reporting.
• Solar additions reached 452 GW in 2024 in IRENA data and about 510.3 GW in 2025, showing that the market added more than half a terawatt in a single year.
• China accounted for 315.1 GW of solar additions in 2025, which means one country represented the majority of global annual solar deployment.
• Asia added 371.2 GW of solar capacity in 2025, showing that the region is the global center of deployment volume.
• India added 37.0 GW in 2025, reinforcing its role as one of the largest growth markets for solar power.
• The United States added 34.0 GW in 2025, keeping it among the largest annual deployment markets even as grid and interconnection constraints remain important.
• Germany added 15.1 GW in 2025, showing that mature European markets can still deliver high-volume solar growth.
• Brazil added 11.6 GW in 2025, confirming Latin America as a meaningful solar-growth region rather than a peripheral market.
• In 2024, China added 278.0 GW, India added 24.5 GW, the United States added 38.3 GW, Brazil added 15.2 GW, and Germany added 15.1 GW according to IRENA data in the workbook.
• Solar photovoltaic power accounted for almost all solar power growth, confirming that PV, rather than concentrated solar power, is the dominant solar technology in new capacity additions.
| Country / Region | Recent solar additions | Article use |
|---|---|---|
| China | 315.1 GW in 2025 | Global deployment engine and supply-chain center. |
| India | 37.0 GW in 2025 | Fast-growing demand market with large electricity needs. |
| United States | 34.0 GW in 2025 | Major utility-scale and distributed solar market. |
| Germany | 15.1 GW in 2025 | Mature European market with continued annual additions. |
| Brazil | 11.6 GW in 2025 | Latin America leader with utility and distributed growth. |
Capacity interpretation
Capacity statistics should be read as deployment evidence, not as the full market story. The next question is whether new capacity can connect to the grid, generate electricity at expected levels, avoid curtailment, earn stable revenue, and support the local power mix. That is why annual additions should sit beside generation, grid, and finance metrics in the article.
Solar Electricity Generation and Power-Mix Share
Generation statistics show whether installed capacity is becoming useful electricity. They are especially important for solar because output depends on sunlight, capacity factors, curtailment, seasonal demand, grid access, storage availability, and how quickly projects move from installation to operation.
Solar generation benchmarks
• Global solar electricity generation reached about 2,778.6 TWh in 2025 in the workbook dataset.
• The world produced about 8.75% of electricity from solar power in 2025, according to the regional snapshot data.
• China generated about 1,175 TWh from solar power in 2025, more than any other country in the top-list dataset.
• The United States generated about 388.8 TWh of solar electricity in 2025, making it the second-largest solar generation market in the dataset.
• India generated about 196 TWh from solar power in 2025, showing that rapid capacity growth is translating into electricity output.
• Japan, Germany, Brazil, Spain, Australia, Italy, the Netherlands, and France also appear among major solar generation markets in the top-list data.
• Asia generated about 1,716.5 TWh of solar electricity in 2025, making it the largest regional solar generation bloc.
• Europe generated about 385.7 TWh of solar electricity in 2025, while North America generated about 441.5 TWh.
• South America generated about 134.7 TWh of solar electricity in 2025, with Brazil and Chile playing important roles in regional output.
• Oceania generated about 46.1 TWh of solar electricity in 2025, reflecting Australia’s high rooftop and utility-scale penetration.
• Africa generated about 54.2 TWh of solar electricity in 2025, showing growth potential but also the gap between resource potential and grid-connected output.
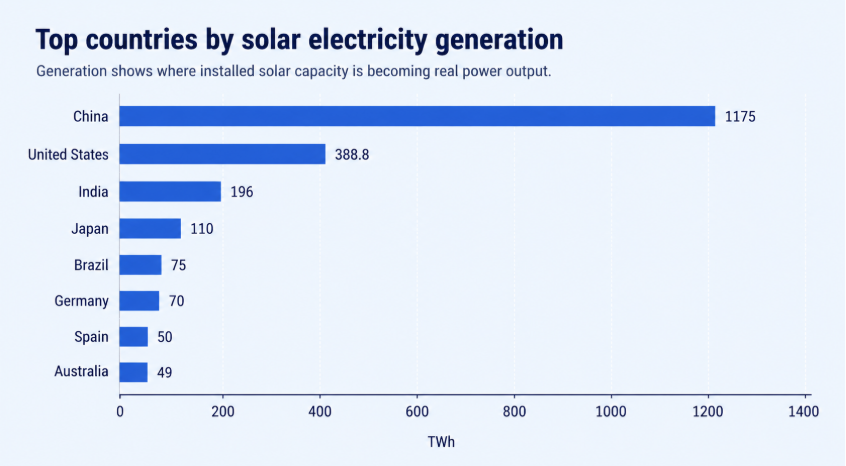
Figure 2. Solar generation leaders show where installed capacity is becoming real power output, which is the better test of market impact than capacity totals alone.
| Market | Solar generation signal | Interpretation |
|---|---|---|
| China | About 1,175 TWh in 2025 | Largest solar output market and the biggest driver of global generation growth. |
| United States | About 388.8 TWh in 2025 | Large installed base with strong utility-scale contribution. |
| India | About 196 TWh in 2025 | Fast demand growth and expanding solar contribution. |
| Europe | About 385.7 TWh in 2025 | Solar is becoming an energy-security and decarbonization asset. |
| South America | About 134.7 TWh in 2025 | Brazil and Chile show the regional solar opportunity. |
Generation readout
Generation is the bridge between solar deployment and power-system value. A country can install large capacity, but the market impact depends on how much electricity the assets produce and when that electricity is available. That is why solar generation, solar share of electricity, curtailment, and storage should be reviewed together rather than as separate topics.
Solar PV Additions: Where Growth Is Fastest
Annual additions are the clearest measure of current market speed. They show where developers are building, where policy has opened the door to new projects, where power demand is growing, and where financing and permitting are moving quickly enough to convert market interest into installed capacity.
Annual installation benchmarks
• World solar capacity additions reached about 510.3 GW in 2025, after 452 GW in 2024 in IRENA data.
• China added 315.1 GW in 2025, far ahead of every other country in the annual additions table.
• India added 37.0 GW in 2025, after adding 24.5 GW in 2024, showing a strong acceleration in deployment.
• The United States added 34.0 GW in 2025, after adding 38.3 GW in 2024.
• Germany added 15.1 GW in 2025, broadly matching its 2024 additions and showing sustained European deployment.
• Brazil added 11.6 GW in 2025 after 15.2 GW in 2024, keeping it among the most important non-Asian and non-European solar markets.
• Asia added 371.2 GW of solar capacity in 2025, which makes regional analysis essential for any global solar statistics article.
• South Korea added 3.7 GW in 2025 after adding 3.1 GW in 2024, showing a smaller but steady advanced-economy market.
• China’s additions alone were larger than the combined additions of many major solar markets, which makes global averages heavily influenced by one market.
• Markets with smaller absolute additions can still have high solar-share impact if their power systems are smaller, as seen in countries such as Chile, Luxembourg, Hungary, and Pakistan.
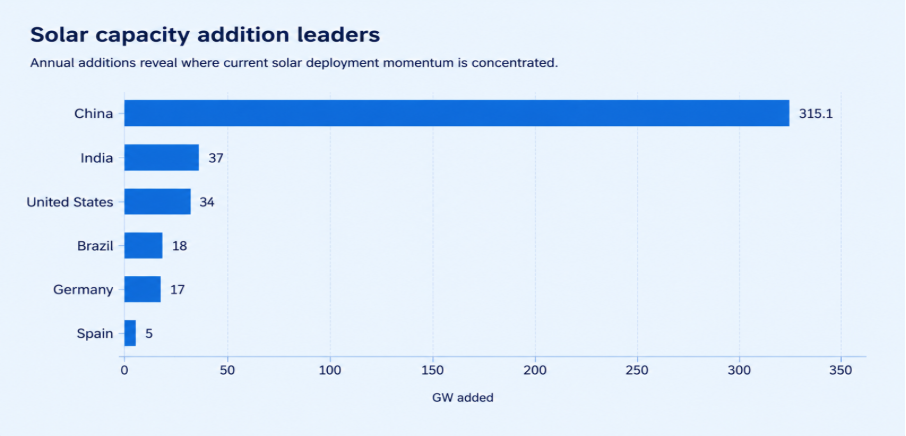
Figure 3. Solar capacity addition leaders show that current deployment momentum is concentrated in a few large markets, while policy design and grid readiness determine whether additions become dependable generation.
Additions rule
Annual additions should be interpreted with country size in mind. A 10 GW addition may be transformational for one power system but modest for another. For that reason, additions should be paired with electricity share, generation output, per-capita output, and grid-readiness metrics.
Solar Costs, Module Prices, and Competitiveness
Cost decline is the reason solar moved from a policy-supported clean-energy option into a mainstream power-generation technology. However, low module prices do not automatically make every project cheap. Final project economics depend on financing, grid connection, land, labor, permitting, local taxes, tariffs, storage needs, and power-purchase contract structure.
Cost and competitiveness benchmarks
• IEA’s market analysis has repeatedly identified solar PV as one of the cheapest sources of new electricity in many markets when resource quality, financing, and grid connection are favorable.
• Module oversupply has pushed global PV module prices lower, supporting project economics but pressuring manufacturer margins.
• Utility-scale solar is usually more cost efficient than small rooftop systems because it benefits from larger procurement, standardized installation, and optimized project design.
• Rooftop solar remains attractive in markets where retail electricity prices are high, net metering or self-consumption rules are favorable, and household financing is available.
• Commercial and industrial solar can be especially attractive because many businesses consume electricity during daylight hours, when solar output is strongest.
• Solar-plus-storage changes the cost equation because batteries increase capital cost but can improve evening use, peak shaving, resilience, and grid value.
• High interest rates can slow solar deployment because solar projects are capital-intensive and depend heavily on long-term financing assumptions.
• Grid connection costs and waiting times can offset module-price savings when projects sit in interconnection queues or require expensive transmission upgrades.
• Local labor, permitting complexity, import duties, and land acquisition can create large regional differences in installed project cost.
• The most useful cost benchmark is not module price alone; it is delivered project cost compared with expected generation, curtailment risk, financing cost, and contract revenue.
| Cost signal | What to compare | Why it matters |
|---|---|---|
| Module prices | PV module price trends by region | Equipment-cost pressure and manufacturer margin risk. |
| Installed project cost | Utility-scale, rooftop, and commercial systems | Shows the real cost paid by developers or customers. |
| Financing cost | Debt, equity, and interest-rate assumptions | Solar economics are highly sensitive to capital costs. |
| Grid connection cost | Interconnection and upgrade charges | Can erase savings from lower equipment prices. |
| Storage cost | Battery attachment and duration | Determines whether solar can serve evening and peak demand. |
Cost interpretation
Solar cost statistics should be used carefully. Falling module prices support adoption, but they do not remove the need for bankable offtake, stable regulation, efficient permitting, and grid access. A low-cost panel still becomes a weak investment if the project cannot connect, is heavily curtailed, or faces uncertain revenue rules.
Utility-Scale, Rooftop, and Distributed Solar
Solar is not one market segment. Utility-scale solar adds large grid-connected capacity. Rooftop solar changes household electricity economics. Commercial and industrial solar helps businesses manage power costs. Off-grid systems expand access where centralized grids are weak or unavailable.
Solar segment benchmarks
• Utility-scale solar drives much of the world’s new capacity because large projects can be procured, financed, and connected at scale.
• Rooftop solar is especially important in high-retail-tariff markets because customers compare solar savings against the price they pay for grid electricity.
• Australia is one of the clearest examples of high rooftop solar penetration, with solar contributing 19.59% of electricity in 2025 in the workbook data.
• Commercial and industrial solar is attractive for warehouses, factories, retail centers, cold storage, logistics facilities, and data-driven businesses with daytime demand.
• Distributed solar can reduce line losses and customer bills, but it can also create new requirements for distribution-grid visibility, voltage management, and tariff design.
• Off-grid solar remains important for rural electrification, solar home systems, mini-grids, solar pumps, schools, clinics, and small enterprises.
• Solar-plus-storage is becoming a separate segment because batteries change when solar power can be used and how much grid value a project can provide.
• Policy design can favor one segment over another through auctions, net metering, feed-in tariffs, tax credits, rooftop subsidies, or corporate power-purchase rules.
| Segment | Primary metric | Market role |
|---|---|---|
| Utility-scale solar | Annual capacity additions and project pipeline | Adds large grid-connected power capacity. |
| Residential rooftop | Installations, payback, and net metering | Turns households into electricity producers. |
| Commercial and industrial solar | Self-consumption, PPA savings, and rooftop capacity | Reduces business electricity-cost exposure. |
| Off-grid solar | Solar home systems and mini-grid deployment | Supports energy access outside reliable grids. |
| Solar-plus-storage | Battery attachment and discharge value | Improves flexibility and evening use. |
Segment readout
A strong solar article should not treat every megawatt the same. A utility-scale project affects wholesale supply and transmission. A rooftop system affects retail bills and distribution networks. A commercial system affects business operating cost. An off-grid system affects energy access. The article should make those differences visible.
Solar Investment and Project Finance
Solar is also a capital-allocation market. Deployment depends on whether developers can secure land, permits, interconnection, equipment, financing, offtake contracts, and construction capacity. Even when solar technology is competitive, project finance determines which markets convert opportunity into operating assets.
Investment and finance benchmarks
• Clean-energy investment has increasingly shifted toward power generation, grids, storage, and electrification, making solar a central component of energy-transition finance.
• Utility-scale solar projects often depend on long-term power-purchase agreements, auctions, merchant revenue assumptions, or hybrid solar-storage contracts.
• Corporate solar procurement grows when companies want price visibility, emissions reduction, and electricity-security benefits.
• Financing conditions matter because solar has high upfront cost and low operating cost, making project returns sensitive to debt pricing.
• Policy stability affects cost of capital because investors price uncertainty around tariffs, tax credits, auctions, curtailment rules, and grid access.
• Grid-connection risk is now an investment risk because delayed interconnection can turn a technically viable project into a stranded pipeline asset.
• Module-price declines can improve project economics, but developers may not capture the full benefit if interconnection, labor, land, or financing costs rise.
• Investors should compare project-level economics with country-level solar share, curtailment risk, storage buildout, power demand growth, and policy durability.
| Investment signal | What to measure | Why it matters |
|---|---|---|
| Annual investment | Capital flowing into solar PV projects | Shows market confidence and pipeline activity. |
| Project pipeline | Capacity under development or waiting for grid connection | Shows future deployment potential. |
| PPA prices | Contracted revenue and buyer demand | Shows commercial viability. |
| Cost of capital | Debt pricing and equity return requirements | Affects project returns more than many operating costs. |
| Interconnection queue | Time between project application and grid connection | Reveals deployment bottlenecks. |
Investment interpretation
Solar finance should be read as a risk-adjusted deployment signal. Strong demand and cheap modules are not enough if projects face unclear policy, slow permitting, grid queues, or curtailment. The strongest markets are those where capital can move from pipeline to construction to operation with predictable rules.
Regional Solar Energy Intelligence
Regional solar data is one of the highest-value parts of a solar statistics article. Global averages hide major differences in resource quality, electricity demand, policy design, manufacturing capacity, grid readiness, rooftop adoption, and storage needs.
Asia-Pacific
• Asia added 371.2 GW of solar capacity in 2025, making it the dominant region for annual deployment.
• China added 315.1 GW of solar capacity in 2025 and generated about 1,175 TWh of solar electricity, making it the largest solar market by both additions and output.
• India added 37.0 GW of solar capacity in 2025 and generated about 196 TWh from solar, showing the combination of fast demand growth and large renewable targets.
• Japan remains a major solar generation market, even though its growth profile differs from newer high-addition markets.
• Australia produced 19.59% of electricity from solar in 2025, making it a leading example of high rooftop and utility-scale solar penetration.
• Southeast Asian markets require country-level analysis because Vietnam, Thailand, Indonesia, the Philippines, and Malaysia have different rooftop, utility-scale, and grid-policy conditions.
Europe
• Europe generated about 385.7 TWh from solar power in 2025, while the European Union generated about 305.5 TWh.
• Germany added 15.1 GW of solar capacity in both 2024 and 2025 and produced 17.91% of electricity from solar in 2025.
• Spain produced 21.85% of electricity from solar in 2025, making it one of Europe’s most important high-solar-share markets.
• The Netherlands produced 21.12% of electricity from solar in 2025, showing how a dense market can achieve a high solar share through rooftops and distributed assets.
• Hungary produced 27.29% of electricity from solar in 2025, one of the strongest shares in the workbook dataset.
• Italy produced 16.86% of electricity from solar in 2025, keeping it among Europe’s meaningful solar-share markets.
• Europe’s solar story is closely linked to energy security, wholesale price exposure, industrial competitiveness, and decarbonization policy.
North America
• North America generated about 441.5 TWh from solar power in 2025, with the United States accounting for most of the regional total.
• The United States generated about 388.8 TWh from solar in 2025 and added 34.0 GW of solar capacity in the same year.
• U.S. solar growth is shaped by utility-scale projects, distributed generation, tax incentives, domestic manufacturing policy, transmission expansion, and interconnection queues.
• Canada remains smaller than the United States in solar generation but has growing provincial opportunities where policy and grid economics support deployment.
• Mexico has strong solar resource potential, but market growth depends on regulation, project procurement, grid access, and investor confidence.
Latin America
• South America generated about 134.7 TWh from solar power in 2025, showing a meaningful regional contribution.
• Brazil added 11.6 GW of solar capacity in 2025 after adding 15.2 GW in 2024, making it Latin America’s most important large-volume solar market.
• Chile produced 25.06% of electricity from solar in 2025, showing one of the strongest solar-power shares among major markets in the dataset.
• Latin American solar growth depends on auctions, distributed-generation rules, currency and financing conditions, grid access, and demand from mining, industry, and urban load centers.
• Mexico, Colombia, Argentina, Peru, and Central American markets should be analyzed separately because solar policy, grid readiness, and procurement models vary widely.
Middle East and Africa
• Africa generated about 54.2 TWh from solar power in 2025, which is still modest relative to the region’s resource potential.
• South Africa is one of Africa’s most important solar markets because power reliability, corporate procurement, and distributed generation have become major drivers.
• The Middle East combines very strong solar resources with large utility-scale project opportunities in markets such as the UAE and Saudi Arabia.
• Egypt and Morocco show how solar can support utility-scale procurement, energy security, and regional clean-power planning.
• Off-grid solar remains important across parts of Africa and South Asia because it can provide electricity access where grid extension is slow, expensive, or unreliable.
• The region’s opportunity depends not only on sunlight, but also on grid investment, finance, storage, policy execution, and local project-development capacity.
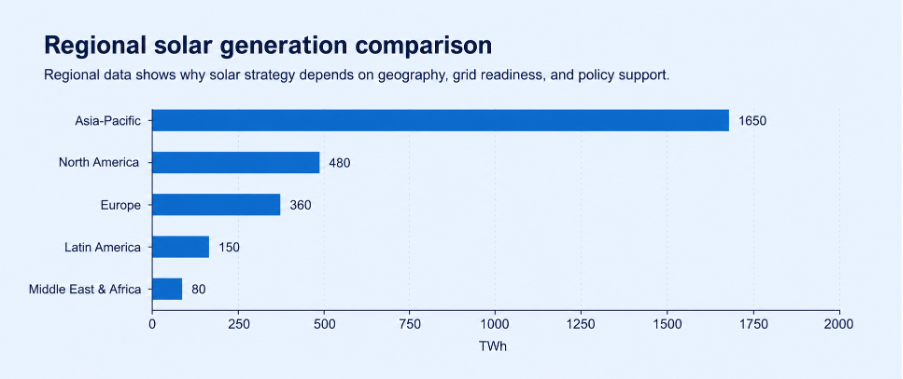
Figure 4. Regional solar data shows why global averages are not enough: each region is shaped by a different mix of manufacturing scale, energy security, utility procurement, distributed generation, and energy-access needs.
| Region | Solar market pattern | Article interpretation |
|---|---|---|
| Asia-Pacific | Largest additions and manufacturing scale | Solar leadership is driven by China and supported by India, Japan, Australia, and Southeast Asia. |
| Europe | High policy support and rising solar share | Solar is tied to energy security, decarbonization, and retail power economics. |
| North America | Large utility-scale market with rooftop growth | U.S. grid queues, incentives, and transmission planning shape deployment speed. |
| Latin America | Brazil volume and Chile solar share | Distributed generation, auctions, and resource quality define growth. |
| Middle East & Africa | High resource and access opportunity | Large projects and off-grid use cases define the opportunity, but grids and finance matter. |
Regional interpretation
Regional solar analysis should also separate absolute scale from penetration. China dominates capacity and generation, but markets such as Chile, Australia, Spain, and the Netherlands show how solar can become a high-share electricity source when policy, resource quality, rooftop adoption, and grid planning align.
Country-Level Solar Energy Statistics
Country-level statistics prevent global averages from hiding the real market structure. China defines global volume. The United States defines large-scale project finance and grid-queue challenges. India defines fast demand growth. Germany, Spain, the Netherlands, Hungary, and Italy show European solar-share penetration. Brazil and Chile define Latin American momentum. Australia shows how rooftop adoption can reshape the power mix.
Country benchmarks to use in the article
• China generated about 1,175 TWh from solar power in 2025 and added 315.1 GW of capacity, making it the world’s largest solar market by a wide margin.
• The United States generated about 388.8 TWh from solar power in 2025 and added 34.0 GW of solar capacity, keeping it among the largest deployment markets.
• India generated about 196 TWh from solar power in 2025 and added 37.0 GW of capacity, showing strong growth in a high-demand electricity market.
• Germany produced 17.91% of electricity from solar in 2025 and added 15.1 GW of capacity, showing that mature markets can still grow.
• Spain produced 21.85% of electricity from solar in 2025, placing it among the strongest European solar-share markets.
• The Netherlands produced 21.12% of electricity from solar in 2025, showing how distributed solar can influence electricity share in a dense power market.
• Hungary produced 27.29% of electricity from solar in 2025, one of the highest shares in the dataset.
• Australia produced 19.59% of electricity from solar in 2025, supported by a strong rooftop solar culture and utility-scale growth.
• Pakistan produced 18.77% of electricity from solar in 2025 in the dataset, showing how fast solar adoption can become visible in the power mix.
• Chile produced 25.06% of electricity from solar in 2025, making it a high-penetration solar market in Latin America.
• Brazil added 11.6 GW of capacity in 2025 and remains Latin America’s highest-volume solar market.
• Italy produced 16.86% of electricity from solar in 2025, while Greece produced 22.17%, showing strong Mediterranean solar contribution.
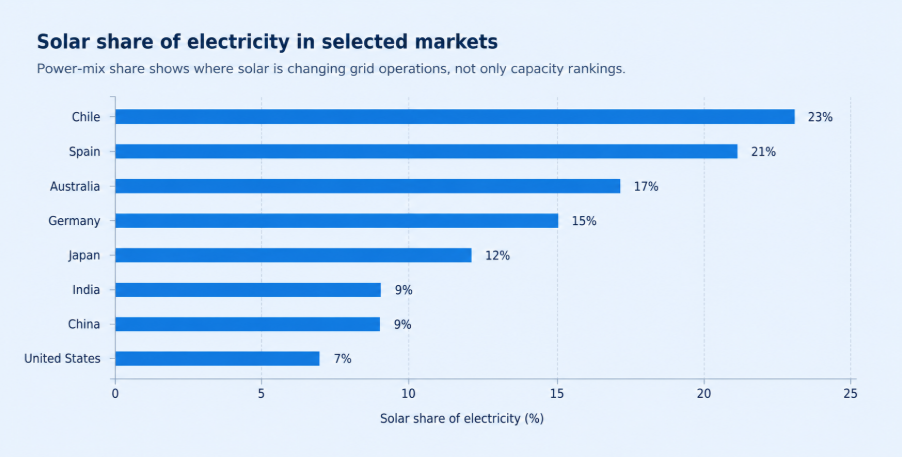
Figure 5. Solar share of electricity by selected markets shows why penetration rates matter: smaller power systems can become high-solar markets even when their absolute generation is below China, the United States, or India.
| Country | Solar strength | Key benchmark |
|---|---|---|
| China | Largest capacity and generation market | 315.1 GW added and about 1,175 TWh generated in 2025. |
| United States | Large utility-scale and distributed market | 34.0 GW added and about 388.8 TWh generated in 2025. |
| India | Fast-growing demand market | 37.0 GW added and about 196 TWh generated in 2025. |
| Germany | Mature European leader | 15.1 GW added and 17.91% solar share in 2025. |
| Spain | High solar electricity share | 21.85% of electricity from solar in 2025. |
| Brazil | Latin America deployment leader | 11.6 GW added in 2025. |
| Australia | Rooftop and distributed solar strength | 19.59% of electricity from solar in 2025. |
| Chile | High solar-share market | 25.06% of electricity from solar in 2025. |
Country-level rule
Country-level rankings are most useful when they explain the reason behind growth. China reflects manufacturing scale and national deployment speed. The United States reflects utility-scale development and state-level variation. India reflects demand growth and energy-security planning. Australia reflects rooftop adoption. Brazil reflects the importance of distributed generation rules.
Solar Manufacturing and Supply Chain
Deployment depends on upstream manufacturing. Module prices, polysilicon availability, wafer and cell capacity, inverter supply, trade policy, tariffs, and local manufacturing incentives affect how quickly markets can build and at what cost.
Manufacturing and supply-chain benchmarks
• China is central to global solar manufacturing, which means deployment, module pricing, and trade policy are closely connected.
• Large manufacturing scale has helped reduce module prices and support global adoption, but it has also created concentration risk for countries seeking supply security.
• Module oversupply can benefit developers through lower prices while putting pressure on manufacturers, inventories, and margins.
• India, the United States, and Europe have pursued domestic manufacturing support to reduce reliance on imported modules and create local industrial capacity.
• Supply-chain localization can improve energy security, but it may raise costs if domestic manufacturing is less competitive than global supply.
• Inverters, transformers, batteries, mounting systems, and grid equipment are also part of the solar supply-chain story because projects require more than panels.
• Trade restrictions and tariffs can change project economics quickly, especially for markets that rely heavily on imported modules.
• Recycling, end-of-life management, and material recovery will become more important as early solar assets age and replacement volumes rise.
| Supply-chain area | Key risk | Market impact |
|---|---|---|
| Polysilicon | Geographic concentration | Creates price and policy exposure. |
| Wafers and cells | Manufacturing dependence | Affects supply security and industrial strategy. |
| Modules | Oversupply and tariffs | Changes project cost and manufacturer margins. |
| Inverters | Grid compatibility and reliability | Affects system performance and integration. |
| Batteries | Storage availability and cost | Determines flexibility and evening-use value. |
| Recycling | End-of-life planning | Shapes long-term sustainability and compliance. |
Supply-chain interpretation
Solar supply-chain statistics explain why a low-cost technology can still face political and industrial risk. Policymakers want secure supply, manufacturers want margin stability, developers want low-cost modules, and grid planners want reliable equipment. The market balance between those goals affects deployment speed.
Solar Storage, Grid Integration, and Curtailment
As solar grows, the market challenge shifts from installing panels to integrating variable electricity. Solar generation is strongest during daylight hours, while demand often peaks later. High penetration therefore creates a need for batteries, transmission, flexible demand, better forecasting, and market rules that reward flexibility.
Grid and storage benchmarks
• IEA reported solar PV supplied about 7% of global electricity in 2024 and more than 8% in 2025, which means grid integration is now a mainstream power-system issue.
• High-solar-share countries such as Chile, Spain, Australia, Germany, Hungary, Pakistan, Greece, and the Netherlands show why flexibility planning matters.
• Curtailment becomes more likely when solar output rises faster than transmission, storage, and flexible demand.
• Battery storage improves solar value by shifting daytime output into evening hours, reducing peak demand, and supporting system balancing.
• Solar-plus-storage projects can help reduce curtailment, but they require different revenue models from stand-alone solar projects.
• Interconnection queues can delay projects even after financing, land, and equipment have been secured.
• Distribution grids need upgraded visibility and control when rooftop solar adoption becomes high.
• Wholesale market design matters because solar-heavy systems may experience low or negative midday prices and higher evening flexibility value.
• Transmission investment is critical where the best solar resources are far from load centers.
• Demand response, electric vehicles, heat pumps, industrial flexibility, and smart charging can all improve the value of solar generation.
| Grid signal | What it reveals | Likely response |
|---|---|---|
| Curtailment rate | Solar output exceeds usable grid demand | Add storage, transmission, flexible demand, or export capacity. |
| Interconnection queue | Projects cannot connect quickly | Reform grid studies and expand network capacity. |
| Midday price pressure | Solar supply is concentrated in daylight hours | Create storage and demand-response value. |
| Battery attachment | Solar is being paired with flexibility | Improve evening use and revenue quality. |
| Distribution constraints | Rooftop solar stresses local networks | Upgrade voltage control and feeder visibility. |
Grid-readiness rule
The next stage of solar growth will be judged less by panel installation speed and more by system flexibility. Markets that add solar without adding storage, transmission, forecasting, demand response, and flexible pricing can face lower project value even when headline capacity numbers remain strong.
Solar Market Challenges and Deployment Risks
Solar growth is strong, but it is not frictionless. The main risks are no longer only technology cost. They include grid connection, permitting, curtailment, financing, supply-chain concentration, trade rules, land access, labor availability, and policy uncertainty.
Solar market barriers worth separating
• Grid connection delays can slow solar deployment even when projects are fully developed and commercially attractive.
• Transmission constraints can prevent low-cost solar resources from reaching demand centers.
• Curtailment can reduce project revenue and weaken the value of installed capacity.
• Permitting delays can increase soft costs and create uncertainty for developers and investors.
• High interest rates can reduce project returns because solar requires large upfront capital investment.
• Supply-chain concentration can expose markets to trade disputes, tariff changes, and import bottlenecks.
• Module oversupply can help buyers but weaken manufacturers, potentially affecting long-term industrial stability.
• Policy uncertainty can slow investment when developers cannot predict auction rules, incentives, net metering, tax credits, or grid-access terms.
• Land-use conflicts can become more visible as utility-scale solar expands near agriculture, conservation areas, or communities.
• End-of-life management and recycling will become more important as the installed base ages and replacement volumes grow.
• Labor shortages can delay installation, grid work, electrical upgrades, and operations in fast-growing markets.
• Cybersecurity and inverter standards may become more important as distributed solar and smart grid assets expand.
| Challenge | Core metric | Likely owner |
|---|---|---|
| Grid connection delay | Interconnection queue time | Grid operator / regulator. |
| Curtailment | Lost generation and curtailed output share | Utility / system operator. |
| Financing pressure | Cost of capital and PPA pricing | Developers / investors. |
| Policy uncertainty | Incentive changes and auction delays | Government / regulator. |
| Supply-chain risk | Import dependence and tariff exposure | Manufacturers / policymakers. |
| Land and permitting | Approval timeline and rejection rate | Local authorities / developers. |
| End-of-life risk | Recycling capacity and decommissioning rules | Regulators / asset owners. |
Risk interpretation
Risk should also be separated by time horizon. Short-term risk often comes from permitting, grid connection, tariff changes, or financing costs. Medium-term risk comes from curtailment, storage shortages, and oversupply in project pipelines. Long-term risk comes from recycling, land use, component reliability, and whether grids are redesigned for high renewable penetration.
Off-Grid Solar and Energy Access
Off-grid solar deserves a dedicated section because not every solar statistic is about large grid-connected power plants. Solar home systems, mini-grids, solar pumps, health-clinic systems, school electrification, and productive-use appliances can create economic value in places where grid access is weak, unreliable, or expensive.
Energy-access benchmarks and use cases
• Off-grid solar capacity is small compared with utility-scale solar, but its development impact can be high because it serves homes and businesses that lack reliable electricity.
• Solar home systems can provide lighting, phone charging, radios, fans, and basic appliance use in areas where grid expansion is slow.
• Solar mini-grids can support communities, small enterprises, agricultural processing, and local services.
• Solar water pumps can reduce diesel use and improve agricultural productivity when paired with sustainable water management.
• Health clinics can use solar systems to support refrigeration, lighting, communications, and basic medical equipment.
• Schools can use solar to support lighting, digital learning, and after-hours educational activity.
• Productive-use solar becomes more valuable when it supports income-generating equipment rather than only household lighting.
• Off-grid solar requires different metrics from utility-scale solar, including customers served, system reliability, affordability, appliance use, and business productivity.
| Use case | Market role |
|---|---|
| Solar home systems | Provide basic household electricity access. |
| Mini-grids | Support community and village-level power. |
| Solar pumps | Improve agricultural productivity and reduce diesel use. |
| Health clinics | Support cold storage, lighting, and essential services. |
| Schools | Enable lighting, connectivity, and digital learning. |
| Small businesses | Power productive equipment and local commerce. |
Energy-access interpretation
Off-grid solar also gives the article a different kind of market story. In mature power systems, solar is mainly a cost, carbon, and capacity tool. In underserved markets, it can be the first reliable electricity source for homes, farms, clinics, schools, telecom towers, and small businesses.
Solar Market Diagnostic Framework
| Problem area | Core signals to measure | Useful benchmark type |
|---|---|---|
| Market scale | Installed capacity and annual additions | Global, regional, and country capacity data. |
| Generation impact | Solar generation and solar share of electricity | Power-mix and output data. |
| Investment quality | Project pipeline, PPA prices, and cost of capital | Finance and market-confidence data. |
| Grid readiness | Curtailment, interconnection, storage deployment | Grid integration and flexibility data. |
| Policy support | Incentives, auctions, tariffs, net metering | Country policy and regulatory data. |
| Supply-chain strength | Module prices, manufacturing capacity, import dependence | Manufacturing and trade data. |
| Consumer adoption | Rooftop installations, payback, battery attachment | Residential and distributed-solar data. |
Diagnostic principle
Each solar statistic should answer a clear question: where is solar growing, what is driving it, what is blocking it, and which markets are turning capacity into real electricity output? A blended global number is useful only as the starting point. The diagnosis comes from separating capacity, generation, finance, grid, policy, and supply-chain signals.
90-Day Solar Benchmark Plan
Statistics become useful when they are translated into a measurement plan. A practical solar market review can be organized into a 90-day cycle rather than a vague market-monitoring exercise.
| Timing | What to do | Output |
|---|---|---|
| Days 1-30 | Build a baseline by country, capacity, additions, generation, solar share, investment, and segment. | Market-size and growth map. |
| Days 31-60 | Compare regional drivers, policy support, grid readiness, storage growth, supply-chain exposure, and project pipeline. | Regional opportunity scorecard. |
| Days 61-90 | Review risks such as curtailment, financing, permitting, tariffs, interconnection queues, and end-of-life planning. | Solar market risk and action plan. |
Planning principle
The best solar teams do not chase every benchmark. They compare external statistics against their own project pipeline, customer base, grid position, financing assumptions, and policy exposure. The priority should be metrics with high volume, clear ownership, and measurable financial or system impact.
Metrics Solar Market Leaders Should Track
The final scorecard should be detailed enough to locate the opportunity or bottleneck without becoming a vanity dashboard. These metrics are the minimum useful set for utilities, developers, investors, policymakers, manufacturers, and large energy buyers.
| Metric | Why it matters |
|---|---|
| Installed solar capacity | Total market scale and cumulative deployment. |
| Annual solar additions | Current growth speed and development momentum. |
| Solar electricity generation | Real power output from installed assets. |
| Solar share of electricity | Grid penetration and power-mix importance. |
| Capacity factor | Output quality relative to installed capacity. |
| Solar investment | Capital confidence and financing depth. |
| Utility-scale pipeline | Future grid-connected deployment. |
| Rooftop solar adoption | Distributed-market strength. |
| Module prices | Equipment-cost competitiveness and supply pressure. |
| LCOE and PPA pricing | Project economics and buyer willingness. |
| Storage attachment rate | Flexibility readiness. |
| Curtailment rate | Grid stress and lost output. |
| Interconnection queue | Deployment bottleneck and grid-readiness risk. |
| Manufacturing capacity | Supply-chain strength and industrial policy exposure. |
Solar Energy Market Statistics FAQ
Common questions
• What is the global solar energy market size?
The market is now measured at terawatt scale. IRENA-related data placed global solar capacity at about 2,392 GW in 2025 after more than 510 GW of annual additions.
• How much solar capacity is installed worldwide?
The workbook uses IRENA and related data showing 1,865 GW of global solar capacity at the end of 2024 and about 2,392 GW in 2025.
• Which country has the most solar energy capacity and generation?
China is the largest solar market. It added about 315.1 GW of solar capacity in 2025 and generated about 1,175 TWh from solar power.
• Which countries generate the most electricity from solar power?
The leading generation markets include China, the United States, India, Japan, Germany, Brazil, Spain, Australia, Italy, the Netherlands, and France.
• What share of global electricity comes from solar?
The workbook’s global power-mix data shows solar produced about 8.75% of world electricity in 2025.
• Why is solar energy growing so quickly?
Solar is growing because of falling technology costs, policy support, faster deployment timelines, corporate demand, energy-security goals, and strong project pipelines in large markets.
• What are the biggest challenges facing the solar market?
The main challenges are grid connection delays, curtailment, financing pressure, permitting, land access, policy uncertainty, supply-chain concentration, and storage needs.
• Why does solar need battery storage?
Battery storage helps shift daytime solar generation into evening demand, reduce curtailment, support grid balancing, and improve the revenue quality of solar projects.
• Is rooftop solar or utility-scale solar more important?
Utility-scale solar usually adds more capacity, while rooftop and distributed solar can strongly affect household bills, commercial self-consumption, and distribution-grid planning.
Final Takeaway
Solar energy market performance depends on five systems working together: capacity additions, electricity generation, project economics, grid and storage readiness, and policy-supply-chain stability. The statistics show that solar is now large enough to shape national power planning, global manufacturing, investor strategy, and electricity-market design.
The most useful solar analysis finds the actual constraint. If capacity is rising but generation is not, the issue may be grid connection, curtailment, capacity factor, or project delays. If generation is rising but project returns are weakening, the issue may be low midday prices, financing pressure, or insufficient storage value. If demand is strong but deployment slows, the issue may be permitting, interconnection, land, labor, tariffs, or policy uncertainty.
For market leaders, the practical goal is not simply to install more panels. The strongest solar markets will connect projects quickly, reduce curtailment, support storage, attract stable investment, localize supply chains where it makes economic sense, and turn installed capacity into reliable electricity generation. Solar has already crossed the scale threshold. The next phase will be defined by how well countries convert that scale into flexible, affordable, and dependable power.