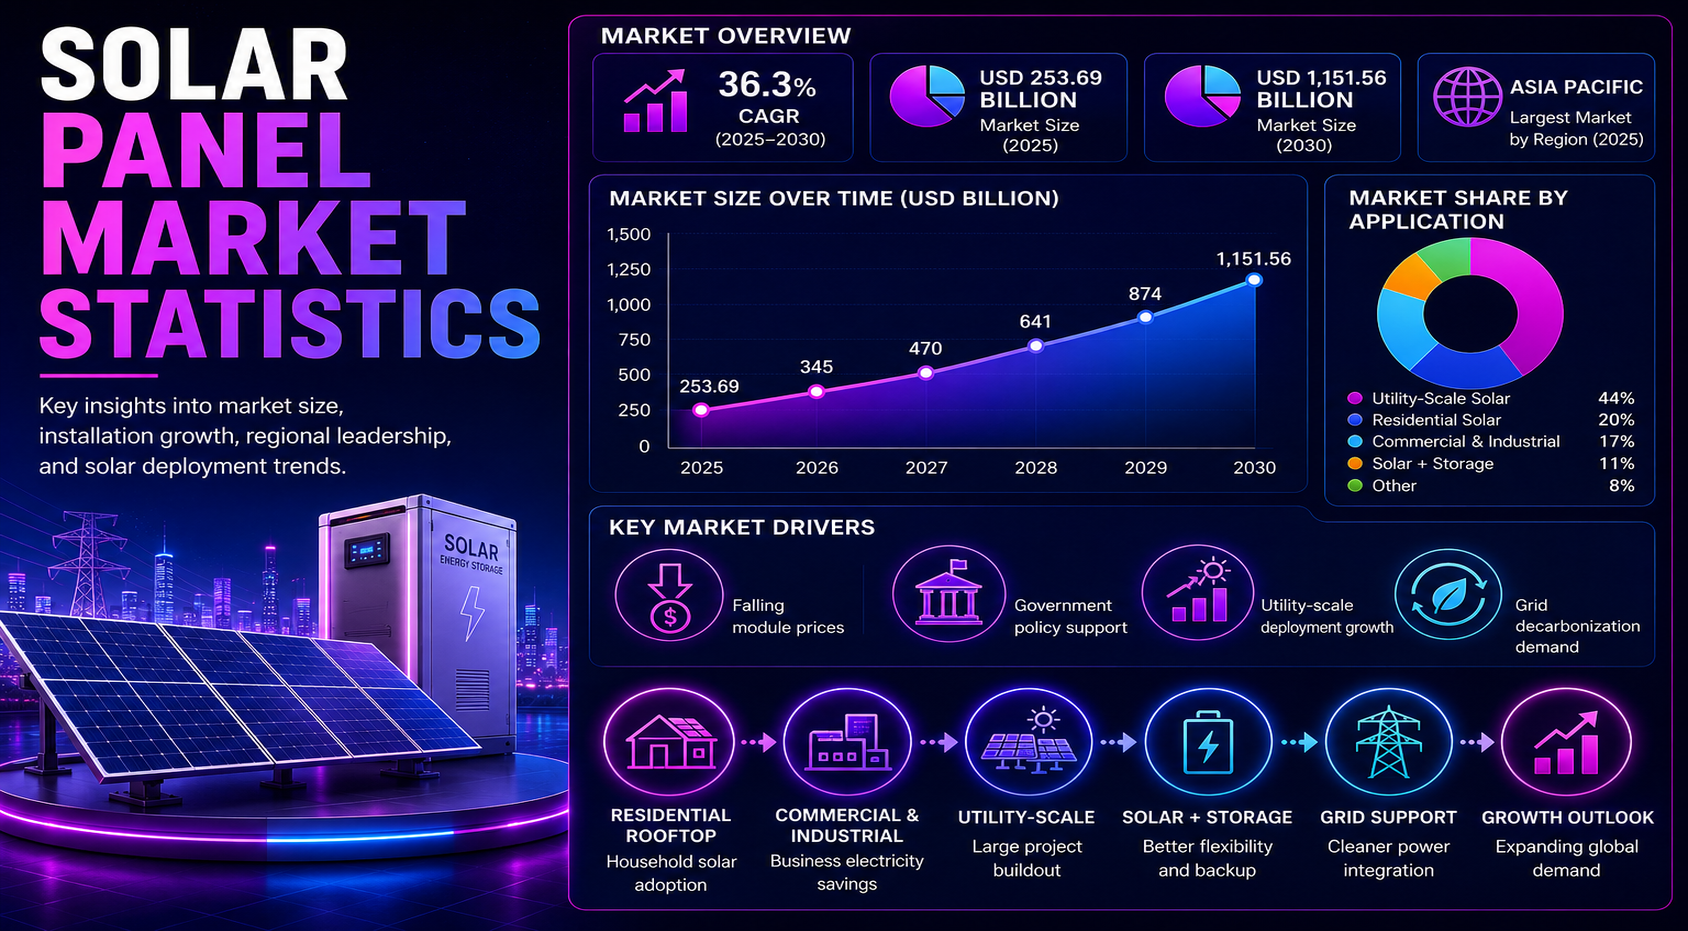
Solar panels have moved from a clean-energy option to one of the main engines of new power capacity, manufacturing investment, rooftop electrification, and utility-scale grid planning. The market is no longer measured only by panel shipments. It is measured by installed capacity, annual additions, electricity generation, panel prices, manufacturing concentration, grid-connection speed, battery attachment, policy support, and country-level demand quality.
The strongest statistics show why the market deserves its own scorecard. REN21 reported global solar PV capacity above 2 TW by the end of 2024, while Solar Power Europe reported 597 GW of new solar capacity installed in 2024 and 2.2 TW of cumulative capacity. IEA data shows solar PV accounted for the largest increase in global electricity generation in 2024, and IRENA reported that solar supplied more than three-quarters of new renewable capacity additions.
Executive Solar Panel Market Benchmarks
These are the statistics that frame the article. They show the scale of global solar deployment, the speed of annual additions, the split between utility-scale and distributed systems, the concentration of manufacturing, and the relationship between installed panels and electricity output.
The numbers that define the solar panel market
• Global solar PV capacity reached 2,247 GW by the end of 2024 in the REN21 dataset, meaning the installed base moved well beyond the 2 TW threshold.
• Solar Power Europe reported 597 GW of solar capacity installed in 2024, up from 449 GW in 2023.
• REN21 reported 602 GW of solar PV additions in 2024, showing that annual solar additions are now measured in hundreds of gigawatts.
• Utility-scale PV grew by 382 GW in 2024, while rooftop and distributed PV systems grew by 200 GW.
• Utility-scale PV growth was 43% in 2024, compared with 23% growth for distributed systems.
• IRENA reported 585 GW of renewable power additions in 2024, with solar responsible for more than three-quarters of renewable expansion.
• IEA reported that solar PV generation increased by about 480 TWh in 2024, the largest increase of any electricity source.
• Ember reported that renewables supplied a record 32% of global electricity in 2024, with solar and wind as the main growth engines.
• China accounted for around 60% of global solar PV capacity additions in 2024 and 47% of the total installed base, according to REN21.
• China generated 834.1 TWh of solar electricity in 2024 and had 887 GW of installed solar capacity in the country-level dataset.
• The United States generated 303.2 TWh of solar electricity in 2024 and had 177.5 GW of installed solar capacity.
• India generated 133.3 TWh of solar electricity in 2024 and had 90.8 GW of installed solar capacity.
• Germany generated 75.9 TWh of solar electricity in 2024 and had 89.9 GW of installed solar capacity.
• Australia had 1,437 watts of solar capacity per person in 2024, one of the highest per-capita figures in the dataset.
• IEA reported that global solar PV manufacturing capacity was expected to exceed 1,100 GW by the end of 2024, more than double projected demand.
• IEA also reported that module prices had more than halved since early 2023, showing how oversupply and manufacturing scale reshaped panel economics.
Editorial readout
The headline data points to six market forces: installation speed, panel cost decline, manufacturing concentration, regional policy, grid readiness, and technology improvement. A solar market review that tracks only cumulative capacity will miss the more important questions: where panels are being installed, whether they are connected to the grid, how much electricity they generate, and whether the supply chain can remain profitable while prices fall.
Why Solar Panels Now Carry Global Energy Stakes
Solar panel statistics matter more when electricity systems are adding clean capacity at record speed. Market-size figures do not tell a developer exactly which project to build, but they show why small changes in module prices, interconnection timelines, tariffs, or finance costs can reshape national power planning.
Market-scale and energy-transition benchmarks
• Solar PV capacity exceeded 2 TW globally by the end of 2024 after taking less than two years to move from the first TW to the second TW.
• Solar Power Europe reported 2.2 TW of cumulative installed solar PV capacity by the end of 2024.
• Global annual installations reached 597 GW in 2024 in Solar Power Europe data, compared with 449 GW in 2023.
• Solar Power Europe expected annual installations to reach 655 GW in 2025 in its outlook.
• The same outlook showed annual installations reaching 930 GW by 2029 in its forecast scenario.
• IEA expected global renewable power capacity to roughly double by 2030, with solar PV accounting for almost 80% of the increase.
• IRENA reported 92.5% of global power additions in 2024 came from renewables, largely because of solar and wind growth.
• IEA reported that renewables made up almost three-quarters of the increase in global power generation in 2024.
• Solar PV generation increased by about 480 TWh in 2024, more than any other electricity source in the IEA review.
• Ember reported that global solar generation grew faster than any major electricity source in 2024, adding roughly twice as much generation as the next largest source increase.
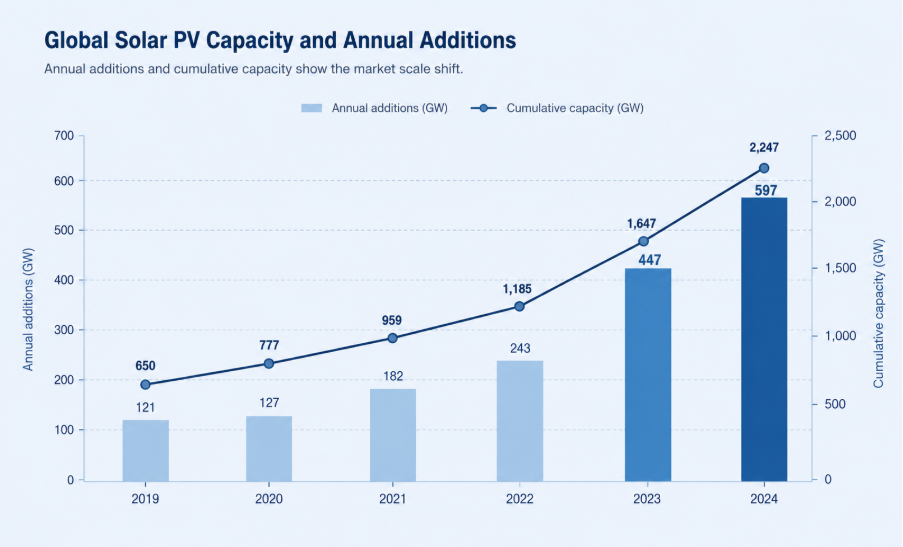
Figure 1. Global solar capacity and annual additions should be reviewed together because deployment growth affects module demand, grid queues, storage planning, and project finance.
Market context
The market context changes the business case. Solar panels are not only hardware products. They influence electricity prices, grid investment, battery demand, industrial policy, manufacturing jobs, land planning, and energy security. A small percentage change in solar project economics can redirect billions of dollars of investment when annual installations are close to 600 GW.
Global Solar Panel Installation Statistics
Installation statistics are useful only when they separate annual additions from cumulative capacity. Annual additions show current demand, cumulative capacity shows the installed base, and generation shows how much useful electricity that installed base actually produces.
Global capacity and installation benchmarks
• Global PV capacity reached 2,247 GW by the end of 2024 in the REN21 solar PV dataset.
• REN21 reported 602 GW of solar PV added globally in 2024.
• Solar Power Europe reported 597 GW of annual solar installations in 2024, a record level for the industry.
• The world installed 449 GW of solar capacity in 2023, showing that the 2024 market expanded sharply from an already high base.
• Utility-scale PV additions reached 382 GW in 2024, making large solar farms the largest installation category.
• Rooftop and distributed systems added 200 GW in 2024, showing that customer-sited solar remains a major part of the market.
• China was the largest solar market in 2024, with 887 GW of installed solar capacity in the country-level table.
• The United States ranked second in the country-level table with 177.5 GW of installed solar capacity.
• India reached 90.8 GW of installed solar capacity in 2024.
• Germany reached 89.9 GW of installed solar capacity in 2024.
• Brazil reached 53.1 GW of installed solar capacity in 2024, making it one of the largest solar markets outside Asia, North America, and Europe.
• Spain reached 38.6 GW of installed capacity and solar supplied 20.9% of its electricity generation in 2024.
• Australia reached 38.5 GW of installed solar capacity and had very high per-capita solar deployment.
• Japan generated 106.0 TWh of solar electricity in 2024, showing that mature markets can remain large generation contributors even when growth slows.
• Italy generated 35.8 TWh of solar electricity in 2024 and had 36.0 GW of installed capacity.
• The Netherlands supplied 20.5% of its electricity from solar in 2024, one of the highest solar shares among large European markets.
| Market signal | What to measure | Planning implication |
|---|---|---|
| Annual additions | Installation speed | Near-term panel demand and project activity |
| Cumulative capacity | Installed base | Market maturity and future O&M demand |
| Solar generation | Actual output | Panels in the power mix |
| Solar share | Power-mix penetration | Solar role in the grid |
| Capacity factor | Capacity utilization | Resource quality, curtailment, performance |
| Capacity per capita | Adoption intensity | Rooftop-heavy and high-penetration markets |
Planning readout
Installed capacity should not be read as the whole market story. A country can have high capacity but lower output because of weather, orientation, curtailment, or grid limits. A stronger solar scorecard compares capacity, generation, capacity factor, solar share, and annual growth together.
Solar Panel Market Size and Revenue Statistics
Solar market value can rise even when module prices fall, because revenue shifts from panels alone into inverters, EPC services, batteries, monitoring, grid equipment, installation labor, operations, maintenance, and lifecycle support. Falling module prices can reduce hardware revenue per watt while still increasing total deployment volume.
Market value and revenue benchmarks
• Global solar PV cumulative capacity reached 2.2 TW by end-2024 in Solar Power Europe data, creating a large installed base for service, monitoring, and replacement markets.
• Annual solar installations of 597 GW in 2024 created demand across modules, inverters, mounting systems, trackers, cables, transformers, construction, and grid connection equipment.
• Utility-scale additions of 382 GW in 2024 show why large project development remains a major revenue driver.
• Distributed PV additions of 200 GW in 2024 show that rooftop, commercial, and customer-sited systems still form a large equipment and installer market.
• Module prices more than halved since early 2023 in IEA reporting, reducing hardware revenue per watt but improving project affordability.
• Manufacturing capacity above 1,100 GW by end-2024 created intense competition among module suppliers.
• China’s share of global solar additions and manufacturing keeps global pricing closely tied to Chinese factory output and export conditions.
• IEA’s forecast that solar PV accounts for almost 80% of renewable capacity growth to 2030 supports a long-term expansion case for installation, grid, and storage services.
• Solar Power Europe’s 2029 annual installation outlook of 930 GW suggests that the market may continue scaling even if year-to-year growth rates cool.
• Country-level data show that solar growth is no longer limited to early adopters; large markets now include China, the United States, India, Germany, Brazil, Japan, Spain, Australia, Italy, and the Netherlands.
| Revenue signal | What to compare | Planning implication |
|---|---|---|
| Module manufacturing | Shipments and ASP | Demand and margin pressure |
| Utility-scale projects | Solar farms and PPAs | Grid-scale buildout |
| Residential rooftop | Household adoption, financing | Consumer demand, installers |
| Commercial and industrial solar | Savings and self-consumption | Corporate demand |
| EPC services | Engineering and construction | Execution capacity |
| O&M and monitoring | Installed-base operations | Recurring demand |
Revenue interpretation
Solar revenue does not move in a straight line with installed capacity. When panel prices fall, more projects become economical, but manufacturers may face tighter margins. A useful market-size analysis separates volume growth from price pressure and then tracks services, batteries, inverters, and grid equipment around the panel market.
Solar Panel Cost and Price Statistics
Cost data is one of the strongest parts of any solar panel market article because Solar’s rise has been powered by falling module prices, better manufacturing scale, higher efficiency, lower financing costs in some markets, and improved project execution. The key point is that the panel price is only one part of the installed-system cost.
Cost decline and project-economics benchmarks
• IEA reported that solar module prices had more than halved since early 2023, reflecting manufacturing scale and oversupply.
• IEA also reported that global solar manufacturing capacity was more than double projected demand by end-2024, a key reason for price pressure.
• Falling module prices improve project economics for developers, installers, and consumers, but they can compress manufacturer margins.
• Utility-scale solar benefits most directly from lower module costs because panels account for a large share of project equipment value.
• Residential rooftop costs do not fall as quickly as module prices because labor, permitting, customer acquisition, financing, and electrical work remain important.
• Commercial rooftop solar economics depend heavily on daytime self-consumption, electricity tariffs, roof quality, and financing terms.
• Inverter costs matter because inverters convert DC power to AC power and often have shorter replacement cycles than panels.
• Racking and tracker costs matter more for utility-scale projects because land layout, wind load, terrain, and yield optimization affect design.
• Grid connection costs are becoming more important as solar penetration rises and more projects wait for interconnection approval.
• Financing costs can decide project economics because solar requires upfront capital and then produces low-cost electricity for decades.
• Soft costs remain a major residential solar issue in markets with complex permitting, inspection, interconnection, and customer-acquisition processes.
• Battery prices increasingly affect rooftop and utility-scale solar because storage can raise self-consumption and reduce curtailment risk.
| Cost signal | What it includes | Why it matters |
|---|---|---|
| Modules | Panels and cells | Largest hardware signal |
| Inverters | Power conversion, compliance | Reliability, monitoring, and replacement cycles |
| Racking and trackers | Mounting and trackers | Yield, land use, and wind/snow design |
| Labor | Installation labor | Major soft-cost driver |
| Permitting | Approvals and inspection | Deployment speed and soft costs |
| Grid connection | Interconnection and upgrades | Utility-scale economics |
| Financing | Debt, leases, PPAs | Payback and project economics |
Cost interpretation
The solar panel market should not be judged by panel prices alone. A cheap module does not guarantee a cheap solar system if permitting is slow, grid connection is expensive, labor is scarce, or financing is costly. The best cost scorecard tracks module price, installed cost per watt, LCOE, payback period, and grid-connection cost together.
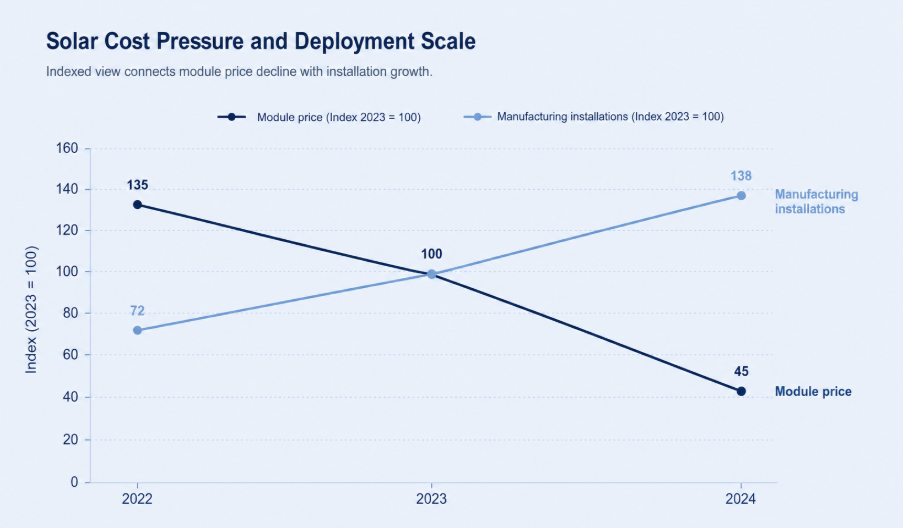
Figure 2. Solar cost indexes should be read with installed-cost and financing data because lower module prices do not always translate into lower project costs.
Solar Panel Manufacturing and Supply Chain Statistics
Manufacturing is now one of the most important solar panel market stories. The same production scale that lowered module prices has also created concentration risk, trade tension, oversupply, and margin pressure. Countries want affordable panels, but they also want more domestic manufacturing capacity.
Manufacturing and supply-chain benchmarks
• IEA expected global solar PV manufacturing capacity to reach over 1,100 GW by the end of 2024.
• IEA said that manufacturing capacity was more than double projected PV demand by end-2024.
• REN21 reported China accounted for 60% of global solar PV capacity additions in 2024.
• REN21 also reported China held 47% of total installed solar PV capacity by the end of 2024.
• China’s market scale means global panel pricing is closely linked to Chinese factory utilization, export levels, and domestic installation cycles.
• Factory overcapacity helped drive module prices lower but also increased pressure on weaker manufacturers.
• Polysilicon, wafers, cells, and modules are separate supply-chain stages, so domestic module assembly does not always mean a fully localized supply chain.
• Inverters, trackers, glass, back sheets, silver paste, and power electronics are also important parts of the solar supply chain.
• Domestic manufacturing incentives in the United States, India, and Europe are intended to reduce import dependence and create local jobs.
• India is expanding solar manufacturing capacity while also growing as one of the largest installation markets.
• Europe has strong demand but faces competition from lower-cost imported modules.
• Tariffs and trade rules can change project costs quickly because solar developers often purchase panels across borders.
• Manufacturing oversupply can help buyers but can also slow investment if producers cannot earn sustainable margins.
• Panel bankability remains important because developers and lenders need warranties from manufacturers likely to survive long project lifetimes.
| Supply-chain signal | What to watch | Planning implication |
|---|---|---|
| Polysilicon | Raw materials and prices | Cell/module cost |
| Wafers | Concentrated base | Supply security |
| Cells | PERC to n-type transition | Efficiency and cost |
| Modules | Oversupply and lower ASPs | Buyer economics, margins |
| Inverters | Power electronics, standards | Reliability, compliance |
| Batteries | Solar-plus-storage growth | Dispatchability, self-consumption |
Manufacturing readout
The solar panel market is both an energy story and an industrial policy story. Cheap global supply helps installations grow, but concentrated manufacturing creates strategic concerns. A mature scorecard should compare price, factory utilization, import dependency, domestic capacity, warranty strength, and technology transition.
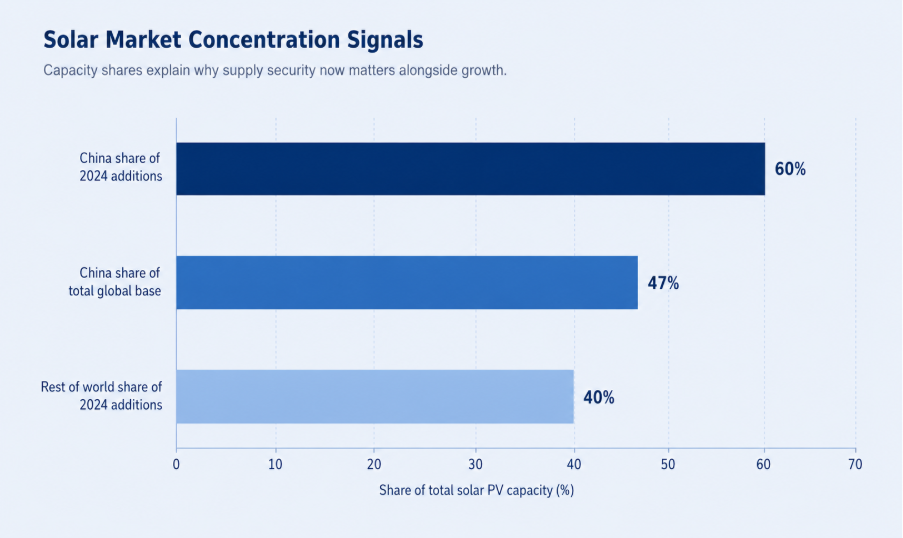
Figure 3. Solar manufacturing concentration should be reviewed beside installation growth because low-cost supply, domestic policy, and supplier bankability now affect the same market decision.
Solar Panel Technology, Efficiency, and Performance Statistics
Technology statistics explain why solar panels keep improving even when the basic product looks familiar. Higher efficiency can reduce land pressure, roof-space constraints, racking needs, and balance-of-system costs. At the same time, new technologies must prove bankability, degradation performance, warranty strength, and manufacturing scale before they become mainstream.
Efficiency and technology benchmarks
• Commercial monocrystalline modules commonly operate in the low-20% efficiency range, while premium modules can move higher depending on technology and format.
• Traditional commercial silicon solar panels are commonly around 21% efficiency, while crystalline silicon cells can reach around 27% in research and advanced manufacturing contexts.
• Perovskite-silicon tandem panel records have moved above 26% efficiency, while large commercial-sized tandem cell demonstrations have reached 28%+ efficiency.
• Single-axis tracking can add roughly 15-25% energy gain compared with fixed-tilt deployment in suitable utility-scale locations.
• Bifacial modules on trackers can add another 4-15% energy gain depending on module design, albedo, site layout, and climate conditions.
• PERC technology helped drive the previous wave of mainstream panel efficiency gains but is now giving way to newer n-type formats in many factories.
• Topcon has become one of the fastest-growing mainstream technologies because it can improve efficiency while using parts of existing manufacturing infrastructure.
• HJT modules compete in premium high-efficiency segments and can perform well in high-temperature conditions.
• Bifacial modules capture light from the rear side and are especially useful in utility-scale projects with reflective ground conditions.
• Single-axis trackers can increase energy yield in large solar farms by keeping panels aligned with the sun during the day.
• Tandem and perovskite technologies are watched closely because they may push future efficiency beyond conventional single-junction limits.
• Panel degradation rates matter because small annual losses accumulate across 25-30 year project lives.
• Long warranties are now a key buyer expectation, especially for utility-scale and financed rooftop systems.
• Efficiency improvements can reduce cost per delivered kWh even when the module price per watt is not the only deciding factor.
• Better module performance can lower land use, cable lengths, mounting requirements, and installation labor per unit of output.
• Technology change also creates inventory risk because older module formats may lose value when higher-efficiency products become widely available.
| Technology signal | Market role | Planning implication |
|---|---|---|
| Monocrystalline PERC | Mature mainstream | Low cost, widely available |
| Topcon | Fast-growing n-type | Higher efficiency, scalable |
| HJT | Premium efficiency | High performance, heat behavior |
| Bifacial panels | Utility-scale, high-yield | Rear-side light capture |
| Tandem/perovskite | Emerging technology | Future efficiency gains |
| Thin film | Specialist applications | Selected climate benefits |
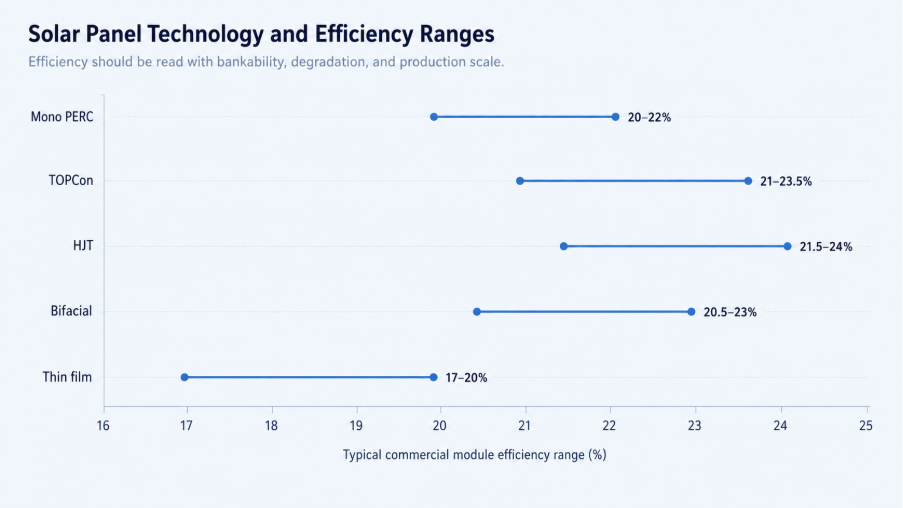
Figure 4. Solar panel technologies should be compared by efficiency, degradation, bankability, and production scale rather than by headline cell records alone.
Technology interpretation
Efficiency matters, but it is not the only technology metric. Buyers also need warranty confidence, degradation performance, supply availability, inverter compatibility, and lender acceptance. The winning technology is usually the one that combines better energy yield with a bankable supply chain.
Residential Solar Panel Market Statistics
Residential solar is the part of the market that connects panel statistics to household economics. Rooftop adoption depends on electricity prices, roof suitability, net metering, export tariffs, financing, installer availability, battery prices, and customer trust.
Residential solar adoption benchmarks
• Distributed and rooftop PV systems added 200 GW globally in 2024, according to REN21.
• Distributed PV grew 23% in 2024, showing continued demand outside large utility projects.
• Australia had 1,437 watts of installed solar capacity per person in 2024, reflecting very high household and distributed adoption.
• The Netherlands had 1,428 watts of installed solar capacity per person in 2024 and solar supplied 20.5% of electricity generation.
• Germany had 1,069 watts of installed solar capacity per person in 2024 and remains one of the strongest rooftop markets in Europe.
• Residential solar payback is strongest where retail electricity prices are high and export rules remain favorable.
• Net metering reforms can change rooftop economics quickly because exported electricity may be valued differently from self-consumed power.
• Battery attachment is becoming more important in residential solar because batteries increase self-consumption and backup value.
• Customer acquisition, permitting, inspection, and financing costs make residential systems more expensive per watt than utility-scale projects.
• Rooftop solar adoption often rises during periods of high grid electricity prices or power reliability concerns.
• Household system size tends to rise when customers add electric vehicles, heat pumps, or batteries.
• Residential solar markets need installer quality because poor installation can damage customer trust and system performance.
| Adoption driver | What it changes | Market impact |
|---|---|---|
| Electricity prices | Savings opportunity | Improves rooftop payback |
| Net metering | Export value | Household economics |
| Battery prices | Self-consumption, backup | Raises storage adoption |
| Financing | Monthly affordability | Expands access |
| Roof suitability | Area and orientation | Limits adoption |
| Installer availability | Speed and quality | Customer experience and market reputation |
Residential readout
Residential solar should not be judged only by the panel price. The customer sees a full package: system cost, roof work, financing, grid approval, battery options, savings estimate, warranty, and after-sales service. A rooftop market can slow even when modules are cheap if policy or financing changes weaken payback.
Commercial, Industrial, and Utility-Scale Solar Statistics
Commercial, industrial, and utility-scale solar projects convert panel economics into business decisions. Companies use solar to reduce electricity costs, hedge energy prices, meet sustainability targets, and secure long-term power contracts. Utilities and developers use solar to add low-cost generation, but they must manage interconnection, land, permitting, curtailment, and storage.
Business and utility-scale solar benchmarks
• Utility-scale PV additions reached 382 GW in 2024, making utility projects the largest installation category.
• Utility-scale PV grew 43% in 2024, faster than distributed PV growth in the REN21 dataset.
• Commercial rooftops are attractive when businesses consume electricity during daylight hours and can use much of the solar output onsite.
• Warehouses, factories, schools, hospitals, cold storage facilities, and retail centers are common C&I solar candidates because they often have large roofs and daytime electricity demand.
• Corporate power purchase agreements support utility-scale solar by giving developers long-term revenue certainty.
• Solar-plus-storage projects are becoming more important where midday solar output exceeds local demand or transmission capacity.
• Curtailment risk grows when a grid has more solar output than it can absorb during sunny periods.
• Interconnection queues can delay projects even when panels, land, and financing are available.
• Single-axis trackers are common in large ground-mounted projects because they improve generation profiles across the day.
• Utility-scale solar economics depend on module price, inverter price, land cost, grid connection, financing, PPA price, and curtailment exposure.
• C&I solar economics depend on self-consumption rate, tariff structure, roof quality, tax treatment, and credit quality of the buyer.
• Large solar projects increasingly need storage, grid upgrades, or flexible demand to protect project value in high-solar markets.
| Use case | Solar benefit | Main metric |
|---|---|---|
| Factory rooftop | Cuts daytime grid use | Self-consumption rate |
| Warehouse rooftop | Uses large roof area | Installed kW/site |
| Retail centers | Lowers operating cost | Annual bill reduction |
| Schools and hospitals | Budget stability | Lifetime savings |
| Data centers | Clean power procurement | PPA volume, matching |
| Utility solar farm | Low-cost bulk power | LCOE, PPA, curtailment |
Project interpretation
Utility-scale solar can deliver low-cost electricity, but the next bottleneck is often not the panel. It is grid access, land, permitting, storage, and financing. C&I solar is strongest when daytime demand matches solar output and when the buyer has a stable site, roof, and credit profile.
Regional Solar Panel Market Intelligence
Regional statistics are one of the highest-value parts of a solar panel market report. Global averages can hide large differences in sunlight, electricity prices, manufacturing policy, rooftop adoption, land availability, grid readiness, storage needs, and import dependence.
Asia-Pacific
Asia-Pacific is the center of both solar deployment and manufacturing. China dominates installation volume and factory capacity, India is scaling quickly, Japan remains a large mature market, and Australia shows how high rooftop penetration can change the electricity system.
• China generated 834.1 TWh of solar electricity in 2024 and had 887 GW of installed solar capacity.
• India generated 133.3 TWh of solar electricity in 2024 and had 90.8 GW of installed solar capacity.
• Japan generated 106.0 TWh of solar electricity in 2024 and had 88.2 GW of installed solar capacity.
• Australia generated 49.8 TWh of solar electricity in 2024 and had 38.5 GW of installed solar capacity.
• Australia’s capacity per capita reached 1,437 W/person, showing the strength of rooftop adoption.
Europe
Europe combines mature rooftop markets, energy-security policy, high retail electricity prices, and growing utility-scale deployment. Country differences are large, so a single European average is not enough.
• Germany generated 75.9 TWh of solar electricity in 2024 and had 89.9 GW of installed solar capacity.
• Spain generated 58.6 TWh of solar electricity and solar supplied 20.9% of its electricity generation in 2024.
• Italy generated 35.8 TWh of solar electricity and had 36.0 GW of installed capacity.
• The Netherlands generated 25.6 TWh of solar electricity and solar supplied 20.5% of electricity generation.
• Poland generated 15.6 TWh of solar electricity and showed rapid capacity growth in 2024.
North America
North America is led by the United States, where utility-scale solar, domestic manufacturing incentives, corporate procurement, and interconnection queues shape the market. Canada and Mexico add regional demand but at smaller scale.
• The United States generated 303.2 TWh of solar electricity in 2024 and had 177.5 GW of installed solar capacity.
• Solar supplied 6.8% of U.S. electricity generation in 2024 in the country-level dataset.
• Canada generated 7.4 TWh of solar electricity in 2024 and had 7.0 GW of installed solar capacity.
• Mexico generated 24.7 TWh of solar electricity in 2024 and had 10.5 GW of installed solar capacity.
Latin America
Latin America has strong solar resources and growing distributed generation. Brazil is the largest regional solar market, while Chile shows how high solar penetration can create curtailment and grid-integration challenges.
• Brazil generated 75.1 TWh of solar electricity in 2024 and had 53.1 GW of installed solar capacity.
• Solar supplied 10.5% of Brazil’s electricity generation in 2024.
• Chile generated 21.4 TWh of solar electricity in 2024 and solar supplied 22.9% of electricity generation.
• Chile had 14.0 GW of installed solar capacity in 2024, with high solar share relative to market size.
Middle East and Africa
The Middle East and Africa include two different solar stories: large utility-scale projects in high-resource markets and distributed/off-grid solar for energy access, reliability, and diesel replacement.
• South Africa generated 11.6 TWh of solar electricity in 2024 and had 9.0 GW of installed solar capacity.
• Saudi Arabia generated 4.8 TWh of solar electricity in 2024 and had 4.0 GW of installed solar capacity.
• The United Arab Emirates generated 10.0 TWh of solar electricity in 2024 and had 6.2 GW of installed solar capacity.
• African markets often require solar analysis to separate utility-scale projects from off-grid, mini-grid, and commercial reliability systems.
| Region | Solar market implication |
|---|---|
| Asia-Pacific | Manufacturing scale and fast installations shape supply and demand. |
| Europe | Rooftop demand, energy security, and policy drive growth. |
| North America | Utility-scale pipelines, incentives, and grid queues dominate. |
| Latin America | Strong resources and distributed generation make Brazil and Chile key. |
| Middle East & Africa | Mega projects and energy-access needs create two growth paths. |
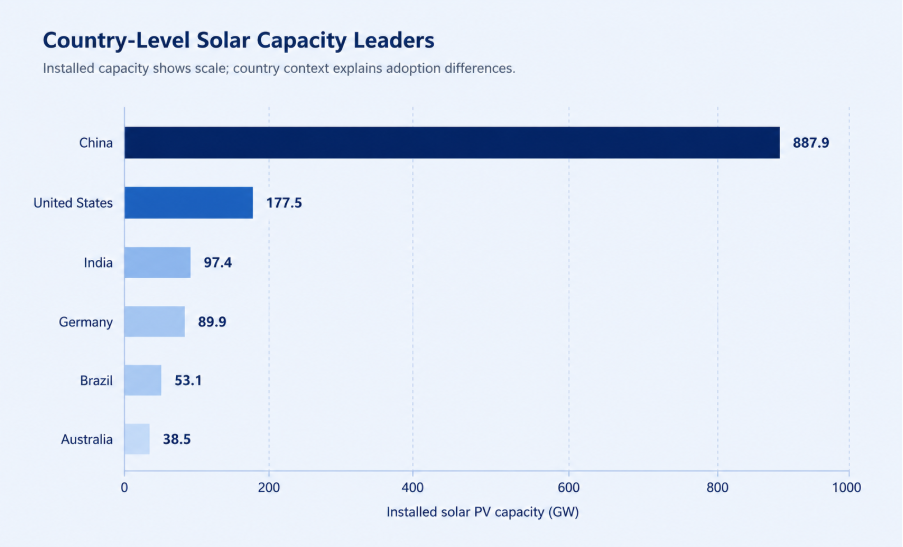
Figure 5. Regional solar capacity differences show why solar statistics should be read by country, policy setting, grid readiness, and electricity-price context.
Country-Level Solar Panel Statistics
Country-level statistics should compare installed capacity, solar generation, and solar share together. For a reference-style article, the scorecard should stay compact and focus on the countries that explain the market: China, the United States, India, Germany, Brazil, and Australia.
| Country | Installed capacity | Solar generation | Power-mix share | Market implication |
|---|---|---|---|---|
| China | 887.93 GW | 834.1 TWh | 8.3% | Deployment and supply leader |
| United States | 177.47 GW | 303.17 TWh | 6.9% | Utility-scale leader |
| India | 97.38 GW | 133.81 TWh | 6.5% | Fast-growth market |
| Germany | 89.94 GW | 70.99 TWh | 14.9% | Mature rooftop market |
| Brazil | 53.11 GW | 74.68 TWh | 10% | Latin America leader |
| Australia | 38.47 GW | 49.84 TWh | 17.8% | High rooftop adoption |
How to use country data
The country scorecard is most useful when it separates scale from penetration. China defines global deployment and manufacturing scale, the United States shows utility-scale demand, India shows fast-growth volume, Germany shows mature rooftop adoption, Brazil leads Latin American momentum, and Australia shows how high rooftop penetration changes a national market.
Solar Panel Investment, Jobs, and Lifecycle Statistics
Solar panels create investment beyond manufacturing. Every installation requires engineering, permitting, construction, electrical work, financing, grid connection, monitoring, maintenance, and eventually replacement or recycling. This is why market statistics should include capital flows, workforce signals, and lifecycle planning.
• Annual installations near 600 GW create a large market for EPC, financing, grid equipment, inverters, mounting systems, trackers, and monitoring software.
• REN21 reported that China accounted for 64% of global solar PV jobs in 2023, including 2.4 million in manufacturing.
• Domestic manufacturing incentives are intended to turn solar deployment into local industrial activity rather than only panel imports.
• Utility-scale solar projects depend heavily on project finance, PPAs, auctions, tax credits, and grid-connection certainty.
• Residential solar financing expands adoption by converting upfront system cost into monthly payments, leases, or power-purchase contracts.
• Commercial solar finance often depends on buyer credit quality, lease duration, roof condition, and expected electricity savings.
• Solar jobs include manufacturing, installation, engineering, project development, sales, inspection, grid integration, operations, maintenance, and recycling.
• Panel lifetimes are commonly discussed over 25-30 years, so early installation waves will create future repowering and recycling demand.
• Panel degradation affects lifetime electricity output and should be included in project modeling.
• Recycling becomes more important as installed capacity grows because glass, aluminum, silicon, copper, and small amounts of silver can re-enter supply chains.
• Repowering older solar farms can create a secondary market for replacing lower-efficiency panels with higher-output modules.
• Lifecycle planning matters because a large installed base creates future waste, warranty, insurance, and materials-recovery questions.
| Market signal | Market role | Growth signal |
|---|---|---|
| Project finance | Funds utility/C&I assets | PPAs, auctions, debt terms |
| Residential loans | Expands household access | Affordability and payback |
| Manufacturing jobs | Local industrial policy | Factory plans, utilization |
| Installation labor | Rooftop deployment speed | Installer availability |
| O&M services | Maintains installed base | Fleet size and monitoring |
| Recycling and repowering | Handles end-of-life panels | Waste and replacement cycles |
Lifecycle readout
Solar panels are long-life assets, so the market should be measured beyond the sale date. A strong lifecycle view connects manufacturing quality, installation standards, degradation, monitoring, maintenance, repowering, and recycling. This is especially important as the installed base moves beyond 2 TW.
Solar Panel Market Challenges and Risk Statistics
Solar growth is strong, but the market is not risk-free. As panels become cheaper, the bottleneck moves toward grid connection, policy stability, financing, land, storage, manufacturing margins, and lifecycle rules. These risks should sit beside the growth statistics because they decide how much installed capacity becomes useful electricity.
Grid, policy, and supply-chain risk benchmarks
• Manufacturing capacity above 1,100 GW by end-2024 created oversupply pressure and intense price competition.
• Module prices more than halved since early 2023, improving buyer economics but hurting some manufacturer margins.
• Grid interconnection delays can slow projects even when panels and finance are available.
• Curtailment risk grows as solar supplies larger shares of midday electricity generation.
• High solar shares in markets such as Spain, Chile, the Netherlands, and Australia show why storage and flexible demand become more important.
• Transmission constraints can prevent utility-scale projects from delivering power to load centers.
• Net metering reform can slow residential demand when export compensation becomes less favorable.
• Interest rates affect solar because the technology has high upfront cost and low operating cost.
• Land-use concerns can delay large projects, especially near agricultural, ecological, or community-sensitive areas.
• Tariffs and trade disputes can change module costs and supply availability for import-dependent markets.
• Manufacturer bankability is a risk when aggressive price competition weakens balance sheets.
• Recycling obligations are likely to become more important as old panels reach end of life.
| Risk signal | Core metric to measure | Why it matters |
|---|---|---|
| Grid congestion | Curtailment and queues | Limits usable output |
| Price pressure | Module ASP and margins | Supply-chain health |
| Policy changes | Incentives, tariffs, auctions | Changes demand quickly |
| Financing | Rates and PPA prices | Project economics |
| Land and permitting | Approvals and community response | Utility-scale speed |
| Lifecycle rules | Recycling cost, waste volume | Long-term sustainability |
Risk interpretation
The next solar market constraint is less about whether panels work and more about whether energy systems can absorb deployment speed. A balanced scorecard reviews panel cost, grid readiness, storage, permitting, finance, policy, and supply-chain profitability together.
Solar Panel Market Forecasts to 2030
Solar forecasts are useful when they explain both growth and constraints. Capacity is expected to keep expanding, but the quality of growth will depend on grid investment, storage deployment, domestic manufacturing, finance conditions, and technology upgrades.
Forecast benchmarks to watch
• Solar Power Europe expected global annual installations to reach 655 GW in 2025.
• Solar Power Europe’s outlook reached 930 GW of annual installations by 2029.
• IEA expected global renewable power capacity to double by 2030, adding about 4,600 GW.
• IEA said solar PV accounts for almost 80% of the renewable capacity increase to 2030.
• Solar Power Europe market commentary points to global solar capacity moving beyond 7 TW by 2030 in long-term outlook discussions.
• China is expected to remain a major installation and manufacturing force, even if annual growth rates fluctuate.
• India is expected to remain one of the most important growth markets because electricity demand and policy support are both strong.
• The United States outlook depends on utility-scale pipelines, domestic manufacturing, grid queues, tax credits, and residential policy changes.
• Europe’s outlook depends on rooftop demand, energy-security policy, permitting, grid capacity, and household economics.
• Emerging markets can grow quickly where solar replaces expensive diesel or imported fuel, but finance and grid capacity remain barriers.
• Solar-plus-storage attachment is expected to rise as more markets experience midday solar surplus and evening peak demand.
• Recycling, repowering, and end-of-life services will become more visible as early solar installation waves age.
| Market area | Expected direction | Planning implication |
|---|---|---|
| Global capacity | Strong growth to 2030 | Leading new power source |
| Module prices | Low, but volatile | Supports demand, pressures margins |
| Manufacturing | More regionalization | Policy supports local factories |
| Utility solar | Larger projects, storage | Grid flexibility needed |
| Rooftop solar | Tariffs and batteries | Economics vary by market |
| Lifecycle market | More repowering, recycling | Future service demand |
Outlook readout
By 2030, the solar panel market will likely be judged less by whether installations grow and more by how well countries manage integration. The key questions will be grid readiness, battery pairing, domestic supply-chain resilience, cost of capital, and lifecycle management.
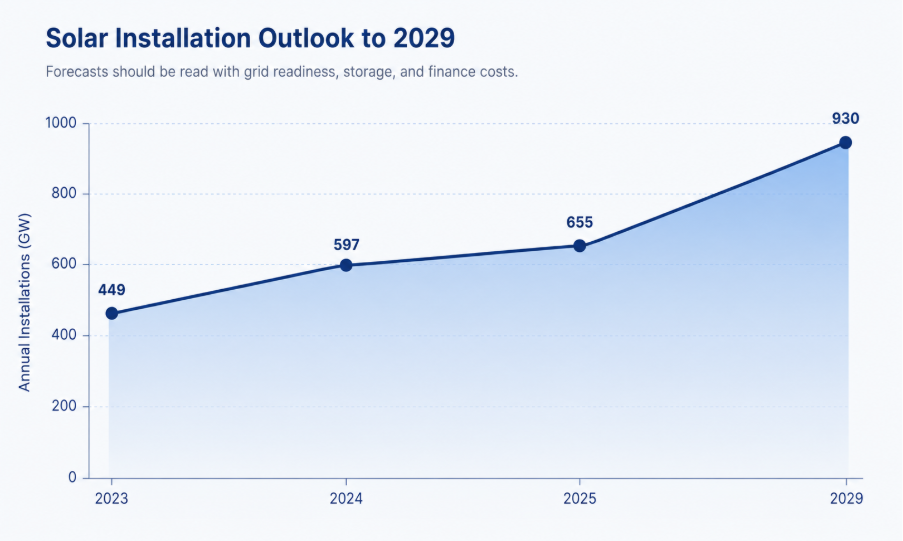
Figure 6. The 2030 solar capacity outlook should be read together with grid, storage, financing, manufacturing, and lifecycle signals.
Solar Panel Market Diagnostic
A useful solar panel benchmark helps a team decide where to look next. The diagnostic model below connects statistics to action, so the article works as a market scorecard rather than a long list of figures.
| Problem area | Core signals to measure | Useful benchmark | Likely owner |
|---|---|---|---|
| Market demand | Additions, pipeline, shipments | Installation growth, pipeline | Developers, manufacturers, investors |
| Cost pressure | Module price, system cost, LCOE | Cost per watt, LCOE, payback | Developers, installers, finance |
| Manufacturing risk | Capacity, utilization, import share | Utilization and concentration | Manufacturers, buyers, policy |
| Grid readiness | Queues, curtailment, transmission | Queue time, curtailment, limits | Utilities, developers, regulators |
| Residential adoption | Payback, net metering, batteries | Rooftop growth, payback | Installers, finance, policy |
| Utility-scale growth | PPA prices, auctions, storage | PPA prices, auctions, storage | Developers, off takers, grid |
| Sustainability | Lifespan, recycling, waste | Recycling readiness | Asset owners, recyclers, regulators |
90-Day Solar Panel Market Benchmark Plan
Statistics become useful when they are translated into a measurement plan. A practical solar market review can run as a 90-day cycle rather than a vague monitoring project.
| Timing | What to do | Output |
|---|---|---|
| Days 1-30 | Build baseline by country, capacity, additions, generation, share, and value. | Map of growth concentration. |
| Days 31-60 | Compare costs, policy, manufacturing, grid limits, and rooftop economics. | View of demand drivers and barriers. |
| Days 61-90 | Review forecasts, storage, curtailment, recycling, investment, and bankability. | Repeatable market scorecard. |
Planning principle
The best solar market teams do not chase every benchmark. They compare external statistics against real market questions: where demand is growing, where costs are falling, where grids are constrained, where manufacturing is concentrated, and where policy can change adoption speed.
Metrics Solar Market Leaders Should Track
The final scorecard should be detailed enough to locate the market signal without becoming a vanity dashboard. These metrics connect growth, cost, generation, manufacturing, financing, grid readiness, lifecycle planning, and investment quality.
| Metric | Why it matters |
|---|---|
| Annual solar PV additions | Current market speed and near-term panel demand. |
| Cumulative installed capacity | Market maturity and installed-base service opportunity. |
| Solar generation | Actual electricity contribution from installed panels. |
| Solar share of electricity | How central solar is to the power mix. |
| Capacity factor | Resource quality, system performance, and curtailment influence. |
| Module average selling price | Pricing pressure and buyer affordability. |
| System cost per watt | Real project economics beyond panel cost. |
| LCOE | Compares power sources. |
| Interconnection queue volume | Grid bottlenecks and project delay risk. |
| Curtailment rate | Lost solar output and storage need. |
| Battery attachment rate | Flexibility and self-consumption potential. |
| Manufacturing capacity | Supply security and overcapacity risk. |
| Recycling capacity | Lifecycle readiness as panels age. |
Solar Panel Market Statistics FAQ
Common questions
• How big is the global solar panel market?
The market is above 2 TW; REN21 reported 2,247 GW by end-2024.
• How much solar capacity was installed in 2024?
Solar Power Europe reported 597 GW, while REN21 reported 602 GW.
• Which country leads the solar panel market?
China leads, with around 60% of 2024 additions and 887 GW installed.
• Which countries are important after China?
The United States, India, Germany, Brazil, Japan, Spain, Australia, Italy, and the Netherlands stand out.
• Are solar panel prices falling?
Yes. IEA reported module prices more than halved since early 2023.
• What is the difference between solar capacity and solar generation?
Capacity is installed equipment; generation is electricity actually produced.
• Why is manufacturing concentration important?
It affects price, supply security, trade policy, and domestic manufacturing plans.
• What are the biggest risks for the solar panel market?
Grid congestion, interconnection delays, curtailment, policy changes, financing costs, tariffs, and recycling obligations.
• What will drive solar panel growth by 2030?
Lower costs, policy support, project pipelines, rooftop adoption, batteries, grid upgrades, and emerging demand.
Final Takeaway
Solar panel market performance depends on five systems working together: installation growth, cost competitiveness, manufacturing scale, grid readiness, and policy support. The statistics show that growth can come from many places, but long-term market quality depends on whether countries can install, connect, finance, store, manufacture, and manage solar capacity at scale.
The most useful solar analysis finds the actual market signal. If panels are cheap but projects are delayed, the issue may be interconnection or permitting. If rooftop demand slows, the issue may be tariffs, financing, or net metering. If capacity rises but generation does not, the issue may be curtailment, resource quality, or grid constraints.
For energy leaders, investors, manufacturers, installers, and policy teams, the practical goal is a solar panel market that is affordable, reliable, regionally diversified, grid-ready, storage-aware, and prepared for recycling. The next phase of solar growth will be measured not only by how many panels are installed, but by how well the market converts that capacity into useful power.