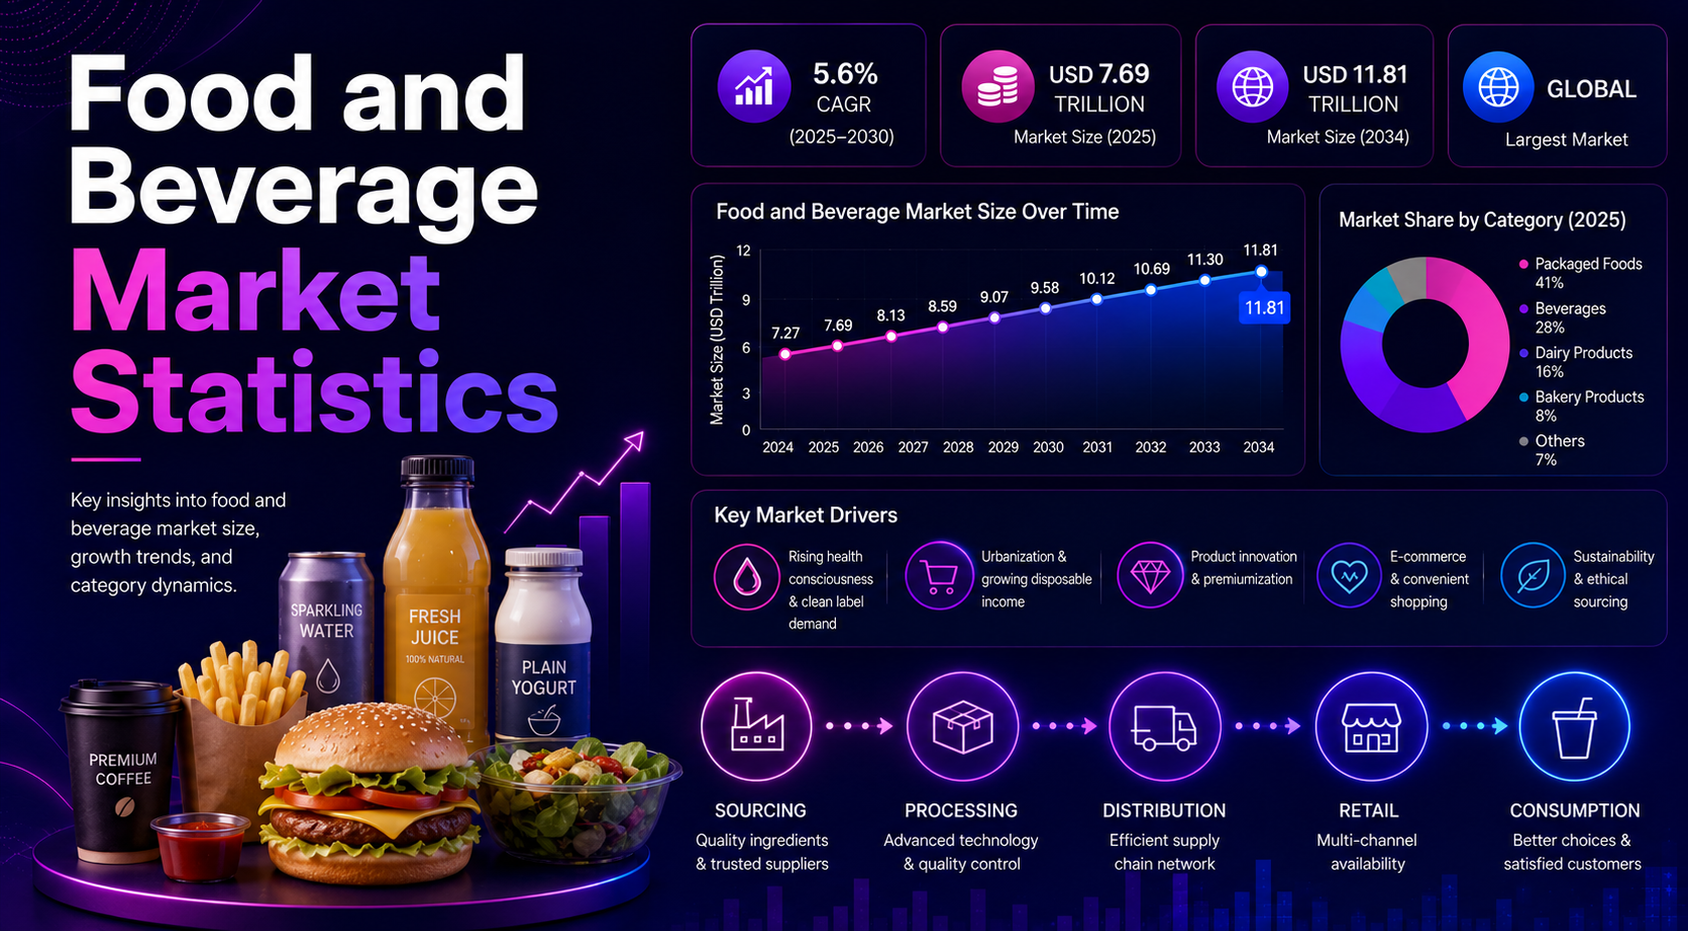
Food and beverage is one of the broadest consumer markets because it combines daily household staples, packaged products, fresh food, restaurant spending, beverages, ingredients, grocery retail, imports, ecommerce, and foodservice. The market is not driven by one single metric. It is shaped by population, income, food prices, retail structure, urbanization, convenience, product innovation, health preferences, supply-chain capacity, and local diets.
The strongest statistics show why the market deserves its own scorecard. One benchmark places the global food and beverage market at 9.79 USD trillion in 2026 and projects it at 11.78 USD trillion by 2031. Another food-and-beverages estimate places the market at 8.71 USD trillion in 2025 and projects 14.72 USD trillion by 2034. Worldwide food revenue is tracked near 9.67 USD trillion in 2026, while packaged food alone is measured at 3.3 USD trillion in one 2024 forecast series.
Executive Food and Beverage Benchmarks
These statistics frame the market. They show the scale of food and beverage demand, the importance of packaged food and beverages, the role of regional consumption, the size of dairy and processed meat categories, and the channel shifts that are changing how products reach consumers.
The numbers that define the food and beverage market
• The global food and beverage market is estimated at 9.79 USD trillion in 2026 and is projected to reach 11.78 USD trillion by 2031.
• The same forecast implies a 3.75% CAGR for the global food and beverage market between 2026 and 2031.
• A separate food-and-beverages forecast estimates the market at 8.71 USD trillion in 2025 and projects 14.72 USD trillion by 2034.
• Worldwide food market revenue is estimated at 9.67 USD trillion in 2026, with a 6.24% CAGR through 2031 in the tracked food-market series.
• Global packaged food market size is estimated at 3.3 USD trillion in 2024 in one forecast series, with projected growth to about 5.97 USD trillion by 2034.
• Another packaged-food forecast estimates global packaged food at 2.69 USD trillion in 2025 and projects 3.93 USD trillion by 2034.
• Asia-Pacific represents 33.67% of the global packaged food market in the packaged-food benchmark.
• The global dairy foods market is estimated at 1,063.47 USD billion in 2026 and projected to approach 1,995.47 USD billion by 2034.
• Asia-Pacific represents 41.09% of the dairy foods market in the dairy benchmark, equal to roughly 413.3 USD billion in implied 2025 value.
• The global processed meat market is estimated at 750.58 USD billion in 2026 and projected to reach 1,253.77 USD billion by 2034.
• North America holds an implied 41.34% share of the processed meat market in the market benchmark, based on 292.6 USD billion in 2025 value.
• The global ready-to-drink beverages market is estimated at 847.69 USD billion in 2026 and projected at 1,413.1 USD billion by 2034.
• Global milk production reached 950 million tones in 2024, while global meat production reached 365 million tones.
• China’s total retail sales of consumer goods reached 6.8 USD trillion in 2024, making it the largest country-level retail anchor in the benchmark set.
• India’s food retail industry revenue is listed at 869 USD billion in 2025 with 7% annual growth.
• The European Union food and drink industry records 1.2 EUR trillion in turnover, 250 EUR billion in value added, and 4.7 million people employed.
• Canada’s staple food ecommerce sales rose from 42.6 CAD million in 2018 to 1.2 CAD billion in 2023, based on the channel benchmark.
• Non-alcoholic beer grew 9% in volume in 2024, while total global alcohol consumption was down 1% year over year in the IWSR-based beverage trend data.
Editorial readout
The headline data points to several different growth engines: total food spending, packaged food expansion, beverage innovation, dairy and protein demand, modern grocery, ecommerce, foodservice, and regional consumption growth. A food and beverage company that watches only one global market number will miss the real operating story. The more useful approach is to split performance by category, price tier, channel, country, and consumer use case.
Why Food and Beverage Is a Multi-Trillion-Dollar Consumer Market
Food and beverage has unusually broad economic reach because every household participates in the market, but not every household participates in the same way. Some spending goes into staples and fresh food. Some moves through packaged goods, beverages, foodservice, delivery, warehouse clubs, online grocery, and imported products. That is why market size should be read across several layers instead of being treated as one blended demand pool.
Market-size statistics become more important when small percentage changes are applied to a market measured in trillions of dollars. A one-point shift toward private label, ecommerce grocery, functional beverages, or ready meals can affect billions in sales. A small change in food inflation can also move total market value without necessarily showing higher consumption volume.
Market-size and growth benchmarks
• The 2026 food and beverage market value of 9.79 USD trillion creates a large base where even modest growth creates significant annual dollar gains.
• The 2031 projection of 11.78 USD trillion implies roughly 1.99 USD trillion in additional market value between 2026 and 2031.
• The average annual absolute gain in the 2026–2031 food and beverage forecast is about 0.4 USD trillion per year.
• The food-and-beverages series that runs from 2025 to 2034 adds 6.01 USD trillion in absolute value over the period.
• That longer forecast implies 69% cumulative growth between 2025 and 2034.
• The worldwide food-market series adds 3.42 USD trillion between 2026 and 2031.
• That food-market forecast implies 35.3% growth over the 2026–2031 period.
• Packaged food is large enough to be treated as its own strategic market, with one benchmark placing it at 3.3 USD trillion in 2024.
• Dairy foods are tracked above 1,063 USD billion in 2026, showing that staple categories can be both mature and growth-relevant.
• Ready-to-drink beverages are tracked at 847.69 USD billion in 2026, showing how convenience-led beverage formats are already large in value terms.
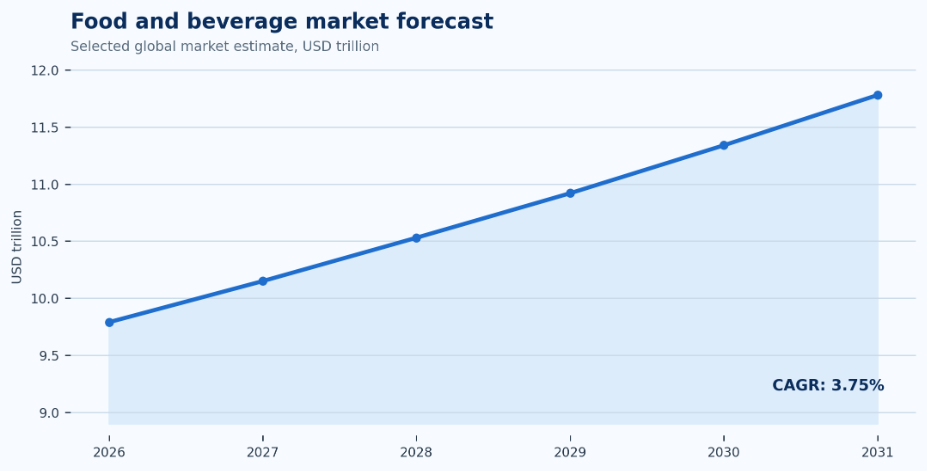
Figure 1. Global food and beverage market scale should be reviewed through annual forecast movement because small percentage changes become significant when the market is measured in trillions of dollars.
Global Food and Beverage Market Size and Forecast
The global forecast section should separate value growth from volume growth. Food and beverage revenue can rise because shoppers buy more units, because populations grow, because categories preimmunize, because online and foodservice channels expand, or because prices increase. A useful market forecast therefore explains not only how large the market is, but also what type of growth the number may represent.
• The Mordor-based benchmark places global food and beverage value at 9.44 USD trillion in 2025.
• The same series lifts the market to 9.79 USD trillion in 2026.
• The 2027 forecast rises to 10.16 USD trillion.
• The 2028 forecast rises to 10.54 USD trillion.
• The 2029 forecast reaches 10.93 USD trillion.
• The 2030 forecast reaches 11.34 USD trillion.
• The 2031 forecast reaches about 11.77 USD trillion in the calculated chart path and about 11.78 USD trillion in the published projection.
• The 2026–2031 CAGR is 3.75%, which is moderate compared with higher-growth category forecasts such as dairy foods or packaged food in some data series.
• The food-and-beverages market series shows a higher 6% CAGR through 2034, creating a wider long-term growth view.
• The worldwide food-market series shows a 6.24% CAGR through 2031, suggesting the food-only view can move differently from combined food-and-beverage estimates.
Market interpretation
The data should not be read as one single market truth because different benchmarks define the market differently. Some include broader foodservice and retail categories, while others focus on packaged products or manufacturing value. The useful point is direction: food and beverage remains a multi-trillion-dollar market where even low single-digit growth can create large absolute revenue gains.
Packaged Food Market Statistics
Packaged food is one of the clearest windows into modern food demand because it combines convenience, shelf life, branding, retail distribution, private label, portion control, and product innovation. It includes ready meals, snacks, frozen food, bakery products, packaged staples, sauces, condiments, dairy products, confectionery, and many health-oriented formats.
Packaged food benchmarks worth separating
• One packaged-food forecast places the global market at 3.3 USD trillion in 2024.
• The same series projects packaged food at 5.97 USD trillion by 2034.
• That forecast implies 6.1% CAGR through 2034.
• A second packaged-food forecast estimates the market at 2.69 USD trillion in 2025.
• The second series projects packaged food at 3.93 USD trillion by 2034.
• That second series implies 4.3% CAGR through 2034.
• The higher-growth packaged-food series implies 2.67 USD trillion in absolute growth between 2024 and 2034.
• The same series implies 80.8% cumulative growth across the period.
• Asia-Pacific represents 33.67% of the packaged food market in the regional-share benchmark.
• The implied Asia-Pacific packaged-food value is 0.906 USD trillion when the 33.67% share is applied to a 2.69 USD trillion base.
| Packaged food segment | Demand signal | Strategic implication |
|---|---|---|
| Ready meals | Urban lifestyles, time-saving meals, smaller households | Growth comes from convenience, portioning, and meal-solution positioning. |
| Snacks | Frequent small purchases and impulse retail | Distribution, flavor innovation, and value packs matter. |
| Frozen food | Shelf stability, value, and reduced waste | Useful where households manage budgets and meal planning. |
| Bakery and staples | Daily use and high household penetration | Volume base remains strong even when premium growth slows. |
| Health-positioned packaged food | Protein, low sugar, clean label, and functional claims | Brand trust and credible claims drive premium demand. |
Category readout:
Packaged food growth is strongest when convenience, affordability, shelf stability, and product trust meet. The market should be measured by repeat purchase, retail shelf velocity, price tier, private-label share, and channel mix, not only by total sales value.
Beverage Market Statistics
Beverages operate differently from food staples because they are strongly affected by lifestyle, refreshment occasions, functionality, premiumization, alcohol moderation, convenience, and impulse consumption. The beverage market includes soft drinks, bottled water, coffee, tea, energy drinks, juices, alcoholic drinks, ready-to-drink beverages, and low/no-alcohol products.
• Worldwide beverages market revenue is tracked at 217.99 USD billion in 2026 in the beverage forecast series.
• The same beverages series projects 283.4 USD billion by 2030.
• The 2026–2030 beverage CAGR is listed at 6.78%.
• The forecast shows beverages moving from 217.99 USD billion in 2026 to 232.77 USD billion in 2027.
• The beverages market reaches 248.55 USD billion in 2028 and 265.4 USD billion in 2029 in the same series.
• Global ready-to-drink beverages are significantly larger in the separate RTD benchmark, with 847.69 USD billion in 2026 value.
• RTD beverages are projected at 1,413.1 USD billion by 2034.
• The RTD beverages forecast implies 6.6% CAGR through 2034.
• RTD beverages add an estimated 565.41 USD billion between 2026 and 2034.
• Non-alcoholic beer volume grew 9% in 2024.
• Non-alcoholic beer represents 2% of global beer volume in the beverage trend data.
• Global non-alcoholic beer market value is listed at 13.7 USD billion, with a projection of 23 USD billion.
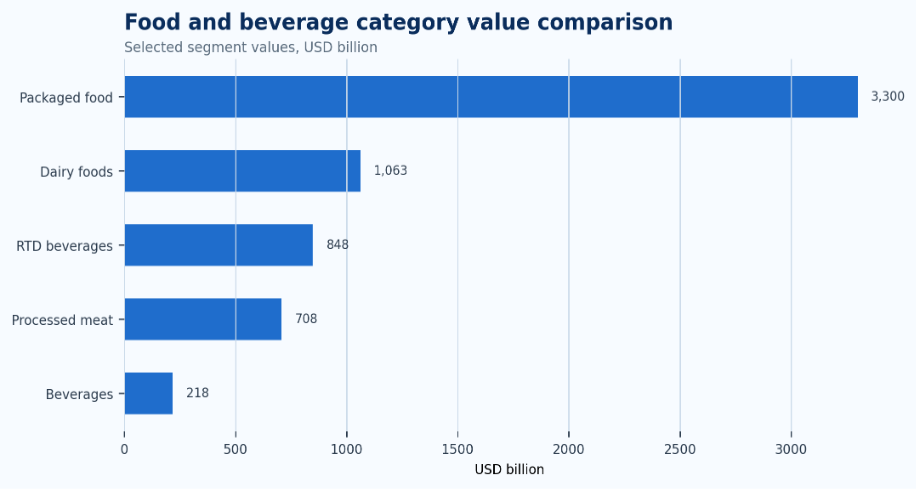
Figure 2. Food and beverage category values should be compared by segment because packaged food, dairy, processed meat, ready-to-drink beverages, and beverages respond to different consumer needs.
Beverage interpretation:
The beverage market should be read through occasions. Hydration, energy, health support, alcohol moderation, convenience, and premium social consumption create different growth profiles. A single beverage CAGR can hide the contrast between mature soft drinks, fast-moving functional formats, RTD convenience, and low/no-alcohol growth.
Dairy, Meat, and Protein Market Statistics
Dairy, meat, poultry, seafood, and processed protein categories are central to food and beverage market analysis because they link consumer demand with agricultural production, cold-chain capacity, feed costs, trade, food inflation, and local diets. These categories also show why supply statistics and market-size statistics need to sit together.
• The global dairy foods market is estimated at 1,005.84 USD billion in 2025.
• Dairy foods rise to 1,063.47 USD billion in 2026 and are projected at 1,995.47 USD billion by 2034.
• The dairy foods forecast shows an 8.18% CAGR through 2034.
• Dairy foods add about 932 USD billion in absolute value between 2026 and 2034.
• The dairy foods forecast implies 87.6% growth across the 2026–2034 period.
• Asia-Pacific holds 41.09% of the dairy foods market in the market benchmark.
• World milk production reached 950 million tones in 2024.
• India produced 227 million tones of milk in 2024 and accounted for an estimated 23.89% share of world milk production.
• Pakistan produced 66 million tones of milk in 2024 and accounted for an estimated 6.95% share of world milk production.
• Global meat production reached 365 million tones in 2024.
• The global processed meat market is estimated at 707.76 USD billion in 2025 and 750.58 USD billion in 2026.
• Processed meat is projected at 1,253.77 USD billion by 2034.
• Processed meat shows a 6.62% CAGR through 2034.
• North America processed meat value is listed at 292.6 USD billion in 2025, implying 41.34% share of the processed-meat benchmark.
| Protein category | Key statistic | Business meaning |
|---|---|---|
| Dairy foods | 1,063.47 USD million in 2026 | Large staple market with premium, protein, yogurt, and value-pack opportunities. |
| Milk production | 950 million tones globally in 2024 | Supply-side scale remains crucial for price and trade stability. |
| India milk | 227 million tones in 2024 | India is a major production anchor and demand growth market. |
| Meat production | 365 million tones globally in 2024 | Protein demand depends on income, diet, feed cost, and trade conditions. |
| Processed meat | 750.58 USD billion in 2026 | Convenience and foodservice keep the category large, but health and sustainability scrutiny matter. |
Protein interpretation:
Protein markets are not only consumer categories. They are production systems. Brands and retailers should track market value, production volume, trade exposure, cold-chain capacity, feed cost, and health perception together because all of those signals affect category growth and margin quality.
Grocery Retail and Foodservice Statistics
Food and beverage demand reaches the consumer through several routes. Grocery retail captures household consumption, foodservice captures away-from-home spending, and newer digital models blend grocery, delivery, subscriptions, warehouse clubs, and quick commerce. Channel statistics show where demand is captured and who controls the consumer relationship.
Retail and foodservice benchmarks
• China’s total retail sales of consumer goods are captured at 6.8 USD trillion in 2024, with 3.5% annual growth.
• India’s food retail industry revenue is listed at 869 USD billion in 2025, with 7% annual growth.
• Japan’s retail food and beverage sales were 193 USD billion in 2024 after 198 USD billion in 2023.
• South Africa’s retail food sales are listed at 50 USD billion in 2024.
• Singapore’s retail food and beverage sales are listed at 12 USD billion in 2024.
• Indonesia’s grocery retail sector sales are listed at 101 USD billion in 2024.
• Vietnam’s food retail sales are listed at 55.5 USD billion in 2024, with 1% annual growth.
• Colombia’s foodservice sales are listed at 17 USD billion in 2024, with 6% growth.
• Colombia’s expected foodservice industry growth for 2025 is listed at 1%.
• The Philippines warehouse club sales forecast is 1.3 USD billion in 2025, with food and beverage representing about 66.7% of sales.
• Canada’s top five grocery companies account for 65% of the retail grocery market in the Canada retail benchmark.
• EU food and drink industry turnover is listed at 1.2 EUR trillion, with 250 EUR billion in value added.
| Channel | Core signal to measure | Why it matters |
|---|---|---|
| Supermarkets | Basket size, private-label share, fresh food traffic | They remain the main household grocery channel in many mature markets. |
| Discounters | Store visits, value-tier share, promotion dependence | They show where affordability pressure is moving demand. |
| Convenience stores | Impulse purchases, beverage trips, ready-to-eat sales | They capture immediate consumption and small baskets. |
| Foodservice | Visits, average ticket, delivery share, menu inflation | It shows away-from-home demand and hospitality recovery. |
| Warehouse clubs | Bulk purchases, membership sales, food share | They show value buying, pantry loading, and club retail growth. |
| Online grocery | Orders, retention, substitution, delivery cost | It changes fulfillment economics and customer data ownership. |
Channel readout:
Grocery retail and foodservice should be tracked separately because they respond to different consumer pressures. Food inflation may push some households toward at-home meals and private label, while convenience, delivery, tourism, and income growth can support restaurants and foodservice.
Online Grocery and Digital Food Commerce
Digital food commerce is smaller than store-based grocery in many countries, but it can grow quickly from a low base. Online grocery changes the economics of food retail because it adds picking, packing, delivery, substitutions, cold-chain handling, app retention, and data-driven loyalty to the traditional grocery model.
• Canada’s store-based staple food distribution represented 95.5% of staple food distribution in 2023.
• Canada’s non-store ecommerce staple food distribution represented 4.5% in 2023.
• Canadian supermarkets represented 46.5% of staple food distribution in 2023.
• Canadian hypermarkets represented 20.9% of staple food distribution in 2023.
• Canadian small local grocers represented 9.9% of staple food distribution in 2023.
• Canadian discounters represented 7.9% of staple food distribution in 2023.
• Canada’s staple food ecommerce sales rose from 42.6 CAD million in 2018 to 1.2 CAD billion in 2023.
• The Canadian staple food ecommerce CAGR for 2018–2023 is listed at 94.2%.
• Indonesia’s traditional retailers hold 73% share of the grocery retail market.
• Indonesia’s non-traditional grocery share is therefore implied at 27%, equal to 27.27 USD billion in the calculated benchmark.
• The Dominican Republic supermarket channel is estimated at 20% to 25% of retail sales, leaving 75% to 80% outside supermarkets.
• The Philippines warehouse club food and beverage sales are implied at 0.87 USD billion from the two-thirds food and beverage share.
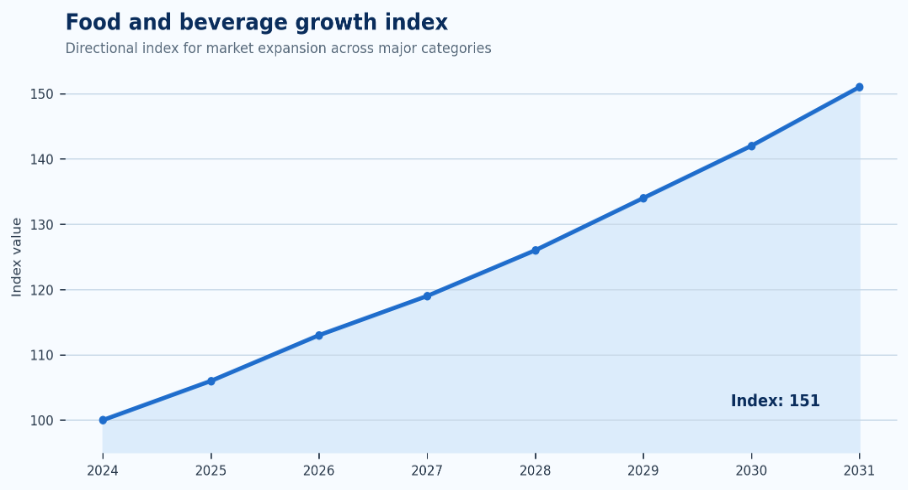
Figure 3. Canada staple food ecommerce growth shows how digital food commerce can expand rapidly from a small base even when store-based distribution remains dominant.
Digital commerce interpretation
Online grocery is not simply another sales channel. It changes the cost to serve, the data available to retailers, the way shoppers handle substitutions, the importance of delivery windows, and the loyalty loop between retailer apps and household routines.
Consumer Trends Shaping Food and Beverage Demand
Consumer trends give meaning to the market-size numbers. Food and beverage demand is shaped by what people want to eat, how much time they have, what they can afford, whether they trust ingredients, and whether they are buying for daily nourishment, convenience, wellness, indulgence, social occasions, or household budgeting.
Consumer behavior signals worth separating
• Health and wellness trends support demand for protein products, fortified foods, functional beverages, probiotics, low-sugar products, and clean-label positioning.
• Convenience trends support ready meals, RTD beverages, frozen food, snacks, delivery, meal solutions, and foodservice formats.
• Affordability pressure supports discount retail, private label, larger value packs, fewer restaurant visits, and more price comparison across channels.
• Premiumization remains important in categories where consumers trade up for taste, origin, brand trust, gifting, sustainability, or functional benefits.
• Sustainability trends affect packaging, sourcing, food waste, carbon claims, water use, and ingredient traceability.
• Digital shopping trends affect grocery loyalty, retail media, delivery economics, substitution behavior, and first-party consumer data.
• Alcohol moderation is visible in the beverage trend data, where global alcohol consumption is down 1% year over year and non-alcoholic beer volume is up 9%.
• Legal drinking population is projected to grow 9% versus the 2025 baseline by 2035, even as global alcohol consumption is forecast at 1% below the 2025 baseline.
• India is projected to rank 2nd in the alcohol market by 2032 in the IWSR trend data.
• Lager still represents 92% of global beer volume, showing that category leadership can remain concentrated even while low/no-alcohol grows.
| Consumer trend | What it changes | Likely market impact |
|---|---|---|
| Health and wellness | Ingredients, claims, packaging, and product reformulation | Better-for-you food and functional beverages gain shelf space. |
| Convenience | Meal formats, portion sizes, delivery, and ready-to-eat options | Ready meals, snacks, RTD beverages, and foodservice benefit. |
| Affordability | Store choice, pack size, promotions, and private label | Retailers gain power and value tiers become more important. |
| Premiumization | Brand position, origin claims, taste, and packaging | Higher-margin products can grow even in mature markets. |
| Sustainability | Packaging, sourcing, food waste, and traceability | Compliance and consumer trust become linked to operations. |
| Digital shopping | Loyalty data, order frequency, fulfillment, and substitution | Online grocery and retail media become strategic assets. |
Consumer readout:
Food and beverage companies should avoid treating consumer trends as slogans. A trend becomes useful only when it can be measured through repeat purchase, price tolerance, channel behavior, category switching, product claims, and basket-level data.
Regional Food and Beverage Intelligence
Regional data is one of the highest-value parts of a food and beverage statistics analysis. Global averages can hide large differences in population, income, retail format, traditional grocery share, import dependence, diet, foodservice culture, ecommerce readiness, and regulation. A strong market analysis should therefore move from global scale to regional and country-level detail.
North America
• Canada’s top five grocery companies account for 65% of the retail grocery market, showing a concentrated modern retail structure.
• Store-based staple food distribution in Canada represented 95.5% of the category in 2023, while non-store ecommerce represented 4.5%.
• Canadian supermarkets accounted for 46.5% of staple food distribution, while hypermarkets accounted for 20.9%.
• Canada’s staple food ecommerce sales reached 1.2 CAD billion in 2023 after only 42.6 CAD million in 2018.
• North America’s processed meat market value is listed at 292.6 USD billion in 2025, implying 41.34% share of the global processed meat benchmark.
• U.S. non-alcoholic beer volume increased 175% since 2019 in the beverage trend data.
Europe
• The European Union food and drink industry records 1.2 EUR trillion in turnover.
• EU food and drink industry value added is listed at 250 EUR billion.
• EU food and drink industry employment is listed at 4.7 million people.
• EU value-added-to-turnover ratio is calculated at 20.8%.
• EU turnover per employee is calculated at 255.3 EUR thousand per employee.
• France’s food processing sector records 176.7 USD billion in annual sales.
• France has 19,000 food processing companies, and SMEs represent 98% of the food processing industry.
Asia-Pacific
• China’s total retail sales of consumer goods are captured at 6.8 USD trillion in 2024, with 3.5% annual growth.
• India’s food retail industry revenue is listed at 869 USD billion in 2025, with 7% annual growth.
• Japan’s retail food and beverage sales are listed at 193 USD billion in 2024.
• Indonesia’s grocery retail sector sales are listed at 101 USD billion in 2024.
• Traditional retailers account for 73% of Indonesia’s grocery retail market, while the non-traditional channel is implied at 27%.
• Vietnam’s food retail sales are listed at 55.5 USD billion in 2024, with 1% annual growth.
• Vietnam’s consumer-oriented product imports are listed at 15.7 USD billion, equal to 28.3% of food retail sales in the import-intensity calculation.
• Singapore’s retail food and beverage sales are listed at 12 USD billion in 2024.
• The Philippines warehouse club sales forecast is 1.3 USD billion, with food and beverage representing 66.7% of club sales.
Latin America
• Colombia’s foodservice sales are listed at 17 USD billion in 2024.
• Colombia’s foodservice sales grew 6% year over year in the market benchmark.
• Colombia’s expected foodservice industry growth for 2025 is listed at 1%.
• Peru’s local processed food products account for 70% of market demand in the retail-food benchmark.
• Peru’s consumer-oriented product imports are listed at 2 USD billion.
• Latin American market strategy should separate staple demand, imported product demand, beverage consumption, foodservice growth, and affordability pressure by country.
Middle East and Africa
• South Africa’s retail food sales are listed at 50 USD billion in 2024.
• South Africa’s consumer-oriented agricultural imports are listed at 3.5 USD billion.
• Consumer-oriented imports account for 7% of South Africa’s retail food sales in the import-intensity calculation.
• The United Arab Emirates population supporting retail food demand is listed at 11.3 million people.
• Middle East food and beverage strategy should consider imported products, halal demand, tourism, hospitality, modern grocery, and premium retail formats.
• African food and beverage markets should be analyzed through population, affordability, modern retail development, food security, imports, and local staples.
| Region | Food and beverage implication |
|---|---|
| North America | Mature demand, concentrated grocery, processed foods, private label, ecommerce, and beverage moderation shape market strategy. |
| Europe | Large manufacturing base, strict regulation, sustainability, premium food, SMEs, and private label influence the market. |
| Asia-Pacific | Population scale, rising income, urbanization, retail modernization, and ecommerce create strong growth potential. |
| Latin America | Staples, affordability, beverages, local processing, imports, and modern retail expansion shape demand. |
| Middle East & Africa | Imports, halal products, food security, tourism, and modern grocery formats support opportunity but vary sharply by country. |
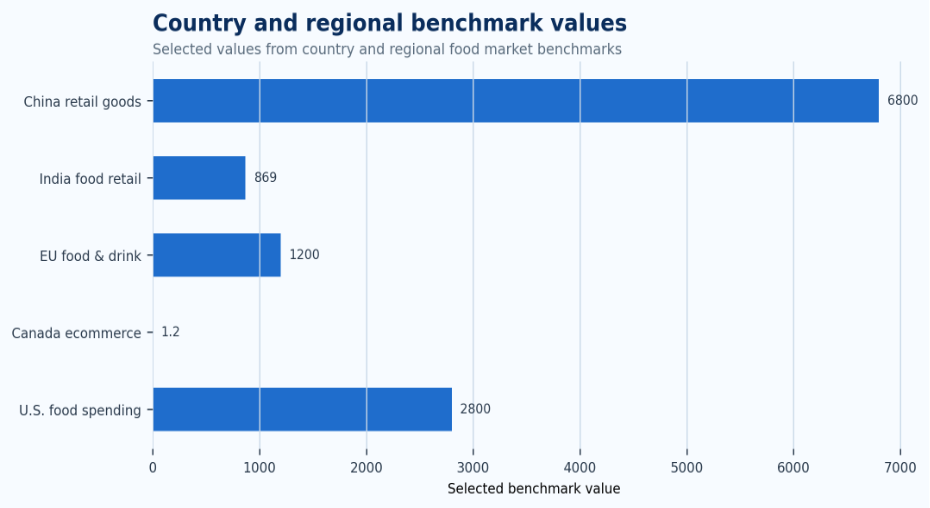
Figure 4. Country-level food and beverage values show why market strategy should be measured by country, not only by global or regional averages.
Regional interpretation
Food and beverage localization is deeper than translation or currency. It includes pack size, retail format, price tier, ingredient preferences, import rules, local brands, cold-chain capacity, foodservice habits, and trust cues. Regional averages are useful for orientation, but country-level data decides execution.
Country-Level Food and Beverage Statistics
Country-level statistics turn a broad market analysis into a useful planning document. The country section combines market-size, retail, foodservice, import, and channel indicators. These values are not perfectly comparable across all countries because they represent different food-related measures, but they are useful anchors for country-by-country opportunity mapping.
• China is ranked 1st among the country food, retail, and foodservice comparison because its captured retail sales value is 6,800 USD billion.
• China’s comparison value equals about 69.459% of the Mordor 2026 global food and beverage market value in the comparison calculation.
• India is ranked 2nd among the country comparison values with 869 USD billion in food retail industry revenue.
• India’s comparison value equals 8.876% of the Mordor 2026 global food and beverage market value in the comparison calculation.
• Japan is ranked 3rd among the country comparison values with 193 USD billion in retail food and beverage sales.
• France is ranked 4th among country comparison values with 176.7 USD billion in food processing sales.
• Indonesia is ranked 5th among country comparison values with 101 USD billion in grocery retail sector sales.
• Vietnam is ranked 6th among country comparison values with 55.5 USD billion in food retail sales.
• South Africa is ranked 7th among country comparison values with 50 USD billion in retail food sales.
• Colombia is ranked 8th among country comparison values with 17 USD billion in foodservice sales.
• Singapore is ranked 9th among country comparison values with 12 USD billion in retail food and beverage sales.
• Peru is ranked 10th among country comparison values with 2 USD billion in consumer-oriented product imports.
• The Philippines is ranked 11th among country comparison values with 1.3 USD billion in warehouse club sales.
| Country/market | Market value | Primary market angle |
|---|---|---|
| China | 6,800 USD billion | Large retail base and scale market. |
| India | 869 USD billion | Fast-growing food retail and long-term consumption growth. |
| Japan | 193 USD billion | Mature retail food and beverage benchmark. |
| France | 176.7 USD billion | Food processing and EU manufacturing strength. |
| Indonesia | 101 USD billion | Traditional grocery dominance and modern-channel opportunity. |
| Vietnam | 55.5 USD billion | Food retail growth and import intensity. |
| South Africa | 50 USD billion | Retail food sales and import exposure. |
| Colombia | 17 USD billion | Foodservice market and away-from-home demand. |
| Singapore | 12 USD billion | Import-oriented, premium, urban food retail market. |
| Peru | 2 USD billion | Processed food demand and consumer-oriented imports. |
| Philippines | 1.3 USD billion | Warehouse clubs and value-oriented modern retail. |
Country readout
Country comparisons must be interpreted carefully because the country section mixes retail sales, foodservice, processing, imports, and warehouse club metrics. The purpose is not to claim every country value is the same type of measure; the purpose is to identify the strongest market anchors and country-level demand signals.
Trade, Imports, and Supply-Chain Statistics
Food and beverage demand is local, but supply chains are global. Many markets depend on imported ingredients, consumer-oriented food products, refrigerated logistics, packaging materials, agricultural inputs, and cross-border retail brands. That means import and supply-chain statistics belong beside consumer demand statistics.
• South Africa’s consumer-oriented agricultural imports are listed at 3.5 USD billion in 2024.
• South Africa’s consumer-oriented imports represent 7% of retail food sales in the import-intensity calculation.
• Vietnam’s consumer-oriented product imports are listed at 15.7 USD billion in 2024.
• Vietnam’s import-intensity calculation places consumer-oriented imports at 28.3% of food retail sales.
• France imported 1.05 USD billion from the United States in the France retail-food benchmark.
• U.S. imports represent 0.59% of French food processing sales in the import-context calculation.
• Peru’s consumer-oriented product imports are listed at 2 USD billion.
• The Dominican Republic records a 43% United States share of the local import market.
• U.S. consumer-oriented exports to the Dominican Republic grew 7% from January to July 2025 in the market benchmark.
• The UAE population supporting retail food demand is listed at 11.3 million people, highlighting the role of imports and premium food retail in import-dependent markets.
Supply-chain interpretation
Food and beverage companies should not read import data only as a trade statistic. Import intensity can shape shelf availability, price volatility, margin risk, brand access, food security, cold-chain requirements, and the speed at which imported premium products can scale.
Private Label, Affordability, and Retail Power
Private label and affordability should be treated as market indicators because they show how consumers respond to food prices and how retailers use scale. When shoppers become more price sensitive, they may trade down from branded products, shift to discounters, buy larger value packs, reduce restaurant visits, or compare prices across apps and stores.
• Canada’s top five grocery companies account for 65% of the retail grocery market, giving large retailers strong influence over assortment and price positioning.
• Canadian discounters represent 7.9% of staple food distribution in the channel benchmark.
• Canadian supermarkets represent 46.5% of staple food distribution, making them central to household grocery decisions.
• Canadian hypermarkets represent 20.9% of staple food distribution, supporting bulk and larger-basket purchases.
• Indonesia’s traditional retailers hold 73% of grocery retail, showing that affordability and local channel access can matter more than modern-format share in emerging markets.
• Peru’s local processed food products account for 70% of market demand, showing that domestic food production remains important even when imports are part of the market.
• The Dominican Republic supermarket channel holds 20% to 25% of retail sales, leaving a large non-supermarket share in the market.
• Food inflation should be analyzed through basket size, price-tier switching, private-label share, promotion dependence, and foodservice substitution.
| Price-pressure signal | What it may reveal |
|---|---|
| Higher private-label share | Consumers are trading down or retailers are building stronger own-brand ranges. |
| Smaller basket size | Households are managing food budgets more carefully. |
| More discount visits | Value channels are becoming more important for everyday food. |
| Lower restaurant frequency | Foodservice may be losing some occasions to at-home meals. |
| More promotions | Brand loyalty may be weakening or price comparisons may be increasing. |
| More local staples | Imported premium products may need sharper positioning and price justification. |
Affordability readout:
Food and beverage growth is not automatically profitable growth. When revenue rises because of inflation while volumes fall, manufacturers and retailers need to evaluate units, margin, basket mix, and consumer trade-down behavior together.
Health, Wellness, and Functional Food Statistics
Health and wellness trends give food and beverage companies a premiumization path, but they also create product-risk questions. A claim can attract consumers only when it is credible, compliant, affordable, and tied to a real consumption occasion. Functional beverages, protein products, probiotics, low-sugar alternatives, and clean-label foods all sit inside this wider health-driven demand pattern.
• Non-alcoholic beer volume grew 9% in 2024, showing a measurable shift inside beer occasions.
• Non-alcoholic beer represents 2% of global beer volume, leaving room for additional adoption but also showing that the segment is still small compared with core beer.
• Global non-alcoholic beer market value is listed at 13.7 USD billion.
• Global non-alcoholic beer market projection is listed at 23 USD billion.
• U.S. non-alcoholic beer volume increased 175% since 2019, showing strong momentum in one mature beverage market.
• Global alcohol consumption changed by –1% year over year in 2024 in the beverage trend data.
• The legal drinking population is projected to grow 9% versus the 2025 baseline by 2035.
• Global alcohol consumption is projected at 1% below the 2025 baseline by 2035 in the alcohol trend benchmark.
• Health-oriented demand should also be measured through dairy protein products, yogurt, fortified drinks, plant-forward meals, low-sugar foods, and clean-label packaged products.
• Dairy foods growing from 1,063.47 USD billion in 2026 to nearly 1,995.47 USD billion by 2034 gives one example of how staple categories can also support premium health-oriented formats.
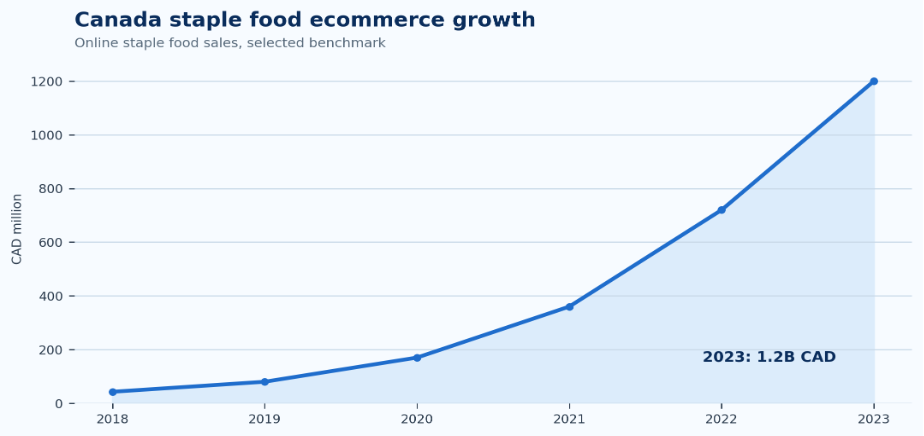
Figure 5. Growth-index comparison shows why food and beverage opportunity should be measured by segment because dairy, processed meat, RTD beverages, beverages, and the total market move at different speeds.
Health and wellness interpretation:
The better-for-you theme should not be presented as a single consumer trend. It includes moderation, protein, digestive health, low sugar, clean label, fortified nutrition, and permissible indulgence. Each subtend has a different price ceiling, regulatory risk, and repeat-purchase pattern.
Food and Beverage Market Challenges
Food and beverage companies face margin compression, commodity volatility, food inflation, labor cost, packaging cost, climate risk, food safety requirements, cold-chain constraints, trade barriers, and category regulation. Growth is valuable only when it can be converted into profitable and reliable supply.
• Market-size growth may reflect price inflation as well as real consumption growth, so volume and value should be separated.
• Foodservice growth can slow when menu prices rise faster than household income.
• Grocery retail concentration can increase retailer bargaining power against manufacturers.
• Traditional grocery share can slow modern channel adoption in markets where local stores remain dominant.
• High import intensity can expose food categories to exchange rates, logistics costs, and trade disruptions.
• Cold-chain gaps can restrict dairy, meat, frozen food, seafood, and ready-meal expansion.
• Health regulation can force reformulation in sugar, salt, alcohol, labeling, and functional-claim categories.
• Food safety risk remains a core market challenge because recalls can damage trust and distribution.
• Sustainability pressure affects packaging materials, waste reduction, sourcing claims, water use, and transport emissions.
• Private-label growth can pressure branded manufacturers if value-tier products gain consumer trust.
| Challenge | Core signal to measure | Likely business owner |
|---|---|---|
| Food inflation | Retail price, basket size, value-tier share | Pricing and category teams |
| Supply-chain pressure | Stockouts, lead times, logistics cost | Procurement and operations |
| Import exposure | Import share, exchange-rate sensitivity, landed cost | Trade and sourcing teams |
| Food safety | Recalls, audits, supplier quality | Quality and compliance |
| Regulation | Label changes, reformulation cost, claim compliance | Regulatory and product teams |
| Retailer power | Listing fees, private label share, margin terms | Sales and key accounts |
| Digital fulfillment | Picking cost, delivery cost, substitution rate | Ecommerce and operations |
Risk interpretation
The strongest food and beverage companies do not treat risk as separate from growth. They test whether growth is durable after input costs, trade exposure, retail power, food safety controls, delivery cost, and pricing pressure are included.
Food and Beverage Revenue Opportunity Diagnostic
A benchmark analysis should help readers decide where to look next. The most useful structure is a diagnostic model that connects statistics to commercial action. Each statistic should answer a business question: where is the market large, where is it growing, where is channel behavior changing, where are consumers trading down, and where do supply-chain risks matter?
| Opportunity area | Core signals to measure | Useful benchmark angle |
|---|---|---|
| Market expansion | Regional CAGR, country size, income growth, urbanization | Asia-Pacific and emerging markets show scale and growth potential. |
| Category growth | Packaged food, dairy, RTD beverages, processed meat, beverages | Segment values show where demand is concentrated. |
| Channel growth | Grocery retail, foodservice, warehouse clubs, ecommerce | Channel data shows where sales are captured. |
| Premiumization | Average price, premium share, brand mix | Higher-value food and beverage products can raise margin. |
| Affordability | Private label, discount share, basket size | Trade-down behavior reveals pressure and opportunity. |
| Health and wellness | Functional, low/no alcohol, protein, low sugar, clean label | Better-for-you demand can support new product development. |
| Supply chain | Imports, cold chain, logistics, stockouts | Operational resilience determines whether demand can be served. |
The numbers locate market opportunity rather than only decorating the page. A company can then compare external benchmarks with its own sales data, pricing, margins, retail listings, and customer behavior.
90-Day Food and Beverage Benchmark Plan
Statistics become useful when they are translated into a measurement plan. A practical food and beverage benchmark review can be organized into a 90-day cycle rather than a vague market-research project.
| Timing | What to do | Output |
|---|---|---|
| Days 1-30 | Build the baseline by region, country, product category, channel, price tier, and consumer segment. | A clear map of where demand and revenue are concentrated. |
| Days 31-60 | Compare growth categories such as beverages, snacks, dairy, ready meals, grocery ecommerce, and foodservice. | A priority list of high-growth product and channel opportunities. |
| Days 61-90 | Review margin, inflation, supply-chain, private-label, and regional risk signals. | A repeatable scorecard for profitable market expansion. |
Planning principle
The best food and beverage teams do not chase every benchmark. They compare external statistics against their own category mix, retail channels, sourcing exposure, consumer behavior, price elasticity, and margin profile.
Metrics Food and Beverage Leaders Should Track
The final scorecard should be detailed enough to locate the opportunity without becoming a vanity dashboard. These metrics are the minimum useful set for a mature food and beverage market review.
| Metric | Why it matters |
|---|---|
| Market size | the total addressable opportunity and market maturity. |
| CAGR | expected growth speed but must be separated from inflation. |
| Category share | which product groups drive demand. |
| Regional revenue split | Identifies geographic exposure and localization needs. |
| Country-level growth | Helps prioritize market entry and distribution investment. |
| Grocery retail share | household consumption strength. |
| Foodservice share | away-from-home demand and hospitality recovery. |
| Online grocery share | Measures digital channel adoption and fulfillment pressure. |
| Private-label share | price sensitivity and retailer power. |
| Average basket size | consumer spending pressure and trading behavior. |
| Import dependency | trade, logistics, and supply-chain exposure. |
| Gross margin by category | Separates profitable growth from volume growth. |
| Repeat purchase rate | Measures loyalty and product-market fit. |
| Waste and spoilage rate | operational efficiency in fresh and cold-chain categories. |
Food and Beverage Market Statistics FAQ
Common questions
What is the size of the global food and beverage market?
The global food and beverage market is estimated at 9.79 USD trillion in 2026 and projected to reach 11.78 USD trillion by 2031 in one benchmark. Another food-and-beverages series places the market at 8.71 USD trillion in 2025 and 14.72 USD trillion by 2034.
Which region is most important for food and beverage growth?
Asia-Pacific is the most important long-term growth region because it combines population scale, rising income, urbanization, ecommerce adoption, packaged food growth, and large country markets such as China, India, Japan, Indonesia, and Vietnam.
How large is the packaged food market?
One packaged-food forecast places the market at 3.3 USD trillion in 2024 and projects 5.97 USD trillion by 2034. A second benchmark places packaged food at 2.69 USD trillion in 2025 and 3.93 USD trillion by 2034.
How is online grocery changing the market? Online grocery changes fulfillment economics, not just sales channels. Canada’s staple food ecommerce sales rose from 42.6 CAD million in 2018 to 1.2 CAD billion in 2023, while store-based distribution still r
epresented 95.5% of staple food distribution in 2023.
What consumer trends are shaping food and beverage demand?
The strongest consumer trends include convenience, affordability, health and wellness, premiumization, sustainability, online grocery, low/no alcohol, protein demand, and functional beverages. Each trend should be measured through repeat purchase and price tolerance, not only survey interest.
What metrics should companies track?
Food and beverage leaders should track market size, CAGR, category share, regional revenue, country growth, grocery retail share, foodservice share, online grocery share, private-label share, average basket size, import dependency, margin, repeat purchase, waste, and spoilage.
Final Takeaway
Food and beverage market performance depends on five systems working together: product category demand, regional and country-level consumption, grocery and foodservice channels, consumer trends, and supply-chain economics. The statistics show that the market is large enough for small changes to matter, but too diverse for one global number to explain strategy.
The most useful analysis finds the actual growth pocket. If packaged food is growing, the question is whether demand is coming from convenience, private label, premium brands, health claims, or ecommerce. If beverages are growing, the question is whether demand is coming from hydration, RTD convenience, energy, functionality, or moderation.
For food manufacturers, beverage companies, retailers, distributors, investors, and foodservice operators, the practical goal is a market system that is measurable by category, channel, region, and consumer need. The strongest opportunities appear where demand, retail access, supply-chain readiness, and profitable pricing align.