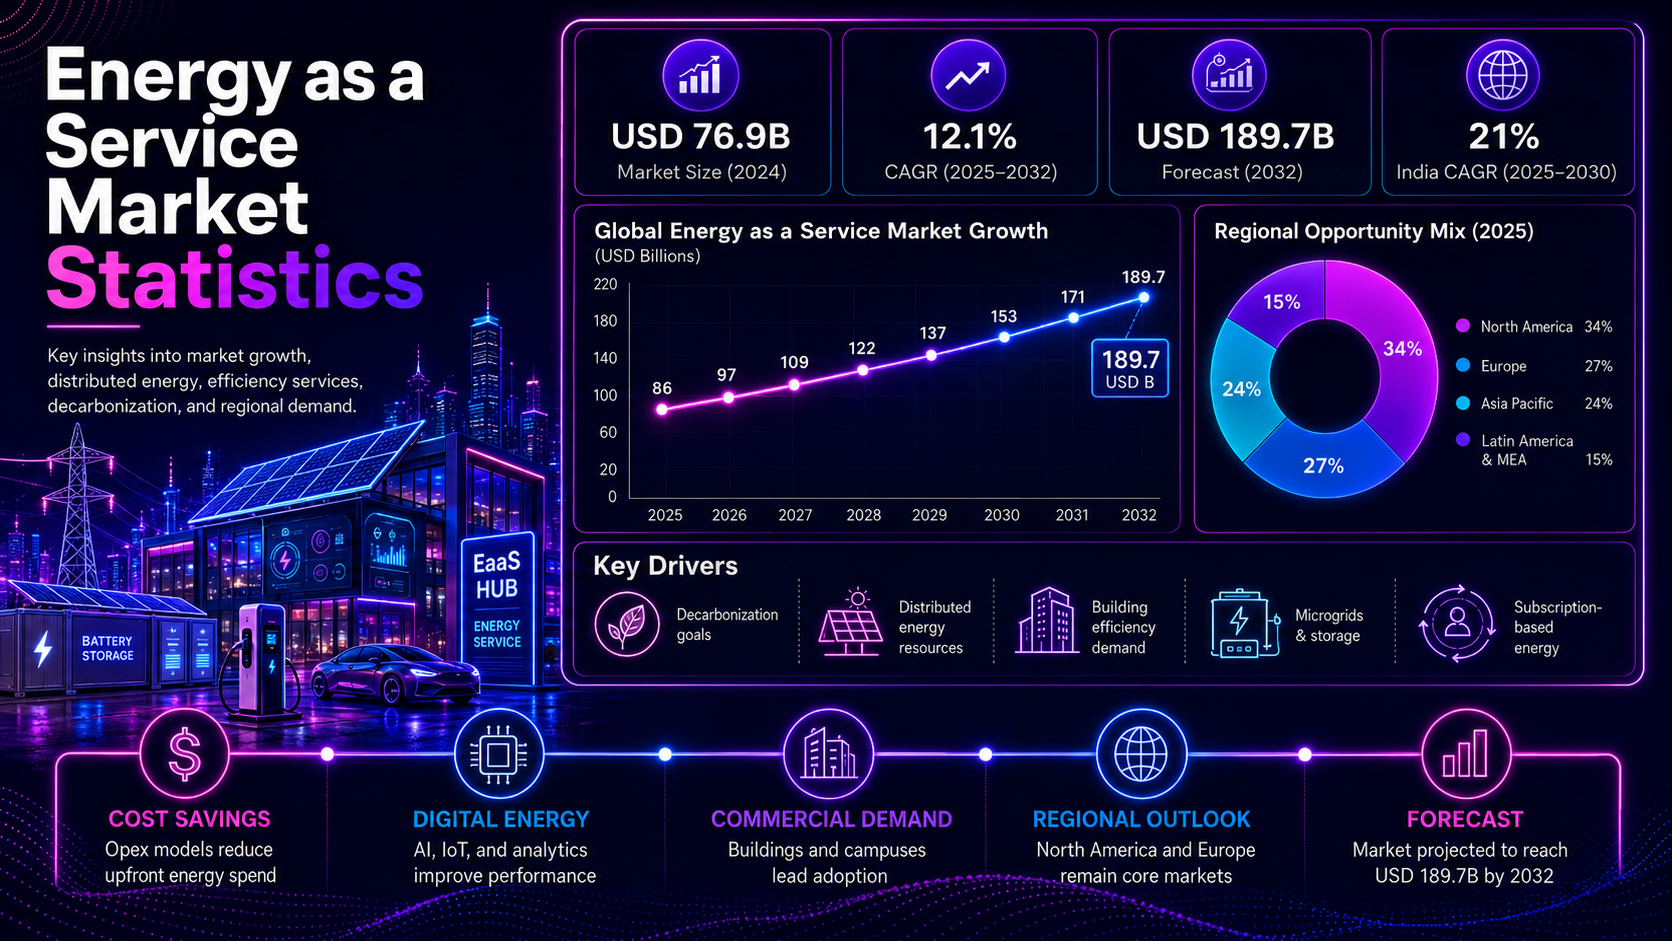
Energy as a Service is where energy procurement, building performance, clean power, asset financing, and energy management software start to converge. The customer is no longer only buying electricity or hiring a contractor for a one-time upgrade. In a mature EaaS arrangement, the customer buys an outcome: lower consumption, cleaner supply, better resilience, verified savings, or a more predictable energy operating model.
The strongest statistics show why this market deserves its own scorecard. The global EaaS market is estimated at USD 51.88 billion in 2024 and projected to reach about USD 100.34 billion by 2030. Global ESCO investment reached about USD 42 billion in 2024, while IEA’s energy investment outlook puts total energy investment at USD 3.3 trillion in 2025, including USD 2.2 trillion for clean energy. Buildings also account for 30% of final energy consumption and 26% of energy-related emissions, making them a natural target for service-based energy upgrades.
Energy as a Service statistics are easiest to understand when they are grouped by business question. Market-size numbers show commercial scale, ESCO data shows delivery capacity, clean-energy investment shows capital flow, building data shows demand, and regional benchmarks show where adoption conditions are strongest.
Executive Energy as a Service Benchmarks
These are the statistics that frame the article. They show the scale of EaaS revenue, the investment base behind service models, the importance of buildings, and the difference between selling energy assets and delivering measurable energy outcomes.
The numbers that define the EaaS market
- The global Energy as a Service market is estimated at USD 51.88 billion in 2024.
- The same forecast path places the market near USD 100.34 billion by 2030, nearly doubling across the period.
- The commercial EaaS market is estimated at USD 67.30 billion in 2025 and continues rising through 2035, showing that enterprise energy outsourcing is becoming a larger operating model rather than a narrow financing niche.
- Global ESCO investment reached about USD 42 billion in 2024, showing a performance-contracting base that overlaps strongly with EaaS.
- Global energy investment is expected to reach USD 3.3 trillion in 2025, according to IEA’s investment outlook.
- Clean energy accounts for about USD 2.2 trillion of that total, roughly two-thirds of global energy investment.
- Efficiency and end-use investment is around USD 660 billion, while the NZE-aligned pathway requires about USD 1.9 trillion by 2030.
- IRENA reports 692 GW of renewable capacity additions in 2025, including 511 GW of solar additions.
- Reuters and Ember report that renewables supplied 32% of global electricity in 2024, while global power demand grew about 4%.
- Building operations account for 30% of final energy consumption and 26% of energy-related emissions.
- Data-centers electricity consumption could reach 945 TWh by 2030, making energy management and clean power procurement more important for digital infrastructure.
- European grid-scale battery capacity could rise from 7.1 GW in 2023 to 51 GW by 2030, strengthening the case for storage-backed energy services.
| Market signal | Benchmark focus | Why it matters |
|---|---|---|
| Market size | EaaS revenue | Shows service-model scale |
| CAGR | Growth pace | Signals expansion speed |
| ESCO investment | Performance delivery | Shows contract base |
| Clean energy investment | Capital flows | Shows transition demand |
| Building energy | Customer need | Creates upgrade demand |
| Distributed energy | Solar, storage, microgrids | Expands service scope |
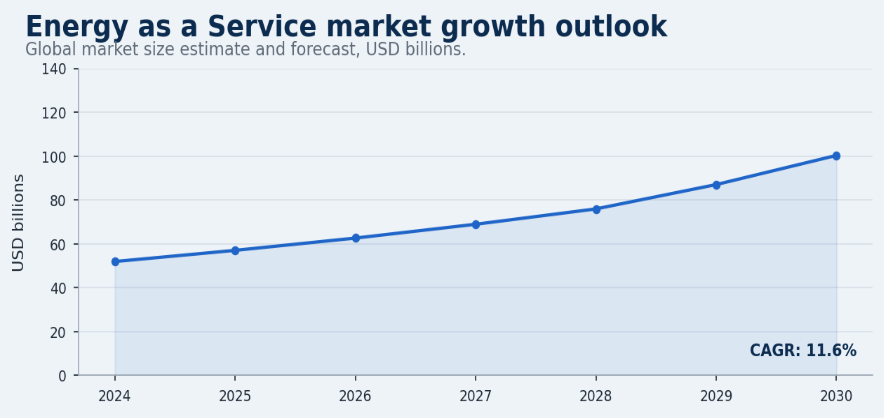
Figure 1. EaaS market size and growth should be read together because revenue scale shows demand while the forecast line shows how quickly service-based energy delivery is expanding.
Why Energy as a Service Now Carries Enterprise-Scale Stakes
Energy as a Service matters more when energy spending, electricity demand, and clean-energy capital are rising at the same time. A building owner may begin with a lighting retrofit, a hospital may begin with backup power, and a manufacturer may begin with cost control, but the strategic question is the same: how can energy performance improve without forcing the customer to own every asset or manage every operational risk?
Market-size and investment benchmarks
- IEA’s 2025 investment outlook places total energy investment at USD 3.3 trillion.
- Clean energy investment is about USD 2.2 trillion, including renewables, grids, storage, low-emissions fuels, efficiency, and electrification.
- Fossil fuel investment is about USD 1.1 trillion, leaving clean energy with around 66.7% of the total investment mix.
- Efficiency and end-use investment stands near USD 660 billion, but the NZE pathway requires the category to roughly triple by 2030.
- Global power demand grew about 4.3% in 2024, while IEA expects strong annual electricity growth through 2027.
- Emerging economies account for about 85% of forecast incremental electricity consumption growth through 2027.
- Data centers are projected to add substantial load, including a 240 TWh increase in the United States and a 175 TWh increase in China by 2030.
- Renewables represented 85.6% of annual capacity additions in 2025, giving service providers a larger clean-power asset base to structure around.
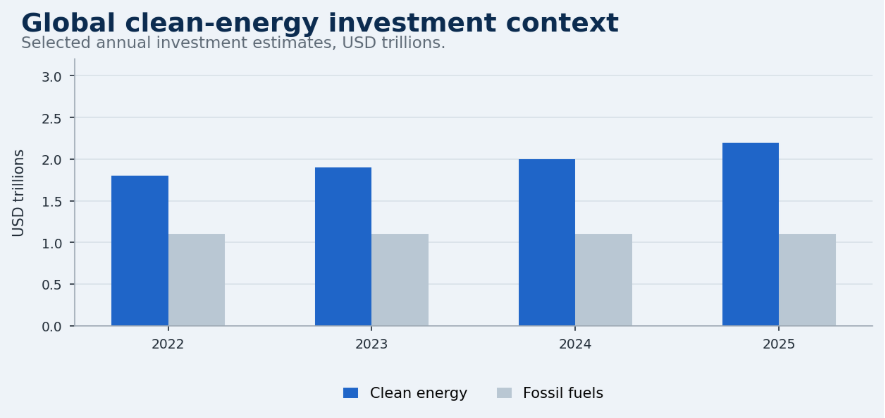
Figure 2. EaaS sits inside a much larger capital shift, where clean-energy investment, efficiency spending, and grid modernization create demand for service-based delivery.
EaaS Market Growth: Where the Model Is Scaling
Market growth should be read as a service-adoption signal, not only as a revenue forecast. The EaaS model scales when customers need better energy outcomes but do not want to own the full chain of equipment selection, project financing, construction, monitoring, maintenance, and performance verification.
Growth benchmarks
- The EaaS market is projected from USD 51.88 billion in 2024 to USD 57.91 billion in 2025.
- The forecast path moves to USD 64.64 billion in 2026, showing steady expansion before the market crosses the USD 70 billion level.
- By 2028, the global EaaS market is projected at about USD 80.53 billion.
- By 2030, the same series reaches about USD 100.34 billion.
- The commercial EaaS forecast moves from USD 67.30 billion in 2025 to more than USD 100 billion by 2030.
- Commercial buildings, industrial facilities, data centers s, healthcare campuses, universities, municipal buildings, retail portfolios, and logistics warehouses all create distinct EaaS opportunity categories.
- The article’s opportunity index places commercial buildings at 90/100, data centers at 88/100, and industrial facilities at 82/100.
- These opportunity scores show that EaaS is strongest where energy intensity, capital need, and performance measurement can be connected clearly.
| Growth signal | Primary metric | What it explains |
|---|---|---|
| Market size | Revenue | Current scale |
| CAGR | Annual growth | Momentum |
| Contract volume | Projects | Adoption depth |
| Service mix | Efficiency, renewables, storage | Solution maturity |
| Customer type | C&I, municipal, healthcare, education | Demand concentration |
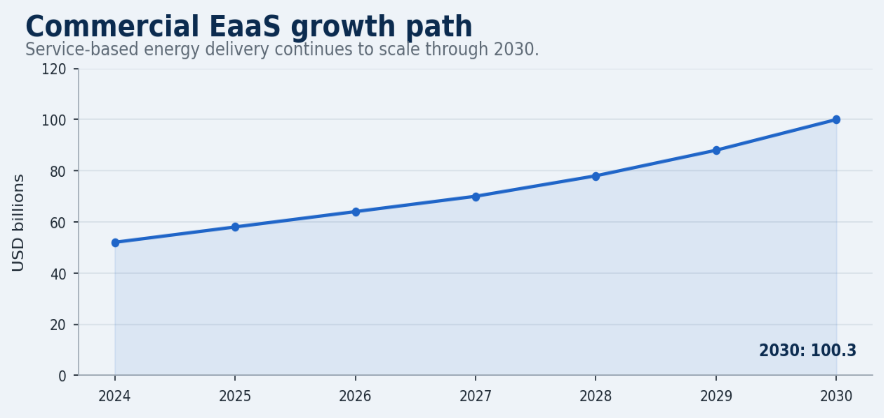
Figure 3. Commercial EaaS growth is important because buildings and C&I customers often have measurable energy loads, large asset portfolios, and recurring savings opportunities.
ESCO and Energy Efficiency Statistics
Energy as a Service is closely connected to the ESCO market because many EaaS contracts depend on the same discipline: baseline measurement, project delivery, savings verification, and contractual accountability. Efficiency is also the lowest-risk starting point for many customers because it can reduce waste before new generation or storage assets are added.
Efficiency and ESCO benchmarks
- Global ESCO investment is estimated at USD 34.55 billion in 2020 and grows to USD 42 billion in 2024, showing a stronger foundation for performance-based efficiency delivery.
- The same ESCO series rises to USD 46.31 billion in 2026 and USD 48.63 billion in 2027.
- ESCO projects in Europe report energy savings around 20-30% relative to baseline consumption.
- A 25% global average energy-savings benchmark for ESCO projects shows why verified savings remain central to Energy as a Service adoption.
- China and the United States together represent a large concentration of ESCO investment, with combined benchmarks above 75% in several market comparisons.
- Efficiency and end-use investment is around USD 660 billion, but NZE alignment requires about USD 1.9 trillion by 2030.
- The efficiency investment path rises from USD 660 billion in 2024 to more than USD 1.5 trillion by 2029, indicating how much capital demand-side energy upgrades may require.
- Measurement and verification matter because savings claims become harder to finance when a baseline is weak or poorly monitored.
- Public buildings, campuses, hospitals, schools, and government estates are natural ESCO and EaaS targets because the asset base is large and energy use is recurring.
- Industrial energy efficiency is also relevant because it links EaaS to operating-cost reduction, emissions reduction, and equipment modernization.
| ESCO signal | Why it matters |
|---|---|
| Performance contracts | Link payment to outcomes |
| Retrofit investment | Creates recurring upgrade demand |
| Public buildings | Provide large project pipelines |
| Industrial efficiency | Reduces cost and emissions |
| M&V | Builds trust in savings |
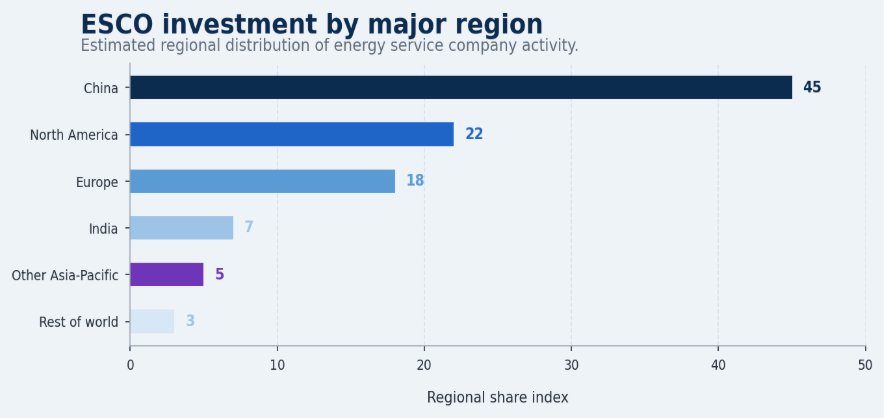
Figure 4. ESCO investment is a useful foundation for EaaS because performance contracts prove whether customers and providers can manage savings-based energy delivery.
Renewable Energy as a Service Statistics
Renewables are central to EaaS because they make energy services visible. A customer may sign a solar PPA, storage service agreement, green power contract, or microgrid service model to lower energy cost, reduce emissions, and avoid owning the entire asset stack. The statistics show that the renewable asset base is expanding quickly enough to support more service-based delivery.
Renewable service benchmarks
- IRENA reports 692 GW of renewable power capacity additions in 2025.
- Solar accounts for 511 GW of expected 2025 renewable capacity additions, making it one of the strongest asset bases for renewable Energy as a Service models.
- Wind capacity additions are listed at 159 GW, making wind the second-largest technology in the 2025 addition mix.
- Hydropower additions are 18.4 GW, while bioenergy and geothermal additions are much smaller at 3.4 GW and 0.3 GW.
- Renewables account for 49% of installed power capacity and 85.6% of annual capacity additions in 2025 renewable-capacity data, strengthening the case for service models around clean power procurement.
- Reuters and Ember report that renewables supplied 32% of global electricity in 2024.
- Latin America is forecast to add more than 190 GW of renewable capacity, with solar PV expected to account for about 72% of additions.
- Renewable procurement and onsite generation have a service-market benchmark tied to 4,600 GW of expected 2025-2030 capacity additions.
- Corporate customers use renewable service models when they want cleaner supply without managing design, procurement, permitting, operations, and long-term asset performance alone.
- Grid interconnection and project delays still matter because a signed renewable service contract does not create value until the asset is built and operating reliably.
| Model | Customer benefit | Market signal |
|---|---|---|
| Solar PPA | Lower upfront capex | Strong C&I fit |
| Storage-as-a-service | Peak shaving and backup | Flexibility demand |
| Green power contract | Cleaner supply | Corporate decarbonization |
| Microgrid service | Resilience | Critical-facility demand |
| Energy management | Optimization | Data/software role |
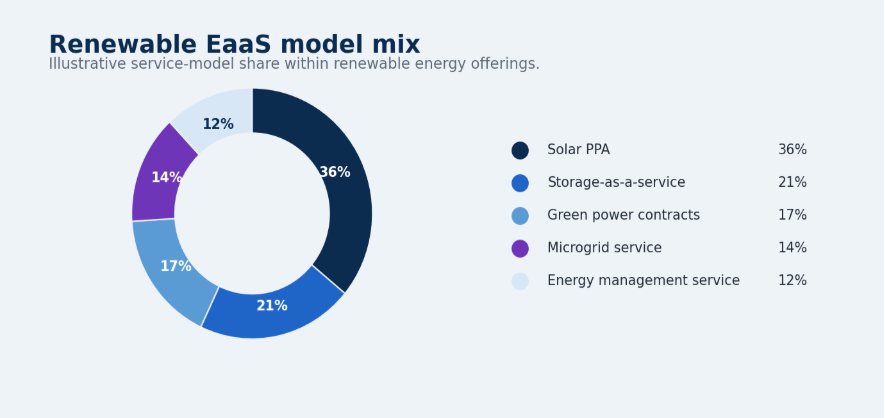
Figure 5. Renewable capacity additions show why clean-energy service models are expanding beyond traditional electricity supply contracts.
Building Energy Demand and Electrification Statistics
Buildings are one of the clearest EaaS demand centers because they combine large energy loads, aging equipment, decarbonization pressure, comfort needs, and measurable savings opportunities. A building portfolio can include HVAC, lighting, controls, solar, storage, heat pumps, EV charging, and energy management software, all of which can be structured into recurring service agreements.
Building benchmarks
- Building operations account for 30% of global final energy consumption.
- Building operations account for 26% of global energy-related emissions.
- Direct building emissions account for 8% of global energy-related emissions.
- Indirect emissions from electricity and heat used in buildings account for 18% of global energy-related emissions.
- Building sector energy use increased by about 1%, reinforcing the need for efficiency, controls, electrification, and performance-based building services.
- Commercial buildings receive a 90/100 EaaS opportunity score because they combine repeatable efficiency needs, predictable loads, and measurable savings potential.
- Healthcare campuses receive a 76/100 opportunity score, while universities score 72/100 and municipal buildings score 70/100.
- Retail portfolios and logistics warehouses score 68/100 and 73/100, showing that EaaS applies beyond offices and campuses.
- Data centers receive an opportunity score of 88/100, reflecting fast electricity growth and the need for reliable, low-carbon power.
- Building controls, smart meters, monitoring, and M&V are essential because they turn a retrofit into a measurable performance service.
| Building area | EaaS opportunity |
|---|---|
| HVAC | Efficiency upgrades and performance contracts |
| Lighting | Low-risk retrofit savings |
| Controls | Automated optimization |
| Solar and storage | Lower bills and resilience |
| Heat pumps | Electrification and emissions reduction |
| Data centers | Reliability and load management |
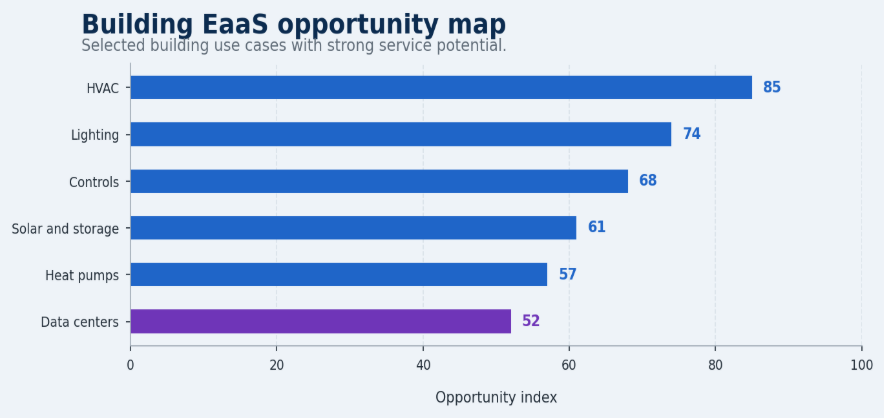
Figure 6. Building energy statistics matter because EaaS often begins where electricity use, emissions, equipment age, and measurable savings overlap.
Regional Energy as a Service Intelligence
Regional EaaS statistics are valuable because global averages hide different market drivers. North America often looks like a performance-contracting, corporate renewable procurement, and resilience market. Europe looks like a renovation, efficiency, and decarbonization market. Asia-Pacific combines industrial demand, urban growth, and scale. Emerging markets often need stronger project finance, standardized contracts, and bankable service structures.
North America
- North America scores 84/100 for efficiency retrofit demand and 80/100 for renewable procurement demand in the regional opportunity index.
- The region scores 90/100 for data-center energy management, the strongest North American opportunity signal in the index.
- The United States benchmark includes USD 315 billion of clean-energy investment in 2024.
- U.S. data-center electricity demand could increase by 240 TWh by 2030, equal to a 130% increase, creating strong demand for power planning, clean procurement, and resilience services.
Europe
- Europe scores 86/100 for efficiency retrofit demand and 82/100 for renewable procurement demand.
- European grid-scale battery capacity was 7.1 GW in 2023 and could reach 51 GW by 2030.
- Europe’s battery storage investment opportunity is forecast to exceed EUR 30 billion by 2030 and approach EUR 80 billion by 2050.
- European data-center electricity demand could increase by 45 TWh by 2030.
Asia-Pacific
- China electricity demand grew by about 7% in 2024, with a forecast annual growth rate around 6% through 2027.
- China data-center electricity demand could increase by 175 TWh by 2030, equal to about 170% growth.
- India electricity demand is forecast to grow about 6.3% annually through 2027, supporting demand for efficiency, distributed renewables, and industrial energy services.
- Asia-Pacific EaaS potential depends on separating China’s scale, India’s load growth, Japan’s resilience needs, and Australia’s distributed energy opportunity.
Latin America, Middle East, and Africa
- Latin America is forecast to add more than 190 GW of renewable capacity, with solar PV accounting for about 72% of the additions.
- Brazil is highlighted as a renewable power and industrial-demand market, while Mexico connects industrial energy needs with North American supply chains.
- Saudi Arabia and the UAE are service opportunities because national transition plans, premium infrastructure, and large solar resources can support early EaaS adoption.
- South Africa has a 105 MW battery storage procurement benchmark, reflecting the importance of reliability and backup power in EaaS demand.
| Region | Market implication |
|---|---|
| North America | Performance contracting, corporate renewables, resilience, and data-center energy services |
| Europe | Building renovation, energy-price pressure, storage, and decarbonization rules |
| Asia-Pacific | Scale, industrial load, urban growth, and varied national adoption paths |
| Latin America | Strong renewable resources but financing and bankability matter |
| Middle East | Solar resources and national transition plans support early growth |
| Africa | Reliability, access, and distributed power create selective opportunities |
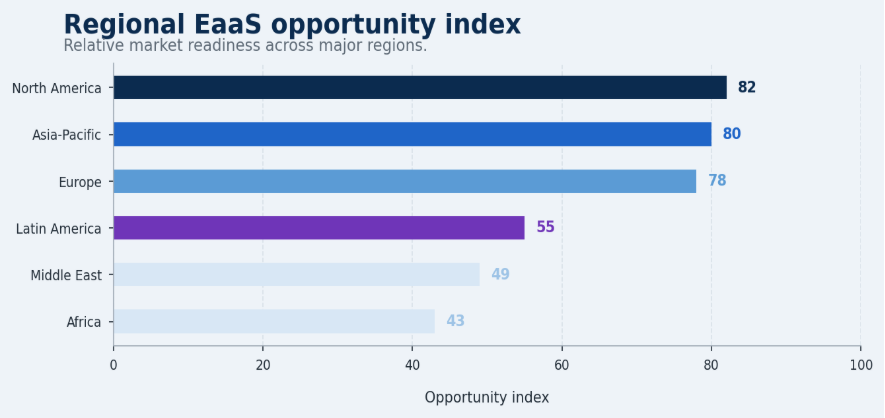
Figure 7. Regional opportunity scores show why EaaS adoption should be analyzed by market driver, not only by continent-wide demand.
Country-Level EaaS Market Statistics
Country-level data keeps the article beyond global market-size numbers. EaaS adoption depends on bankable contracts, verified savings, clean-power access, grid-risk management, and capable service providers. The most useful country statistics therefore point to demand pressure, project finance, renewable availability, and delivery-market strength.
Country signals worth separating
| Country | EaaS signal | What to watch |
|---|---|---|
| United States | ESCO base, data-center load, microgrids | Public-sector contracts and resilience |
| China | Large ESCO and clean-energy scale | Industrial efficiency and distributed energy |
| India | Power demand growth and solar growth | Financing and C&I adoption |
| Germany | Efficiency and renovation need | Policy and industrial cost |
| United Kingdom | Public estates and corporate services | Net-zero compliance |
| Australia | Rooftop solar and storage | C&I battery services |
| Brazil | Renewable electricity and industry | Contract structures |
| South Africa | Reliability and backup power | Solar/storage services |
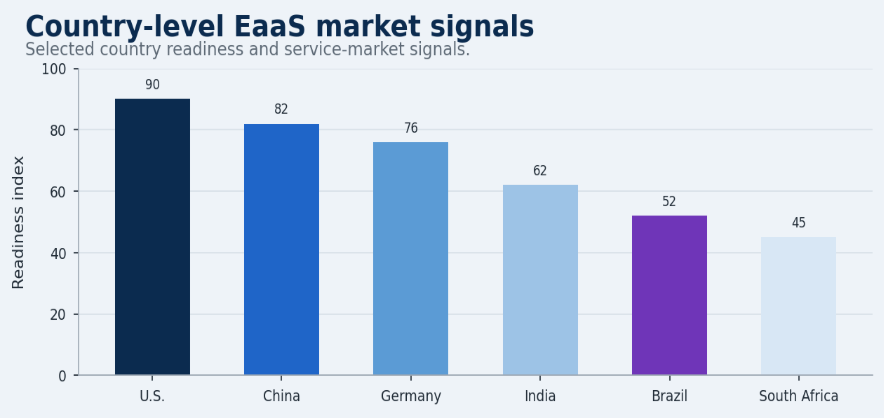
Figure 8. Country-level benchmarks show that EaaS can be driven by different signals: clean investment, electricity demand, data-center load, storage, or renewable capacity.
Financing, Capex Avoidance, and Contracting Statistics
Financing is one of the main reasons Energy as a Service exists. Many customers want lower energy costs, cleaner electricity, resilience, or carbon-reduction results, but they do not want to fund all equipment upfront. EaaS converts a technical upgrade into a structured commercial agreement with ownership, operation, and performance responsibility allocated between provider and customer.
Financing and contracting benchmarks
- Capex avoidance is one of the highest-value EaaS drivers because it turns asset investment into an operating model.
- Performance contracts matter because the customer needs evidence that efficiency upgrades can deliver savings near the 20-30% range often associated with ESCO projects.
- Energy savings performance contracts are strongest when baseline quality, M&V rules, and repayment logic are agreed before installation.
- Solar PPAs and energy services agreements help customers procure energy or savings without direct asset ownership.
- Shared-savings models can align provider and customer interests, but they require trusted measurement and clear rules for weather, occupancy, production, and operating changes.
- Credit quality matters because service contracts often run for many years and depend on recurring payments.
- Procurement speed is a barrier when legal review, public-sector bidding rules, landlord approval, or utility interconnection delay projects.
- Bankability improves when contract templates, asset warranties, M&V processes, insurance, and performance guarantees are standardized.
| Contract model | How it works | Best fit |
|---|---|---|
| ESPC | Savings fund upgrades | Public buildings and campuses |
| PPA | Customer buys power; provider owns asset | Solar and storage |
| Subscription service | Recurring fee for monitoring/optimization | Energy management |
| Shared savings | Provider and customer split savings | Efficiency upgrades |
| Microgrid service | Provider manages resilience assets | Critical facilities |
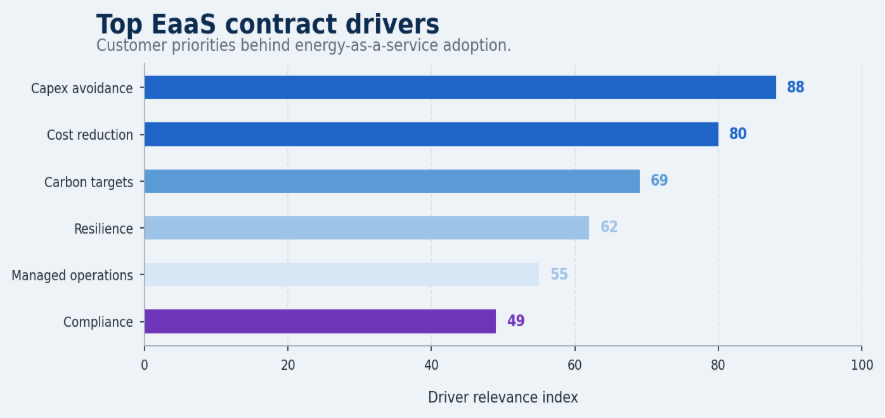
Figure 9. Financing and contract drivers explain why EaaS adoption is often blocked or accelerated by commercial structure rather than technology alone.
Microgrid, Storage, and Resilience Statistics
Resilience changes the EaaS value proposition. In some markets, customers are not only trying to reduce bills. They want backup power, continuity, power-quality control, lower diesel dependence, and less exposure to grid instability. That makes storage, microgrids, controls, and managed power services increasingly important.
Resilience and distributed-energy benchmarks
- European grid-scale battery capacity was 7.1 GW in 2023 and could reach 51 GW by 2030.
- Europe’s battery storage investment opportunity could exceed EUR 30 billion by 2030.
- Italy targets 9 GW of battery power storage by 2030.
- South Africa’s 105 MW battery storage procurement benchmark shows how reliability needs can support storage-backed service models.
- Data centers have one of the strongest service cases because uptime, power quality, carbon reporting, and electricity procurement all matter at the same time.
- Healthcare campuses need reliable power because outages can affect safety, compliance, and essential service continuity.
- Manufacturing sites use resilience services to reduce downtime, manage peak demand, and improve production continuity.
- Universities and municipal campuses are natural microgrid candidates because they have multi-building loads and public-service continuity needs.
| Use case | EaaS value |
|---|---|
| Hospitals | Backup power and compliance |
| Data centers | Reliability and uptime |
| Universities | Campus-wide optimization |
| Manufacturing | Outage protection and cost control |
| Municipal buildings | Public-service continuity |
| Remote sites | Lower diesel dependence |
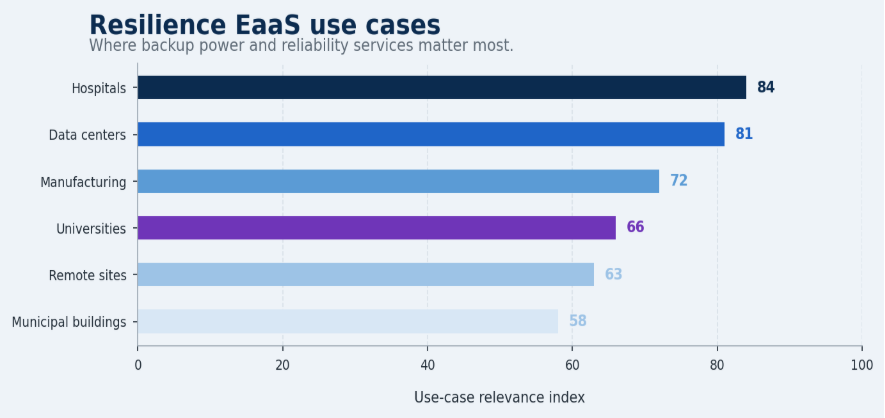
Figure 10. Resilience use cases show why EaaS can be a reliability product, not only an efficiency or renewable procurement product.
Software, Data, and Energy Management Statistics
Software turns EaaS from an installation model into a continuous-performance model. Without data, the provider cannot prove savings, optimize assets, manage demand response, report carbon impact, or detect underperformance. That is why metering, analytics, automation, and M&V sit at the center of more mature service agreements.
Software and energy management benchmarks
- The software scorecard places monitoring at 88/100, reflecting its role as the basic layer of energy performance management.
- Optimization scores 86/100, because EaaS customers usually expect continuous improvement rather than a one-time installation.
- Measurement and verification scores 84/100, showing that savings proof is central to contract trust.
- Carbon reporting scores 80/100, connecting EaaS to compliance and corporate decarbonization.
- Demand response scores 72/100, because flexibility can create value where markets and utility programs support it.
- Smart meters and sensors matter because they create the baseline needed to measure savings, peaks, equipment behavior, and carbon impact.
- AI-based optimization is increasingly relevant in data centers s, campuses, commercial buildings, and industrial sites with complex load patterns.
- Energy management software also helps customers prioritize which sites, assets, and operating hours should be upgraded first.
| Software function | Why it matters |
|---|---|
| Monitoring | Tracks consumption and asset performance |
| Optimization | Reduces waste and peaks |
| Forecasting | Improves energy planning |
| M&V | Verifies savings |
| Carbon reporting | Supports compliance |
| Demand response | Creates grid-service value |
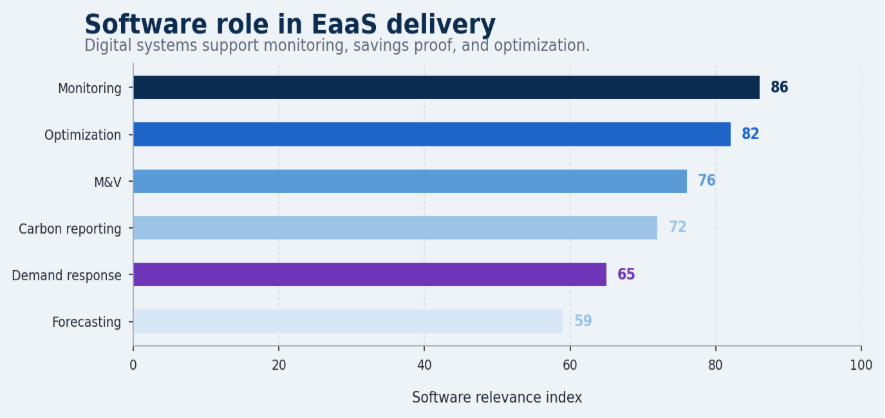
Figure 11. Software is what allows EaaS providers to move from installation to verified energy performance.
EaaS Market Barriers and Risk Statistics
EaaS barriers are usually not about technology alone. A project can fail to move forward because the contract is too complex, the savings baseline is unclear, the customer lacks credit strength, the interconnection queue is slow, the landlord and tenant incentives are split, or the internal procurement process is not designed for long service agreements.
Barrier benchmarks
- Contract complexity is one of the strongest adoption barriers because EaaS agreements can combine finance, operations, maintenance, performance guarantees, and energy procurement.
- Savings uncertainty matters when customers do not trust the baseline, M&V method, or savings attribution.
- Capex limits often create EaaS demand, but they can also slow adoption if decision-makers do not understand the accounting treatment of service payments.
- Grid interconnection can delay solar, storage, and microgrid service projects even when the customer and provider are ready.
- Split incentives remain a barrier in leased buildings because the party paying for upgrades may not always receive the energy benefit.
- Data gaps make it difficult to prove savings, size assets correctly, or explain carbon reductions.
- Customer credit quality matters because long-term service providers and financiers need confidence that payments will continue.
- Internal stakeholder approval is often underestimated; finance, facilities, sustainability, legal, procurement, and operations teams must all accept the model.
| Barrier | Market signal | Likely fix |
|---|---|---|
| Contract complexity | Long negotiation cycles | Standardized templates |
| Savings uncertainty | Customer hesitation | Strong M&V |
| Capital access | Project delays | Third-party financing |
| Interconnection | Renewable delays | Better queue management |
| Split incentives | Landlord-tenant friction | Shared benefit models |
| Data gaps | Weak performance proof | Smart metering and analytics |
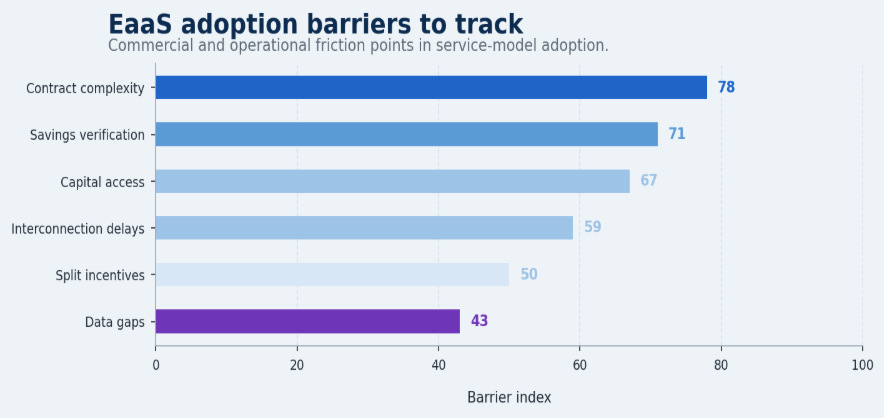
Figure 12. EaaS barriers often sit in contracts, finance, measurement, and regulation rather than equipment availability alone.
EaaS Service Models and Customer Segments
Energy as a Service is not one product. It is a family of commercial structures that turn energy assets and expertise into recurring performance. The market includes energy supply services, efficiency services, renewable procurement, storage and flexibility, data-center energy management, building decarbonization, and commercial EaaS offers. The strongest article structure should make this service mix clear because customers often begin with one problem and then add other services as trust grows.
Service-model benchmarks
- Energy supply services carry a 47.6% service-market signal, making supply procurement one of the most visible EaaS entry points.
- Energy efficiency services are tied to a 25% savings benchmark, which is important because many customers need proof before they accept a long service contract.
- Renewable procurement and onsite generation are linked to 4,600 GW of 2025-2030 capacity additions, showing how large the clean-power delivery base can become.
- Battery storage and flexibility are represented by Europe’s 51 GW battery-capacity forecast for 2030.
- Data-centers energy management is connected to a 945 TWh electricity-consumption benchmark by 2030.
- Building decarbonization is connected to the 30% final-energy-consumption share of building operations.
- Commercial EaaS is forecast to reach USD 150.8 billion by 2035, showing long-term demand for outsourced energy management across enterprise customers.
- The customer opportunity index scores commercial buildings at 90/100, data centers at 88/100, industrial facilities at 82/100, healthcare campuses at 76/100, and universities at 72/100.
| Service area | Customer problem | Typical EaaS response |
|---|---|---|
| Energy supply | Price and procurement risk | Managed power contract |
| Efficiency | Waste and high bills | Performance retrofit |
| Renewables | Clean-energy targets | Solar PPA or green contract |
| Storage | Peak demand and backup | Storage-as-a-service |
| Microgrids | Continuity risk | Managed resilience system |
| Software | Weak visibility | Monitoring and optimization |
Data Centers and High-Load Facility Statistics
Data centers deserve special attention because they connect electricity demand, reliability, clean energy procurement, storage, and carbon reporting in one fast-growing customer group. The EaaS opportunity is not limited to cheaper kilowatt-hours. It also includes power-quality management, backup capacity, grid flexibility, heat management, and credible reporting for large technology customers.
High-load benchmarks
- IEA’s Energy and AI data places data-centers electricity consumption at 945 TWh by 2030, increasing the need for cleaner, more reliable power strategies.
- Data-centers electricity demand is linked to a 15% CAGR from 2024 to 2030.
- Data centers may account for about 3% of global electricity in 2030.
- U.S. data-centers electricity consumption could increase by 240 TWh by 2030.
- The U.S. data-centers electricity increase is also expressed as 130% growth, which makes power availability and service-based energy management more important for large digital infrastructure users.
- China data-centers electricity use could increase by 175 TWh by 2030, equal to about 170% growth.
- Europe data-centers electricity use could increase by 45 TWh by 2030.
- Japan and South Korea are smaller in absolute data-centers load growth than the United States and China, but they remain important because reliability and energy efficiency are high priorities.
| High-load customer | EaaS need | Why it matters |
|---|---|---|
| Data centers | Reliable clean power | Uptime and carbon reporting |
| Manufacturing | Peak control and continuity | Output and cost protection |
| Hospitals | Backup and compliance | Critical services |
| Universities | Campus optimization | Large multi-building loads |
| Warehouses | Solar, lighting, controls | Repeatable portfolio upgrades |
Policy, Incentives, and Regulation Statistics
Policy does not create the entire EaaS market, but it shapes the speed and confidence of adoption. Incentives, building-performance standards, efficiency directives, public-procurement rules, grid-interconnection processes, carbon-reporting requirements, and clean-energy targets all affect whether customers can justify long-term service agreements.
Policy and compliance benchmarks
- Clean-energy investment accounts for about 66.7% of total energy investment in the 2025 IEA investment outlook.
- Efficiency investment needs to roughly triple to align with the NZE pathway, according to IEA efficiency-investment data.
- Europe’s building renovation and efficiency agenda makes performance services more relevant for public and commercial building portfolios.
- North America’s public-sector performance-contracting base gives EaaS providers a more mature route into schools, universities, hospitals, and government estates.
- Asia-Pacific policy signals differ sharply by country, so China’s industrial scale, India’s efficiency programs, Japan’s resilience concerns, and Australia’s distributed energy market should be analyzed separately.
- Latin America’s renewable resource base is strong, but financing structures and contract bankability often determine whether projects become service contracts.
- The Middle East has strong solar resources and national transition plans, while Africa’s EaaS opportunity is often tied to reliability, access, and distributed power economics.
- Grid interconnection and permitting remain important adoption bottlenecks because policy support does not guarantee fast project completion.
| Policy lever | What it affects |
|---|---|
| Efficiency rules | Retrofit demand |
| Clean-energy incentives | Project economics |
| Public procurement | Contract access |
| Carbon reporting | Customer urgency |
| Interconnection reform | Project timing |
| Building standards | Portfolio compliance |
Provider Economics and Delivery Capacity
EaaS statistics should also be read from the provider side. Market demand is useful only if providers can finance assets, win customers, install equipment, manage contractors, monitor performance, and maintain service quality over many years. Growth can stall when project pipelines expand faster than engineering, financing, M&V, and operations capacity.
Provider-side signals
- Customer acquisition cost is a key metric because long sales cycles can reduce the profitability of service contracts.
- Contract length matters because providers need enough revenue visibility to finance equipment and operations.
- Project payback matters because even service contracts must create an economic logic for customers, providers, and financiers.
- M&V accuracy matters because disputed savings can damage customer trust and reduce renewal opportunities.
- Provider capacity matters most in regions where energy demand is strong but skilled contractors, energy auditors, or project-finance partners are limited.
- Asset maintenance quality matters because uptime, comfort, and savings depend on long-term performance, not only installation quality.
- Carbon reduction is becoming a provider metric because customers increasingly need auditable climate and compliance reporting.
- Regional adoption should be tracked because a service model that works in a U.S. campus may need different finance, ownership, and operational rules in India, Brazil, or South Africa.
| Provider metric | Why it matters |
|---|---|
| Customer acquisition cost | Tests sales efficiency |
| Contract length | Supports financing |
| Project payback | Confirms economic logic |
| M&V accuracy | Protects trust |
| Maintenance quality | Sustains outcomes |
| Renewal rate | Shows service value |
How to Use EaaS Statistics Without Creating a Stat Dump
EaaS statistics should work as evidence, not decoration. Market size, clean-energy investment, ESCO investment, renewable capacity, building energy use, data-centers load, storage capacity, country demand, and financing barriers all answer different business questions. Grouping them clearly keeps the article useful rather than mechanical.
Statistical storytelling rules
- Use market-size figures to explain commercial scale, but do not use them as the only proof of adoption.
- Use ESCO investment and average savings data to explain why performance-based contracts are credible in some markets and harder in others.
- Use clean-energy investment and renewable capacity additions to explain why more customers can procure clean power through service structures.
- Use buildings data to explain why EaaS has a large addressable base in HVAC, lighting, controls, electrification, solar, and storage.
- Use data-centers electricity figures to show where energy management, clean procurement, and reliability become strategic rather than optional.
- Use regional opportunity scores to avoid treating global averages as market reality.
- Use country-level data to show adoption conditions such as demand growth, renewable resources, public-sector contracts, storage needs, and reliability pressure.
- Use barriers and contract data to explain why an attractive technical project may still stall in procurement, finance, legal review, interconnection, or M&V design.
| Statistic type | Best use in article | Avoid |
|---|---|---|
| Market size | Frame scale and forecast | Do not treat as adoption proof |
| ESCO savings | Explain performance trust | Do not overgeneralize every building |
| Renewables | Show clean-power supply base | Do not ignore interconnection |
| Buildings | Show demand-side opportunity | Do not reduce to one sector |
| Regional data | Explain market differences | Do not use one global average |
| Barriers | Explain adoption friction | Do not blame technology only |
Customer Decision Framework for EaaS Adoption
Energy buyers do not adopt EaaS only because a market report shows growth. They adopt it when their own operating conditions make service-based energy delivery more attractive than direct ownership. A practical decision framework should translate the article’s statistics into customer triggers: high bills, old equipment, emissions pressure, budget limits, resilience needs, or a lack of internal technical capacity.
Decision triggers worth measuring
- A customer with rising electricity bills may evaluate efficiency and demand management before committing to new generation assets.
- A customer with capital constraints may prefer a service agreement because it avoids a large upfront purchase and spreads cost across operating budgets.
- A customer with an emissions target may prioritize renewable procurement, electrification, building controls, and carbon reporting.
- A customer with unreliable power may value storage, backup generation, microgrids, and energy management software more than simple tariff savings.
- A customer with many sites may need portfolio-level analytics to identify which buildings should be upgraded first.
- A customer with public-sector constraints may need an ESCO-style contract structure that ties repayment to verified savings.
- A customer with fast-growing load, such as a data centers or logistics operator, may need power planning, grid coordination, and clean procurement in one service package.
- A customer with weak energy data may need metering and monitoring before any long-term performance guarantee becomes credible.
| Customer trigger | Likely EaaS response | Useful metric |
|---|---|---|
| High bills | Efficiency and optimization | Savings rate |
| Capex limits | Service financing | Contract length |
| Carbon target | Renewables and reporting | Emissions reduction |
| Outage risk | Storage or microgrid | Uptime / backup hours |
| Portfolio complexity | Analytics and prioritization | Site-level benchmark |
| Weak data | Metering and M&V | Baseline quality |
Sector-by-Sector EaaS Opportunity Signals
Sector-level analysis also matters because the same service model does not create value in the same way everywhere. A university campus, manufacturing facility, hospital, retailer, warehouse, and data centers may all buy EaaS, but each one measures success differently. That is why sector indicators are useful before the diagnostic section.
Sector opportunity benchmarks
- Commercial buildings score 90/100 in the opportunity index because they offer repeatable efficiency, controls, HVAC, solar, and storage opportunities.
- Data centers score 88/100, reflecting high electricity demand, uptime pressure, and clean-power procurement needs.
- Industrial facilities score 82/100, which reflects energy intensity, process reliability, and decarbonization pressure.
- Healthcare campuses score 76/100 because backup power, comfort, compliance, and energy cost all matter at the same time.
- Logistics warehouses score 73/100, supported by lighting, rooftop solar, fleet charging, and demand management.
- Universities score 72/100, helped by campus-scale loads and long-term planning horizons.
- Municipal buildings score 70/100, often supported by public-sector contracting and community decarbonization targets.
- Retail portfolios score 68/100, where EaaS can support multi-site efficiency, solar, controls, and energy visibility.
| Sector | Main value driver | Best EaaS fit |
|---|---|---|
| Commercial buildings | Cost and comfort | Efficiency plus controls |
| Data centers | Uptime and clean power | Managed power and storage |
| Industrial facilities | Cost and continuity | Efficiency and resilience |
| Hospitals | Reliability and compliance | Microgrid and backup |
| Warehouses | Lighting and rooftop space | Solar and demand management |
| Universities | Campus planning | Performance contracts |
EaaS Market Growth Bottleneck Diagnostic
A polished EaaS statistics article should help a team decide where to look next. The most useful framework connects statistics to the commercial and operational bottlenecks that determine whether a service model can scale.
| Problem area | Core signals | Benchmark |
|---|---|---|
| Demand | Energy costs, carbon targets, building load | Customer pressure |
| Capital access | Capex limits, financing terms | Adoption readiness |
| Project delivery | ESCO capacity, contractors | Execution strength |
| Performance proof | M&V, metering, baseline quality | Trust in savings |
| Clean supply | Solar, storage, PPAs | Decarbonization potential |
| Resilience | Outage risk, backup needs | Reliability value |
| Policy support | Incentives, mandates, efficiency rules | Structural demand |
| Regional maturity | Country adoption and contract norms | Scale potential |
90-Day EaaS Benchmark Plan
Statistics become useful when they are translated into a measurement cycle. A practical EaaS market review can be organized into a 90-day cycle that compares market demand, financing, project delivery, performance verification, and regional readiness.
| Timing | Action | Output |
|---|---|---|
| Days 1-30 | Capture baseline by energy cost, building type, region, asset age, emissions target, and contract model. | Clear map of where EaaS demand is strongest. |
| Days 31-60 | Compare efficiency, renewables, storage, software, financing, and resilience opportunities. | Short list of high-confidence service opportunities. |
| Days 61-90 | Review provider capacity, M&V quality, customer credit, policy support, and project bankability. | Repeatable EaaS market scorecard. |
Metrics EaaS Market Leaders Should Track
The final scorecard should be detailed enough to locate the market bottleneck without becoming a vanity dashboard. These metrics provide a useful minimum set for service providers, facility owners, utilities, investors, and energy managers.
| Metric | Why it matters |
|---|---|
| EaaS market size | Measures commercial scale |
| CAGR | Tracks growth pace |
| ESCO investment | Signals performance-contracting strength |
| Energy savings | Measures customer value |
| Contract length | Shows revenue visibility |
| Project payback | Tests financial viability |
| Renewable capacity installed | Tracks clean-energy delivery |
| Storage capacity | Measures resilience and flexibility |
| Building electricity use | Shows addressable demand |
| Customer acquisition cost | Tests provider economics |
| M&V accuracy | Builds trust in savings |
| Carbon reduction | Supports compliance reporting |
| Regional adoption | Shows where growth is concentrated |
Energy as a Service Market Statistics FAQ
Common questions
What is Energy as a Service?
Energy as a Service is a model where customers buy energy outcomes instead of owning and managing every energy asset directly. It can include efficiency retrofits, solar, storage, microgrids, software, maintenance, monitoring, and performance guarantees. The customer usually pays through a service, PPA, savings, or subscription structure rather than funding all equipment upfront.
How big is the Energy as a Service market?
The core forecast places the global EaaS market at USD 51.88 billion in 2024 and about USD 100.34 billion by 2030. That makes it a sizable energy-transition service category rather than a narrow financing niche.
How fast is the EaaS market growing?
The forecast path nearly doubles between 2024 and 2030. The commercial EaaS series also grows from USD 67.30 billion in 2025 to more than USD 100 billion by 2030, showing strong demand in commercial buildings and C&I energy services.
What drives EaaS adoption?
The main drivers are energy-cost pressure, capex avoidance, decarbonization targets, aging buildings, renewable procurement, resilience, and the need for measurable savings. Data-centers load growth, building electrification, and storage demand add further pressure.
Which region leads the EaaS market?
North America and Europe are strong structured-service markets because of ESCO activity, corporate renewables, public-sector contracting, renovation policy, and mature financing structures. Asia-Pacific is also important because China, India, Japan, Australia, and Southeast Asia create large but different service opportunities.
How is EaaS connected to ESCOs?
ESCOs are important because they prove the performance-contracting logic behind EaaS. Global ESCO investment reached about USD 42 billion in 2024, and many ESCO projects target 20-30% savings relative to baseline consumption.
Why do companies use EaaS instead of owning energy assets?
Companies often use EaaS to avoid upfront capital expenditure, transfer performance risk, simplify maintenance, access cleaner energy, and improve resilience. The model is attractive when the provider can deliver measurable savings or reliability outcomes more efficiently than the customer could alone.
What role do renewables play in EaaS?
Renewables are a major part of the EaaS opportunity. IRENA reports 692 GW of renewable capacity additions in 2025, including 511 GW of solar. Solar PPAs, storage services, and clean-power procurement are common ways to structure renewable EaaS.
Why are buildings important for EaaS?
Buildings account for 30% of final energy consumption and 26% of energy-related emissions. They also contain HVAC, lighting, controls, solar, storage, and heat-pump opportunities, which makes them suitable for service-based performance contracts.
What are the biggest barriers to EaaS adoption?
he biggest barriers are contract complexity, savings uncertainty, limited customer credit quality, grid interconnection delays, split incentives, data gaps, and internal approval challenges. These issues can slow projects even when the technical case is strong.
How does software support EaaS?
Software supports EaaS by monitoring assets, verifying savings, optimizing consumption, forecasting load, reporting carbon impact, and enabling demand response. Without data, it is difficult to prove that the provider is delivering the promised energy outcome.
What is the outlook for EaaS by 2030?
The outlook is positive because energy buyers face rising electricity demand, clean-energy investment, efficiency needs, and resilience pressure. The market is projected to reach about USD 100.34 billion by 2030, while commercial EaaS continues scaling beyond that point.
Final Takeaway
Energy as a Service statistics point to one conclusion: the market is becoming a full energy-performance system, not only a financing option. The strongest EaaS markets combine high energy-cost pressure, aging building infrastructure, clean-energy demand, performance contracting, software-based monitoring, customer financing, and policy support.
Headline growth figures are important, but they do not tell the whole story. The EaaS market grows when customers have clear, practical reasons to outsource their energy responsibilities, such as reducing capital costs, achieving measurable savings, accessing cleaner power, improving resilience, simplifying carbon reporting, or streamlining operations. For this reason, factors such as ESCO investment, clean-energy financing, building energy consumption, data-center demand, renewable capacity, and storage expansion should be considered together. Even specialized tools and resources, such as a photography invoice template for managing creative business expenses, reflect the broader shift toward efficient and streamlined operations.
For service providers and energy buyers, the next step is a scorecard review. Measure energy cost, building load, emissions targets, asset age, financing capacity, M&V readiness, contract bankability, provider capability, and regional policy support. The strongest EaaS strategies turn market demand into repeatable service structures that protect cost, carbon, comfort, continuity, and capital.


