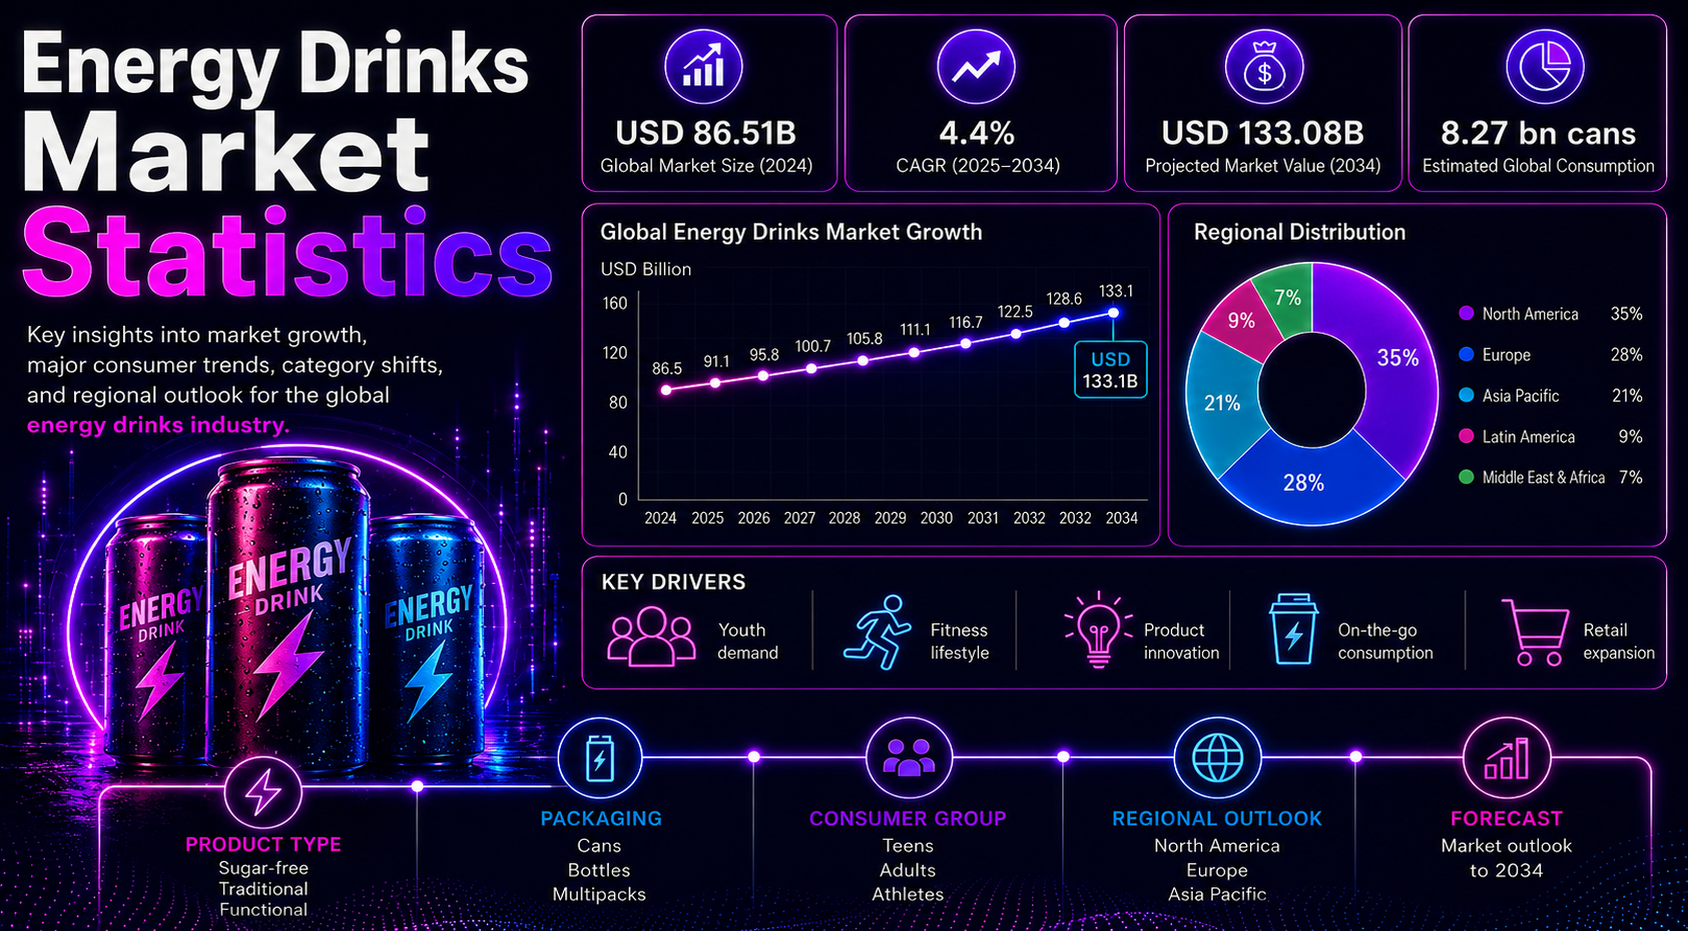
Energy drinks are best understood as a system of occasions rather than a single shelf category. The same can may support a commute, workout, study session, late shift, or gaming session, so the market needs to be read through use case as well as revenue.
A practical market view starts with the forecast, then asks what is changing: product format, sugar profile, retail channel, consumer group, brand power, and regulation.
Energy drinks have moved from a narrow caffeine niche into a global functional beverage category. The market now sits across convenience retail, sports nutrition, gaming culture, study and work routines, sugar-free reformulation, and premium lifestyle branding. That makes the category more complex than a simple soft-drink segment. A can may be bought as an impulse item at a gas station, as a gym-focused performance drink, as a zero-sugar alternative to soda, or as a digital-culture brand connected to creators and esports.
The strongest statistics show why the category deserves its own scorecard. Grand View Research places the global energy drink market at USD 85.25 billion in 2025 and projects USD 158.53 billion by 2033. Fortune Business Insights reports a separate global path from USD 83.31 billion in 2026 to USD 157.21 billion by 2034. North America remains one of the largest revenue bases, the United States is a major country market, and Asia-Pacific is repeatedly identified as a key growth region.
Executive Energy Drinks Benchmarks
The executive statistics work best as a market map. High forecast values show durable demand, but the sharper signal comes from how growth is split across channels, sugar-free products, functional positioning, and regional behavior.
The most useful benchmark is the combination of growth, channel behavior, consumer occasions, and regulation. Those signals explain why two markets with similar revenue can require very different product and retail strategies.
For that reason, the best statistics are grouped by business question: who buys, where they buy, which formats are gaining share, and what could slow the category down.
The numbers that define the energy drink market
• Grand View Research estimates the global energy drinks market at USD 85.25 billion in 2025, setting a strong current baseline for a category that is still expanding beyond traditional soft drinks.
• Grand View Research forecasts the market will reach USD 158.53 billion by 2033, showing that energy drinks still have room to grow through product reformulation, wider retail reach, and international demand.
• The same forecast series places growth at an 8.1% CAGR from 2026 to 2033, giving brands a clear reason to plan beyond short-term flavor cycles.
• Fortune Business Insights places the global market at USD 83.31 billion in 2026, which keeps the category in the same broad range as other major market estimates.
• Fortune projects global energy drinks revenue of USD 157.21 billion by 2034, pointing to a long growth runway rather than a short-term trend cycle.
• Fortune reports an 8.26% CAGR for 2026 to 2034, suggesting that growth is expected to remain steady even as mature markets become more competitive.
• North America is valued at USD 27.38 billion in 2025 in the Fortune regional series, making it a large mature market where innovation, shelf space, and brand loyalty matter.
• The U.S. market is valued at USD 22.15 billion in 2025 in the same data set, showing why American convenience retail and fitness-positioned brands carry outsized influence.
• Europe is valued at USD 22.01 billion in 2025 and is forecast at 8.71% CAGR through 2034, combining mature beverage habits with ongoing low-sugar reformulation.
• Precedence Research estimates the global 2025 market at USD 86.18 billion and projects USD 188.83 billion by 2035, giving the category a higher long-range growth view.
• Fact.MR identifies convenience stores as the leading distribution channel segment, a reminder that many purchases still happen at the exact moment consumers want energy.
• Fact.MR Europe reports 68.4% conventional product share and 38.6% athletes/fitness target-consumer share, showing how legacy formulas and fitness-led positioning now sit side by side.
• CDC material notes that 30%–50% of adolescents are reported to consume energy drinks, keeping youth exposure and responsible marketing in the policy discussion.
• FDA cites 400 mg/day as a daily caffeine amount not generally associated with negative effects for most adults, making caffeine disclosure and serving size important to market trust.
Why Energy Drinks Now Carry Global Beverage-Market Stakes
Small category shifts matter because energy drinks already sit in a tens-of-billions-dollar revenue pool. A modest change in sugar-free share, channel mix, or regional penetration can move large sales pools. In practical terms, cold-vault placement, multipack strategy, caffeine level, brand sponsorship, and repeat purchase frequency can all become meaningful growth levers.
The category also influences adjacent markets. It competes with soft drinks for flavor, coffee for alertness, sports drinks for performance, and functional beverages for ingredient-led benefits.
Energy drink statistics become useful when they connect market size to real buying occasions. The benchmarks below show how brand planning, retail space, product reformulation, and regional opportunity fit together.
Market-scale and beverage-growth benchmarks
• Several current global estimates place the market above USD 80 billion, which gives brands a large base for flavor innovation, channel expansion, and sugar-free growth.
• Grand View Research shows the category adding more than USD 73 billion between 2025 and 2033.
• Fortune Business Insights shows a similar expansion of almost USD 74 billion from 2026 to 2034.
• Research and Markets projects the market from USD 78.02 billion in 2025 to USD 104.00 billion by 2030.
• Technavio expects USD 57.2646 billion in incremental global market growth from 2026 to 2030.
• Precedence Research projects a longer-range market value of USD 188.83 billion by 2035, showing how larger definitions of the category can produce a more aggressive outlook.
• Convenience stores are identified as a key distribution channel, showing the role of impulse and single-serve demand.
• Celsius reported 22% retail sales growth in 2024, showing how fitness-positioned energy can outperform inside the wider category.
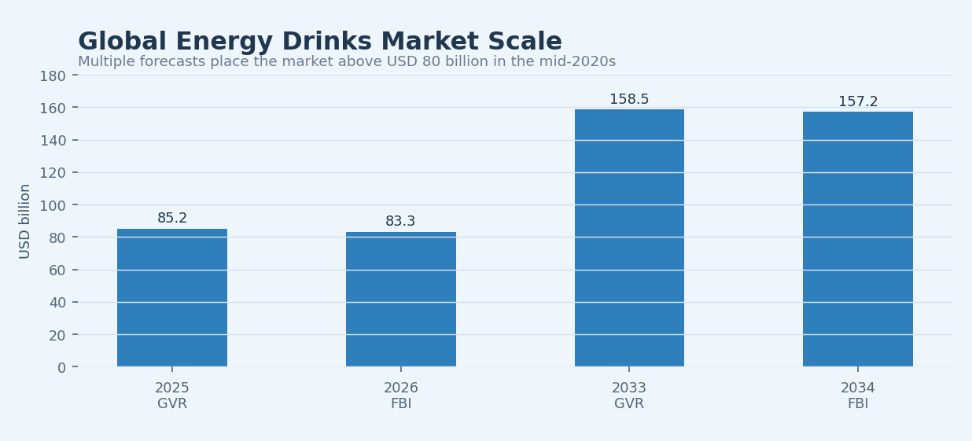
Figure 1. Category growth is best reviewed alongside functional demand because the category now competes across convenience, sports nutrition, gaming, and wellness-positioned beverages.
Global Energy Drinks Market Size and Forecast
Forecasts need careful reading because category definitions vary. Some sources focus on classic energy drink cans, while others include wider functional energy beverages, shots, or adjacent ready-to-drink formats.
CAGR is a forecast signal, not a guarantee. Actual growth depends on retailer support, consumer trust, ingredient costs, local regulation, pricing power, and product innovation. A market can grow in value even when volume slows if premium products, multipacks, or higher-priced functional formulas gain share, so value growth and volume growth need to be read separately where possible.
Market-size forecasts give the first view of momentum; the stronger interpretation comes from comparing those forecasts with channel growth, product reformulation, and regional demand.
Market-size and forecast benchmarks
• Grand View Research reports USD 85.25 billion for 2025 and USD 158.53 billion for 2033, giving the article a high-growth forecast series for the global category.
• Fortune Business Insights reports USD 83.31 billion for 2026 and USD 157.21 billion for 2034, creating a similar long-term view from a different source base.
• Research and Markets reports USD 78.02 billion for 2025 and USD 104.00 billion for 2030, offering a more conservative five-year forecast window.
• Precedence Research reports USD 86.18 billion for 2025 and USD 188.83 billion for 2035, showing the upper end of the long-range forecast set.
• Technavio expects 8.9% CAGR from 2026 to 2030.
• North America is estimated at USD 27.38 billion in the Fortune 2025 regional series, supported by convenience retail, premium brands, and fitness-oriented products.
• Europe is estimated at USD 22.01 billion in the Fortune 2025 regional series, with regulation, low-sugar demand, and mature retail channels shaping growth.
• The U.S. market is estimated at USD 22.15 billion in 2025, making it a major single-country market.
| Market scope | Current benchmark | Forecast benchmark | Market signal |
|---|---|---|---|
| Global market (GVR) | 2025: USD 85.25B | 2033: USD 158.53B | 8.1% CAGR |
| Global market (FBI) | 2026: USD 83.31B | 2034: USD 157.21B | 8.26% CAGR |
| North America | 2025: USD 27.38B | Mature regional base | Large retail market |
| Europe | 2025: USD 22.01B | Premium reformulation | Health-led demand |
| United States | 2025: USD 22.15B | Large country market | Strong innovation |
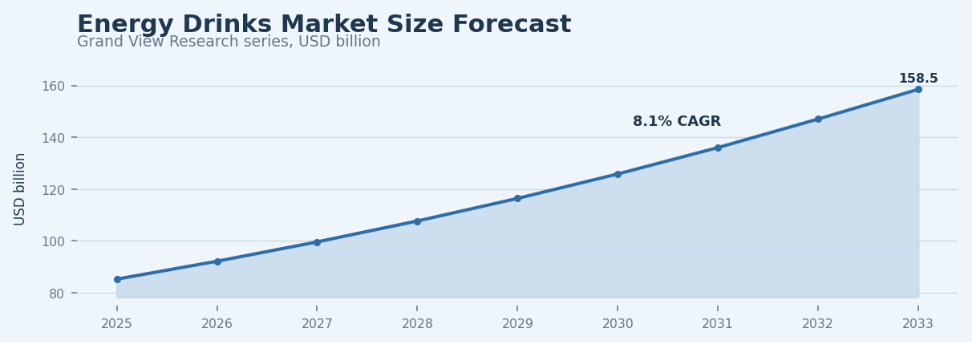
Figure 2. Energy drink forecasts vary by source, but the consistent direction is growth from convenience consumption, sugar-free innovation, fitness positioning, flavor expansion, and international retail penetration.
Where Energy Drink Demand Starts Building
Demand-driver analysis turns a market forecast into practical questions. Is the consumer buying for immediate alertness, workout support, flavor, low sugar, brand identity, or convenience? Each reason points to a different product and channel decision.
Demand also needs to be separated into new users, substitution, and trade-up behavior. Some growth comes from first-time buyers, some from consumers switching away from soda, coffee, sports drinks, or high-sugar formulas, and some from existing users buying more often or paying more for premium lines.
Total value is only the headline. Real demand starts in specific situations: study, work, travel, fitness, gaming, nightlife, events, and retail impulse moments.
Demand drivers worth separating
• Convenience demand is central because convenience stores are identified as a leading channel segment.
• Fitness demand is visible in Europe, where 38.6% target-consumer share is linked to athletes and fitness users in Fact.MR data.
• Zero-sugar and reduced-sugar reformulation remain major growth signals in Europe and North America.
• Gaming and esports are frequently cited as U.S. category support factors, especially for younger buyers, making the signal easier to use.
• Functional beverage positioning connects energy drinks with focus, performance, vitamins, and lifestyle claims, giving brands a way to grow without relying only on traditional high-sugar formulas.
• Flavor rotation helps brands protect repeat purchase in a crowded retail shelf environment.
• Premium positioning allows brands such as Red Bull, Monster, and Celsius to compete beyond basic caffeine delivery, keeping responsible use central.
• Health scrutiny forces brands to manage caffeine, sugar, label clarity, and responsible marketing, keeping responsible use central.
| Demand type | Primary metric | Likely market owner |
|---|---|---|
| Convenience demand | C-store sales and single-serve volume | Retailers and beverage brands |
| Fitness demand | Gym, sports, and active-lifestyle usage | Sports nutrition and brand teams |
| Sugar-free demand | Zero-sugar share and repeat purchase | Product and reformulation teams |
| Gaming and nightlife | Youth engagement and sponsorship reach | Marketing and partnerships |
| Functional positioning | Ingredient claims and repeat purchase | Innovation and R&D teams |
Product Formats: Cans, Shots, Powders, and Functional Energy
Product format determines where the drink fits into the day. Cans are visible, easy to chill, and ideal for impulse purchase, while shots, powders, and functional formats serve more specific needs.
These formats do not work the same way economically. A can depends heavily on cold storage, shelf space, and high-velocity retail. A powder depends more on repeat purchase, fitness routines, and ecommerce. A premium natural drink may have lower velocity but stronger positioning value. Those differences affect pricing, promotion, distribution, and inventory planning.
Product format shapes how consumers use energy drinks. Ready-to-drink cans dominate shelf visibility and impulse behavior, while shots, powders, and natural or functional beverages expand the category into specific use cases. A buyer who wants a chilled can at a gas station behaves differently from a fitness consumer buying a multipack online.
Product-format benchmarks
• Fact.MR names carbonated as the leading product type segment in its global view, making the signal easier to use.
• Fact.MR Europe reports 68.4% conventional product share for the region, showing that classic energy formulas still hold a large base even as reformulation expands.
• Ready-to-drink cans remain the category anchor because they fit cold vaults, gas stations, gyms, and single-serve purchases.
• Energy shots serve a smaller but intense-use occasion where speed and portability matter most.
• Powders and mixes overlap with fitness, supplements, and at-home consumption rather than pure impulse retail, so they expand the category into planned-use occasions.
• Natural and organic energy drinks support better-for-you positioning and premium pricing, making the signal easier to use.
• Functional energy drinks add claims around focus, hydration, vitamins, and performance, giving brands a way to grow without relying only on traditional high-sugar formulas.
• Pack-size strategy matters because single cans, multipacks, and subscriptions signal different buying missions.
| Product type | Main use case | Market direction |
|---|---|---|
| Ready-to-drink cans | Convenience and impulse purchase | Core market format |
| Energy shots | Fast caffeine delivery | Niche but high-intensity usage |
| Bottled energy drinks | Larger serving and hydration crossover | Selective channel demand |
| Powders and mixes | Fitness and at-home use | Growth with sports nutrition |
| Natural/organic energy drinks | Better-for-you positioning | Premium niche growth |
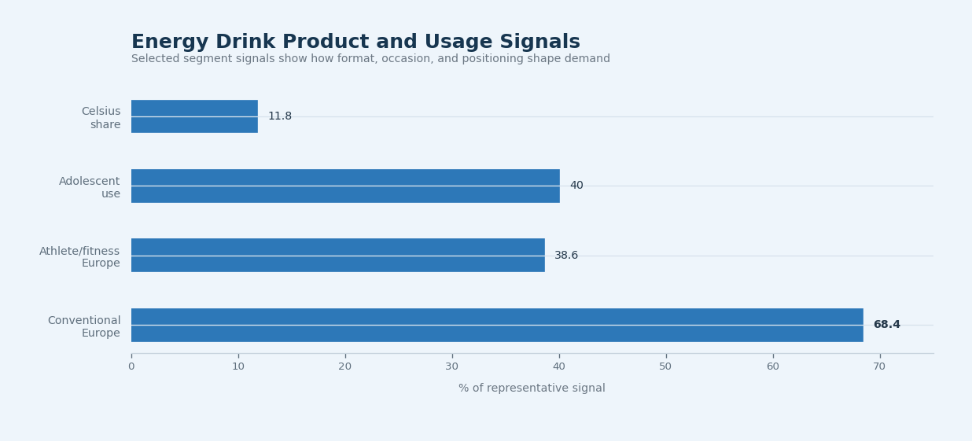
Figure 3. Product and usage signals show why energy drinks need to be measured by format, consumer occasion, and positioning rather than one blended market share.
Sugar-Free and Functional Energy Drink Growth
Sugar-free growth is one of the clearest examples of how the category adapts to consumer pressure. Many buyers still want caffeine, flavor, and brand identity, but they are less willing to accept old high-sugar assumptions. This creates an opening for products that promise energy with fewer calories, cleaner labels, or performance cues. It also gives legacy brands a way to protect their user base as health expectations change.
Functional ingredients create another layer of differentiation, but they must be handled carefully. Claims around focus, hydration, mood, endurance, vitamins, or natural caffeine can help a product stand out, but unclear or exaggerated claims can damage trust. The strongest brands use functional positioning to explain the product occasion without making the drink feel like an unsafe stimulant or an overclaimed supplement.
Sugar-free and functional positioning is one of the most important shifts in the category. Older energy drink demand was often associated with high sugar and strong caffeine. Newer growth is more nuanced: buyers still want energy, but many also want fewer calories, cleaner labels, natural caffeine, vitamins, hydration cues, or performance-oriented claims.
Sugar-free and ingredient benchmarks
• Fortune Business Insights identifies reduced-sugar reformulation as a growth support factor in Europe.
• FDA cites 400 mg/day as a caffeine amount not generally associated with negative effects for most adults, keeping responsible use central.
• EFSA states that single caffeine doses up to 200 mg do not raise safety concerns for healthy adults, keeping responsible use central.
• EFSA also states daily caffeine intakes up to 400 mg/day do not raise safety concerns for healthy adults.
• EFSA notes that 100 mg of caffeine close to bedtime may affect sleep duration and sleep patterns, keeping responsible use central.
• Natural caffeine supports plant-based, premium, and wellness-oriented positioning, keeping responsible use central.
• B vitamins, taurine, guarana, electrolytes, and nootropic-style claims help brands build functional differentiation.
• Sugar-free lines help legacy brands keep buyers who might otherwise leave for lower-calorie beverages.
| Segment | Common claim | Market meaning |
|---|---|---|
| Regular energy drinks | Energy, taste, caffeine | Strong legacy demand |
| Sugar-free energy drinks | Zero sugar, low calorie | Health-conscious growth |
| Natural caffeine drinks | Plant-based energy | Premium and wellness positioning |
| Fitness energy drinks | Performance, focus, hydration | Sports and gym crossover |
| Functional energy drinks | Focus, mood, vitamins | Ingredient-led innovation |
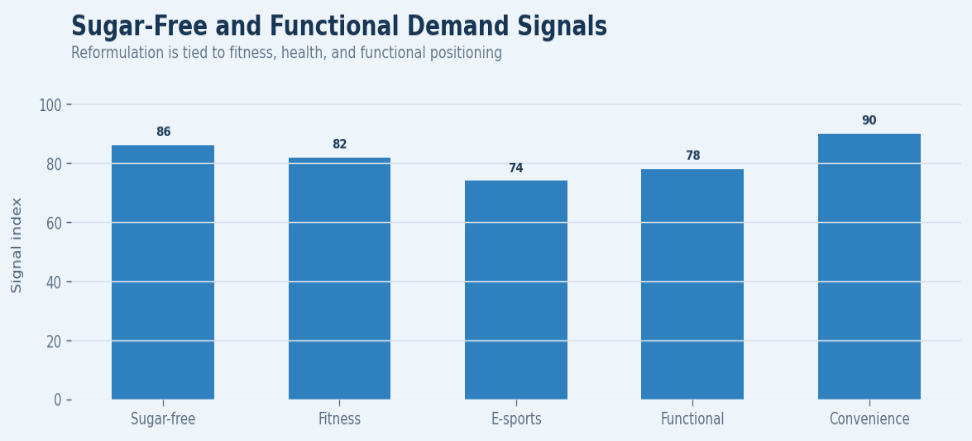
Figure 4. Sugar-free and functional positioning changes the category from simple caffeine delivery into a broader performance and lifestyle beverage market.
Consumer Demographics and Usage Behavior
Consumer behavior is clearer when it is read through occasions and frequency. A broad statistic on adolescent or young-adult consumption is useful, but it does not explain whether the product is used daily, weekly, before workouts, during study periods, while driving, or during gaming. Frequency matters because a small group of heavy users can drive a large share of volume, while occasional users may respond more to flavor, novelty, or promotion.
Demand also needs to be balanced with caution. Energy drinks appeal to younger consumers, and youth consumption is one reason public-health groups watch the category closely. That does not make the entire market risky, but it does make responsible marketing, clear labeling, sensible serving sizes, and age-appropriate positioning part of the long-term business model.
Consumer behavior explains why energy drinks remain resilient even when health scrutiny increases. The category serves many use occasions. Students use energy drinks for alertness, young professionals for workday focus, gamers for long sessions, drivers for travel, gym users for performance, and nightlife consumers for late hours. Each segment responds to a different promise.
Consumer behavior benchmarks
• CDC material says 30%-50% of adolescents are reported to consume energy drinks, keeping responsible use central.
• CDC cites American Academy of Pediatrics guidance that adolescents should not consume energy drinks, keeping responsible use central.
• NCCIH notes about 25% of college students consume alcohol with energy drinks, keeping responsible use central.
• NCCIH reports energy drink-related emergency department visits doubled between 2007 and 2011, keeping responsible use central.
• NCCIH reports 1 in 10 energy drink-related emergency department visits resulted in hospitalization in 2011, keeping responsible use central.
• Fact.MR Europe links 38.6% target-consumer share to athletes and fitness consumers, supporting the link between energy drinks and performance-oriented positioning.
• U.S. demand is supported by fitness culture, esports growth, and broader functional beverage use.
• Consumer frequency should be measured separately from market penetration because heavy users can drive large volume.
| Consumer segment | Main motivation | Market implication |
|---|---|---|
| Students | Alertness and study energy | Strong single-serve demand |
| Young professionals | Workday focus and convenience | Office and retail channel demand |
| Fitness consumers | Performance and endurance | Sports-positioned formulas |
| Gamers | Focus and lifestyle identity | Sponsorship and digital marketing value |
| Health-conscious buyers | Low sugar and cleaner labels | Sugar-free and natural growth |
Retail Channels: Where Energy Drinks Are Bought
Channel strategy plays a crucial role because product availability often influences purchasing decisions. Consumers may not intend to buy an energy drink until they notice a chilled can at a checkout counter, gas station, gym, or campus vending machine. As a result, strong distribution, product availability, and shelf visibility can significantly increase demand by connecting each sales channel with a specific buying occasion. This same focus on convenience and efficiency can be seen in business tools such as an excel invoice template, which helps streamline everyday administrative tasks.
Online retail changes the category in a different way. It supports bulk purchase, variety packs, subscription behavior, specialty flavors, and influencer-led discovery. It does not replace the cold, immediate-use mission that convenience retail serves, so brands need to measure planned and impulse demand separately.
Energy drinks are channel-sensitive because they are often purchased at the moment of need. A cold can near checkout, a gas-station cooler, a gym fridge, a campus vending machine, a multipack at a supermarket, and a subscription case online all represent different missions. The channel tells the brand what the buyer is trying to solve.
Channel benchmarks
• Fact.MR identifies convenience stores as the leading distribution channel segment, which fits the category’s strong on-the-go and single-serve purchase behavior.
• Convenience stores and gas stations support immediate-consumption demand and cold-vault visibility.
• Supermarkets and hypermarkets support multipack buying, price promotions, and household replenishment.
• Online retail supports variety, bulk orders, specialty flavors, and subscription behavior.
• Gyms, campuses, events, and vending machines help brands connect with specific consumer occasions where sampling and repeat purchase can build loyalty.
• Quick commerce can expand access when consumers want chilled beverages without a store visit, especially in dense urban markets.
• Retail shelf space remains a competitive barrier because energy drinks compete with soda, water, sports drinks, coffee, and functional beverages.
• Channel strategy should be measured by purchase occasion, pack size, repeat rate, and margin quality.
| Channel | Why it matters | Market signal |
|---|---|---|
| Convenience stores | Impulse and single-serve buying | Core energy drink channel |
| Supermarkets | Multipack and household buying | Price and promotion sensitivity |
| Gas stations | Travel and workday consumption | Strong on-the-go demand |
| Online retail | Variety, subscription, bulk buying | Growing discovery channel |
| Gyms/events | Lifestyle positioning | Brand association and sampling |
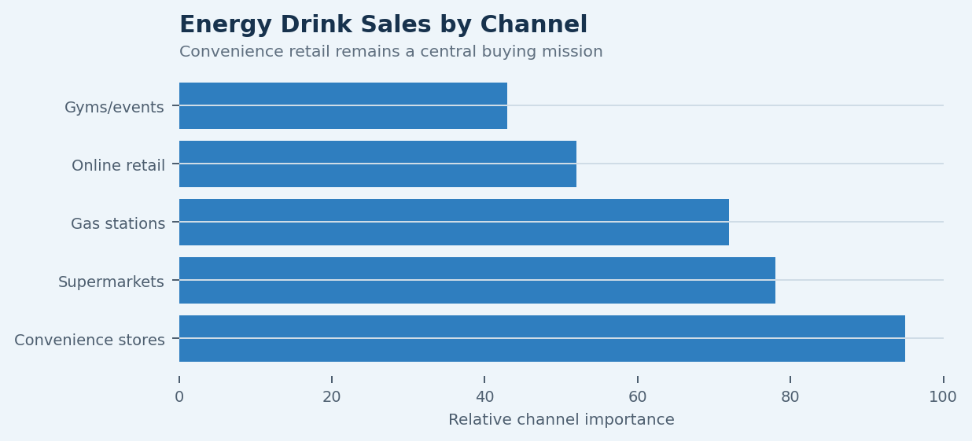
Figure 5. Energy drink sales is best reviewed by channel because convenience, bulk purchase, fitness, events, and online discovery all represent different buying missions.
Regional Energy Drinks Market Intelligence
Regional analysis matters because energy drinks are not consumed the same way everywhere. North America is shaped by convenience retail, premium brands, fitness positioning, and strong competition. Europe brings stronger health scrutiny and sugar reduction. Asia-Pacific is driven by urbanization, local brands, and functional beverage traditions as much as by global brand presence.
Latin America and the Middle East and Africa also matter. They have different income levels, retail structures, climate patterns, and brand-access challenges, but those differences can create opportunity. Hot climates, young populations, urban growth, and expanding modern retail can support demand when pricing and distribution are realistic.
Regional data is one of the highest-value parts of an energy drink market review. Global averages hide large differences in caffeine regulation, sugar taxes, convenience retail, youth demographics, brand portfolios, income levels, and flavor preferences. A successful energy drink strategy in the United States may not transfer directly to Germany, India, China, Brazil, or the Gulf markets.
North America
North America is a large, mature, and innovation-heavy energy drink base. Fortune Business Insights places the region at USD 27.38 billion in 2025, while Market Data Forecast places North America at USD 28.32 billion in 2025 and USD 30.37 billion in 2026. Precedence Research estimates North America at USD 32.75 billion in 2025 and projects USD 72.70 billion by 2035. The region is shaped by convenience retail, fitness products, sugar-free growth, and intense competition among Monster, Red Bull, Celsius, and other brands.
Europe
Europe is mature but diverse. Fortune Business Insights estimates Europe at USD 22.01 billion in 2025 with 8.71% CAGR from 2026 to 2034. Market Data Forecast Europe estimates USD 24.95 billion in 2025, USD 26.74 billion in 2026, and USD 46.53 billion by 2034. Health scrutiny, sugar reduction, and country-level retail behavior are important because Europe has a more fragmented regulatory and consumer environment.
Asia-Pacific
Asia-Pacific is frequently identified as a leading or high-growth region because of urbanization, young consumers, local brands, convenience retail expansion, and functional beverage traditions. Polaris Market Research names Asia Pacific as the largest regional revenue share in 2025. China is notable because Eastroc functional beverage share moved from 15% in 2021 to 26.3% in 2024, showing how local competition can reshape national demand.
Latin America
Latin America is shaped by youth culture, urban retail, affordability, sports, nightlife, and local brand competition. Brazil and Mexico are the most important country discussions because they combine large populations with growing modern retail and beverage brand activity. The region is best measured by price tiers, distribution depth, and local taste fit.
Middle East and Africa
The Middle East and Africa combine young populations, hot climates, urban beverage demand, and uneven distribution. Gulf markets can support premium imports and lifestyle positioning, while African markets often require affordability, availability, and practical packaging strategy. Regulatory and cultural context can also affect caffeine positioning and youth marketing.
| Region | Main demand driver | Market implication |
|---|---|---|
| North America | Convenience retail, fitness, sugar-free demand | Mature but innovative market |
| Europe | Health scrutiny and premium reformulation | Low-sugar and regulated growth |
| Asia-Pacific | Urbanization, youth demand, retail expansion | Fast long-term growth opportunity |
| Latin America | Youth culture and expanding modern retail | Country-specific growth |
| Middle East & Africa | Young population and urban beverage demand | Emerging growth with distribution gaps |
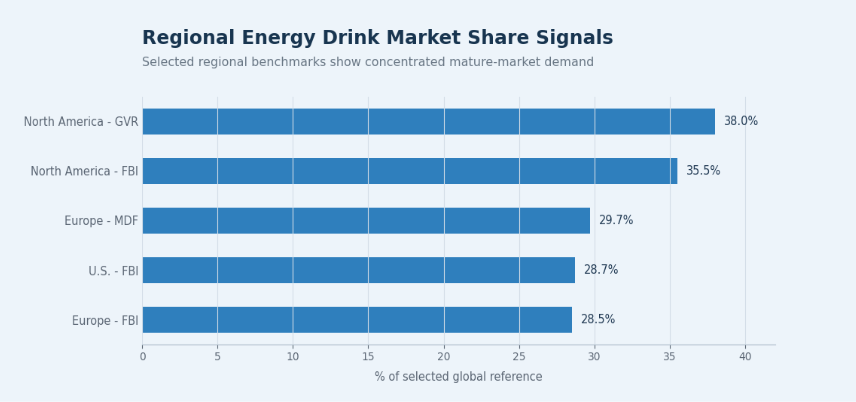
Figure 6. Regional energy drink demand is best measured by channel, regulation, consumer age profile, and local brand competition rather than global averages alone.
Country-Level Energy Drinks Market Statistics
Country-level statistics make the article more useful because they show where the same category behaves differently. The U.S. combines large market value with strong brand innovation and convenience retail. China has major local competitive dynamics. India offers youth and urbanization potential. The U.K. and Germany require closer attention to sugar, caffeine, retail rules, and consumer health expectations. Brazil, Mexico, and Gulf markets add different pricing and availability questions.
Country-level analysis should not assume that a large population automatically means near-term demand. Distribution, income, regulation, local taste, pack size, and retail refrigeration all shape market readiness. A brand entering a country needs to know whether consumers are buying for energy, flavor, fitness, status, affordability, or convenience.
Country-level analysis matters because the energy drink category is heavily localized. Regulations, retail formats, caffeine attitudes, sugar policy, convenience-store networks, local flavors, pricing, and brand availability all vary by country. The strongest country opportunities are not always the largest markets; they are often markets where modern retail, youth demand, and product innovation move together.
• The United States is valued at USD 22.15 billion in 2025 in the Fortune data set, making it one of the most important country markets for brand competition and innovation.
• The U.S. represents about 80.9% of North America in the derived Fortune regional comparison.
• China has visible local brand momentum, with Eastroc share moving from 15% to 26.3% in Reuters-reported data.
• Australia has a manufacturing example where a new canning line can produce 120,000 cans per hour.
• Monster is reported with 40.3% volume share in a cited Australian category context, showing how scale shapes shelf competition.
• Historical U.S. industry concentration data shows Red Bull at 44%, Monster at 33.4%, and PepsiCo at 9.2% in the cited report, showing how scale shapes shelf competition.
| Country | Main market driver | Energy drinks market relevance |
|---|---|---|
| United States | Convenience retail and fitness energy | Large mature market with strong innovation |
| United Kingdom | Health scrutiny and retail penetration | Strong low-sugar and regulatory focus |
| Germany | Mature beverage retail | Stable premium and functional demand |
| China | Urban consumers and RTD growth | Large long-term opportunity with strong local brands |
| India | Youth population and urbanization | Fast emerging demand |
| Japan | Functional beverage culture | Strong product innovation base |
| Brazil | Urban youth and sports culture | Large Latin American opportunity |
| Saudi Arabia | Young consumers and premium retail | Gulf growth market |
Competitive Landscape and Company Statistics
Company statistics show how market growth turns into brand performance. Monster, Red Bull, Celsius, PepsiCo/Rockstar, private label, and local brands do not compete only on caffeine. They compete on distribution, price, flavor, sponsorship, shelf space, packaging, retail relationships, and consumer trust. A smaller brand can grow rapidly if it owns a clear occasion, but it still needs distribution strength to convert awareness into sales.
The competitive landscape is also changing because fitness and functional positioning have made room for newer brands. Celsius is an example of how health-conscious energy can create a distinct lane, while Monster and Red Bull show the advantage of scale and global recognition. Local brands can also win when they understand national flavor preferences, affordability, and retail networks better than global entrants.
Energy drinks are brand-driven, but distribution is just as important as brand image. Large players use shelf visibility, sponsorships, flavor variety, multipacks, convenience channels, and fitness or lifestyle positioning to defend share. Newer challengers use sugar-free formulas, influencer marketing, gym associations, and digital communities to enter a category that still rewards strong retail execution.
Brand and company benchmarks
• Monster Beverage reported USD 7.49 billion in 2024 net sales, showing how scale shapes shelf competition.
• Monster reported 846.7 million 192-ounce case equivalents in energy drink product case sales, showing how scale shapes shelf competition.
• Monster energy drink product case sales increased by 77.4 million cases in 2024, showing how scale shapes shelf competition.
• Monster case sales rose 10.1% in 2024, showing how scale shapes shelf competition.
• Monster Q4 2024 net sales were reported at USD 1.81 billion, showing how scale shapes shelf competition.
• Monster Q4 2024 adjusted gross profit margin was 55.5%, up from 54.5% in Q4 2023.
• Celsius reported USD 1.36 billion in full-year 2024 revenue, showing how scale shapes shelf competition.
• Celsius retail sales increased 22% year over year in 2024, and category share reached 11.8%.
| Company/brand type | Strength | Market implication |
|---|---|---|
| Red Bull | Global brand equity and premium positioning | Category leadership and pricing power |
| Monster | Broad portfolio and distribution scale | Strong retail shelf presence |
| Celsius | Fitness and functional positioning | Rapid growth in health-conscious energy |
| PepsiCo/Rockstar | Large beverage distribution network | Channel reach and portfolio support |
| Private label | Price advantage | Pressure on mainstream brands |
| Local brands | Regional taste and pricing fit | Country-specific competition |
Health, Caffeine, and Regulation Statistics
Health and regulation statistics need careful context because they influence category trust. Adult caffeine guidance provides useful guardrails, but youth consumption, sleep disruption, alcohol mixing, and sugar content still shape how brands communicate the category.
Sugar policy adds another pressure point. Even when demand rises, high-sugar products can face reputational and regulatory limits. That is why zero-sugar portfolios are not just a product trend; they are also a risk-management strategy.
The numbers below separate adult caffeine guidance from youth, sleep, and responsible-use concerns.
Health and regulation benchmarks
• FDA cites 400 mg/day as a caffeine amount not generally associated with dangerous negative effects for most adults.
• EFSA states that single caffeine doses up to 200 mg do not raise safety concerns for healthy adults.
• EFSA also says daily caffeine intakes up to 400 mg/day do not raise safety concerns for healthy adults.
• EFSA notes 100 mg of caffeine close to bedtime may affect sleep duration and sleep patterns.
• CDC guidance says adolescents should not consume energy drinks because the category raises youth-safety concerns.
• CDC material reports 30%-50% of adolescents are reported to consume energy drinks.
• NCCIH notes about 25% of college students consume alcohol with energy drinks.
• Energy drink-related emergency department visits doubled between 2007 and 2011 in NCCIH-cited U.S. data.
| Issue | Why it matters |
|---|---|
| Caffeine level | Affects safety messaging and consumer trust |
| Sugar content | Drives reformulation and sugar-free demand |
| Youth consumption | Increases regulatory scrutiny |
| Labeling rules | Shapes product claims and market access |
| Sugar taxes | Pushes low-sugar product innovation |
| Health concerns | Influences brand positioning and responsible marketing |
Innovation Trends in Energy Drinks
Innovation matters when it changes a buying decision, not only when it adds another claim to a label. A new flavor helps if it increases trial or repeat purchase. A functional ingredient helps if consumers understand the benefit and the product still fits safety, age, and responsible-use expectations.
The most durable innovation is usually a portfolio system. Brands need choices across regular, zero-sugar, premium, fitness, and flavor-led products so they can serve different occasions without weakening the core brand.
Innovation trends worth tracking
• Zero-sugar formulas help the category reach consumers who want energy without high-sugar soft-drink cues.
• Natural caffeine and plant-based positioning support premium, wellness-oriented product lines.
• Functional ingredients let energy drinks overlap with hydration, focus, fitness, and supplement occasions.
• Flavor rotation keeps the shelf fresh and gives existing buyers a reason to try another can.
• Sustainable packaging matters because cans, logistics, and retailer expectations influence brand reputation.
• Multipacks and subscriptions show how the category can move from impulse use into planned consumption.
| Innovation area | What it signals |
|---|---|
| Zero sugar | Health-conscious mainstream demand |
| Natural caffeine | Premium and wellness positioning |
| Functional ingredients | Category overlap with supplements |
| Flavor rotation | Social media and repeat purchase strategy |
| Sustainable packaging | Brand reputation and retailer pressure |
| Multipacks/subscriptions | Shift from impulse to planned consumption |
Market Challenges and Risk Factors
Market challenges are business constraints, not reasons to dismiss the category. Health scrutiny can shift demand toward better labeling and zero-sugar formats. Retail competition increases the importance of strong velocity and promotional efficiency. Ingredient costs do not remove demand, but they affect margins and pricing decisions.
Brand saturation is one of the most practical risks. When many products promise energy, focus, performance, and zero sugar, consumers may struggle to see meaningful differences. This raises the value of clear positioning, distinctive flavor, credible functional claims, and strong distribution. Brands that sound too similar to competitors may need higher marketing spend just to maintain attention.
The market has strong growth signals, but it also faces real constraints. Health scrutiny, caffeine concerns, sugar pressure, retail competition, ingredient costs, aluminum can exposure, brand saturation, and youth marketing criticism can all affect category momentum. Growth forecasts need to be read beside the risks that could slow or redirect demand.
• Caffeine scrutiny may affect claims, age targeting, school access, and responsible marketing requirements, keeping responsible use central.
• Sugar reduction pressure can force reformulation while changing taste expectations, giving brands a way to grow without relying only on traditional high-sugar formulas.
• Retail competition raises the cost of shelf space, promotions, and cold-vault visibility, so growth depends on execution as much as consumer demand.
• Ingredient and aluminum can costs can pressure margins, especially for smaller brands, giving brands a way to grow without relying only on traditional high-sugar formulas.
• Brand saturation makes differentiation harder as more products make similar energy, focus, and performance claims.
• Private-label growth can pressure price, loyalty, and retailer negotiations, especially in supermarket and discount channels.
| Challenge | Why it matters |
|---|---|
| Caffeine scrutiny | May limit claims, age targeting, or product access |
| Sugar reduction pressure | Pushes reformulation and affects taste expectations |
| Retail competition | Makes shelf space and promotion more expensive |
| Ingredient costs | Affects margins and pricing |
| Brand saturation | Raises the cost of differentiation |
| Private-label growth | Pressures price and loyalty |
Energy Drinks Market Demand Diagnostic
The diagnostic table works as a practical checklist. If convenience retail is strong but repeat purchase is weak, the issue may be flavor or price. If sugar-free demand is growing but margins are pressured, the issue may be formulation or promotion. If online sales rise but cold-channel visibility is weak, the brand may be building interest without capturing impulse demand.
A diagnostic view also helps compare brands and regions. One market may need distribution investment, another may need reformulation, another may need local flavors, and another may need stronger compliance language. A single global strategy is unlikely to work across every country. The best analysis connects each demand area to a measurable signal and a practical action.
The useful diagnostic is not only total revenue. It is the mix of convenience retail, sugar-free growth, functional positioning, online demand, regional expansion, and regulatory risk. Each metric points to a specific business question.
| Demand area | Core signal to measure | Market meaning |
|---|---|---|
| Convenience retail | C-store volume and single-serve sales | Shows impulse demand strength |
| Sugar-free growth | Zero-sugar share and repeat purchase | Shows health-positioned demand |
| Functional positioning | Ingredient claims and premium pricing | Shows innovation strength |
| Online channel | Ecommerce sales and subscriptions | Shows planned purchase demand |
| Regional growth | Country-level sales and retail expansion | Shows geographic opportunity |
| Regulation | Caffeine and sugar rules | Shows market-access risk |
90-Day Energy Drinks Market Research Plan
A 90-day research plan keeps the market view practical. The first month builds a clean baseline of market size, forecasts, regional shares, and product formats. The second month compares consumer segments, sugar-free growth, channel mix, and brand performance. The third month reviews regulation, caffeine guidance, country-level behavior, and innovation trends so demand and risk are read together.
This research sequence also prevents teams from over-weighting the most visible data. Company revenue is useful, but it does not explain channel behavior. Caffeine guidance is important, but it does not explain regional growth. Forecasts are necessary, but they do not explain consumer occasions. A staged research process forces each part of the category to be evaluated in context.
| Timing | What to do | Output |
|---|---|---|
| Days 1-30 | Capture market size, forecast, regional share, and product-format data | Baseline market map |
| Days 31-60 | Compare sugar-free growth, consumer demographics, channels, and company performance | Segment opportunity matrix |
| Days 61-90 | Review regulation, caffeine guidance, country-level demand, and innovation trends | Article-ready market framework |
Metrics Energy Drinks Market Analysts Should Track
Metrics are most useful when they support decisions. Global market size frames opportunity, but it is too broad for day-to-day planning. Sugar-free share, channel share, brand revenue, repeat purchase, consumer age group, and caffeine exposure provide more operational insight because they show whether growth is profitable, sustainable, trusted, and aligned with consumer behavior.
Value, volume, and margin need to be compared where possible. A brand can gain value through premium pricing while selling fewer units, or gain volume through promotion while weakening margin. Energy drinks are especially sensitive to this distinction because brand equity, single-serve pricing, multipack discounts, and convenience-store placement all affect profitability.
| Metric | Why it matters |
|---|---|
| Global market size | Shows total category value |
| CAGR | Shows expected growth speed |
| Regional share | Shows where demand is concentrated |
| Country-level sales | Identifies high-opportunity markets |
| Sugar-free share | Tracks reformulation and health-positioned demand |
| Channel share | Shows where purchases happen |
| Brand revenue | Measures competitive strength |
| Consumer age group | Shows demand concentration |
| Caffeine level | Tracks safety and regulatory exposure |
| Repeat purchase | Shows brand loyalty and product fit |
Energy Drinks Market Statistics FAQ
Common questions
• What is the size of the global energy drink market?
Grand View Research places the category at USD 85.25 billion in 2025, while Fortune Business Insights reports USD 83.31 billion in 2026. The spread reflects different market scopes, but both estimates show energy drinks operating as a large global beverage category.
• How fast is the energy drinks market expected to grow?
Most forecasts point to high single-digit growth. Grand View Research projects 8.1% CAGR through 2033, while Fortune Business Insights reports 8.26% CAGR through 2034.
• Which region leads the energy drinks market?
North America remains one of the largest measured regions, with Fortune placing it near USD 27.38 billion in 2025. Asia-Pacific is also a major growth engine because urban consumers, young adults, and modern retail are expanding quickly.
• Why are sugar-free energy drinks growing?
Sugar-free products grow because many buyers still want energy and flavor, but with fewer calories and less sugar. This shift also helps brands respond to health scrutiny, sugar taxes, and everyday wellness expectations.
• Who buys energy drinks the most?
Demand is concentrated around students, young professionals, drivers, gamers, gym users, and active-lifestyle consumers. CDC material notes that 30%-50% of adolescents have been reported to consume energy drinks, which explains why youth-focused marketing receives close scrutiny.
• What channels sell the most energy drinks?
Convenience stores, gas stations, supermarkets, online retail, gyms, campuses, events, and vending all matter. The key difference is buying mission: immediate energy, bulk purchase, fitness use, or product discovery.
• What are the main risks for the energy drinks market?
The main risks are caffeine scrutiny, youth consumption concerns, sugar pressure, ingredient and aluminum costs, shelf competition, brand saturation, and responsible-marketing requirements.
Final Takeaway
The final market lesson is practical: growth must be traced to more users, more frequent use, better retail execution, zero-sugar switching, functional positioning, or regional expansion.
Energy drinks market statistics point to one conclusion: the category is growing because consumers want fast, convenient energy, but the strongest gains now come from products that also solve health, flavor, function, and lifestyle needs.
The most useful view connects five systems: convenience retail, sugar-free and functional innovation, youth and active-lifestyle demand, regional expansion, and caffeine or sugar regulation. A brand can grow quickly when those systems work together, but pressure builds when health concerns, retail costs, or weak differentiation rise.
For beverage brands, retailers, distributors, and analysts, the next step is measuring which consumers are buying, which channels convert, which flavors and ingredients gain share, and where policy may reshape demand. The strongest businesses will turn market growth into repeatable shelf performance and trusted positioning.


