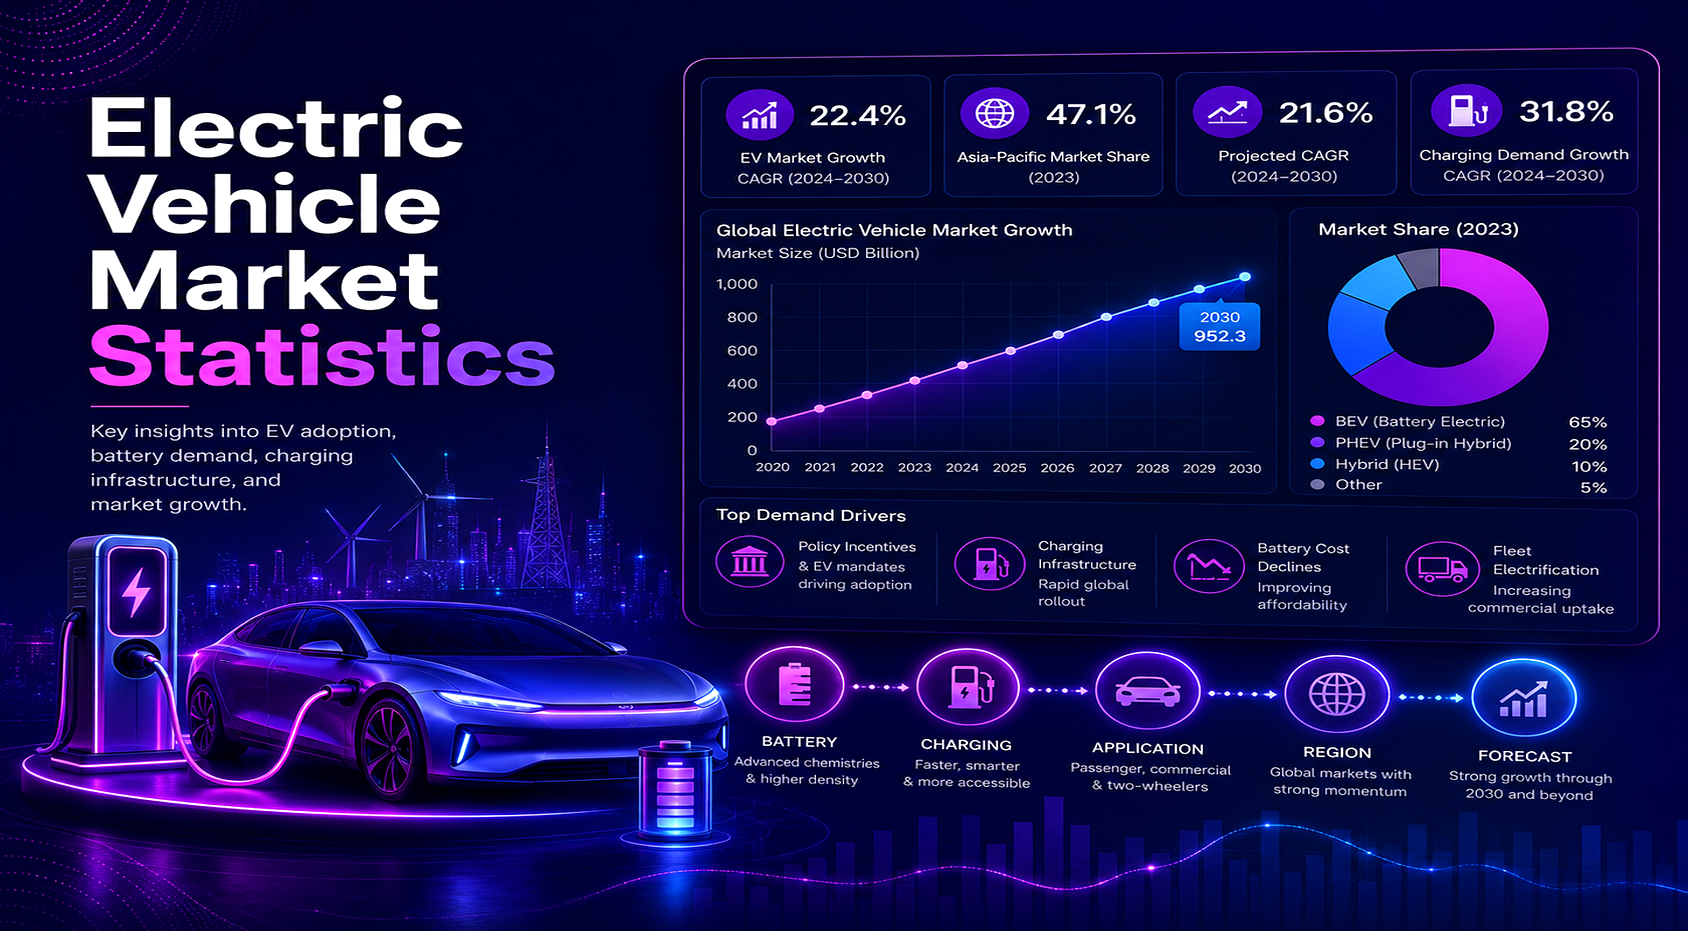
Electric vehicles are no longer a small alternative inside the automotive market. They now shape global car sales, battery demand, charging infrastructure, national industrial policy, consumer finance, utility planning, and automaker competition. The strongest EV market statistics show that adoption is not moving evenly. China has become the largest sales and manufacturing centre, Europe remains advanced but fragmented, the United States is large but uneven, and emerging markets are building early demand from a lower base.
The latest market signals show why EVs need their own scorecard. Global electric car sales exceeded 20 million in 2025, roughly one in four new cars sold worldwide was electric, and China accounted for about six out of ten global EV sales. Europe reached about 4.2 million electric car sales, while the U.S. market remained near the 1.3 million sales range and finished 2025 with a market share of 7.8%. Those numbers show scale, but they do not explain the whole market.
This article organizes EV statistics the same way a market team would use them. Sales show demand. Sales share shows maturity. Charging data shows ownership readiness. Battery data explains price and production power. Policy data explains why countries move at different speeds. Regional and country statistics show where the next adoption gains are likely to come from. The goal is not to list every available number. It is to show which numbers help explain the electric vehicle market now.
Executive Electric Vehicle Benchmarks
These are the statistics that frame the article. They show the scale of EV demand, the difference between sales volume and adoption share, the importance of China, the recovery in Europe, the uneven U.S. market, and the practical role of charging and batteries.
The numbers that define the EV market
- Global electric car sales exceeded 20 million in 2025, growing about 20% from 2024.
- Electric cars represented about 25% of global new-car sales in 2025, meaning one in four new cars sold worldwide was electric.
- Global electric car sales exceeded 17 million in 2024, with sales share above 20% before rising again in 2025.
- China sold more than 13 million electric cars in 2025 and accounted for about 60% of global electric car sales.
- Close to 55% of new cars sold in China were electric in 2025, making China both the largest and one of the most mature EV markets.
- Europe sold about 4.2 million electric cars in 2025, and EVs represented roughly 28% of the region’s new-car sales.
- The European Union sold almost 3 million electric cars in 2025, with EV share just under 27%.
- Germany reached a record 850,000 EV sales in 2025, and around 30% of new cars sold there were electric.
- U.S. EV sales in 2025 came in just below the 2024 record of 1.30 million, and EV share finished at 7.8% of the new-vehicle market.
- Kelley Blue Book estimated U.S. EVs reached 10.5% of new-car sales in the third quarter of 2025 before falling after tax-credit timing changed demand.
- Public charging infrastructure continued to expand quickly, with more than 1.3 million public charging points added globally in 2024.
- China held about 65% of global public charging points and about 60% of the global electric light-duty vehicle stock in 2024.
- Battery-electric vehicles represented about 65% of global electric car sales in 2025, while plug-in hybrids and range-extender models filled different regional roles.
- EV Volumes estimated global EV sales at 21.6 million in 2025 and forecast 22.7 million in 2026.
- Nearly 22 million electric cars were produced globally in 2025, up more than 25% from the previous year.
Why EV Market Growth Now Carries Global Automotive Stakes
EV market growth matters more when it reaches global automotive scale. In the early years, electric vehicle statistics mainly showed whether consumers were willing to try a new powertrain. Now the same statistics affect platform investment, mineral contracts, battery manufacturing, dealer strategy, charging sites, grid planning, and government trade policy. A few percentage points of EV share can represent millions of vehicles and billions of dollars in batteries, software, charging sessions, and aftersales revenue.
Market-size and growth benchmarks
- Global EV sales rose from a small early-adoption base in the mid-2010s to more than 20 million annual sales in 2025.
- The global EV sales share moved from low single digits in the late 2010s to about 25% in 2025.
- Annual electric car sales increased by around 3.5 million for five consecutive years from 2021 through 2025.
- The global electric car fleet reached almost 58 million vehicles at the end of 2024.
- Electric cars represented about 4% of the global passenger car fleet in 2024 and about 5% in 2025.
- Electric cars displaced more than 1 million barrels per day of oil consumption in 2024 and around 1.2 million barrels per day in 2025.
- More than 100 countries recorded electric car sales growth in 2025.
- Around 40 countries reached EV sales shares of 10% or more in 2025, compared with only a handful of countries in 2019.
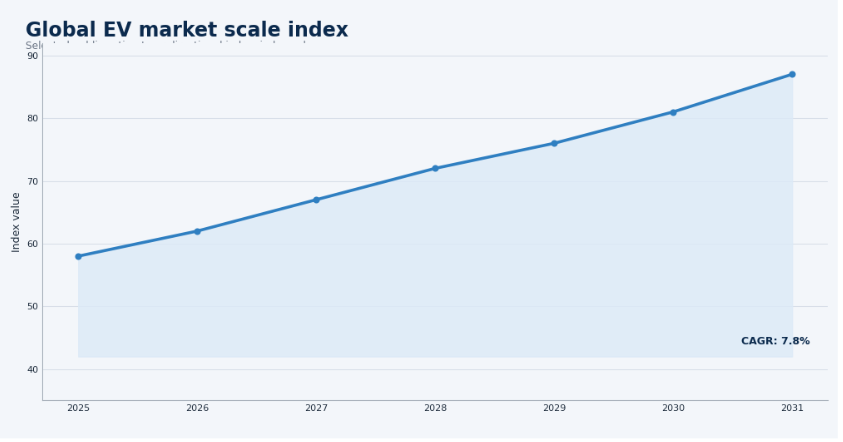
Figure 1. EV sales growth and EV sales share should be reviewed together because unit sales show market size, while sales share shows how deeply EVs are entering the new-car market.
| Growth Signal | Primary Metric | Meaning |
|---|---|---|
| Annual sales | EVs sold per year | Current demand and market scale. |
| Sales share | EVs as % of new-car sales | Adoption maturity. |
| EV stock | EVs on the road | Installed base for charging, service, insurance, and recycling. |
| BEV/PHEV split | Technology mix | Consumer, policy, and charging preference. |
| Forecast sales | Expected future volume | Planning direction for automakers, fleets, utilities, and investors. |
EV Sales Growth: Where Demand Is Accelerating
Sales growth is the easiest EV number to understand, but it is not always the easiest to interpret. A large sales total can come from one dominant country, a temporary incentive rush, a fleet-registration cycle, or a genuine mainstream shift. That is why sales should be read beside market share, stock, powertrain mix, and country-level demand.
Demand benchmarks worth separating
- Global EV sales crossed the 20 million mark in 2025 after exceeding 17 million in 2024.
- The 2025 increase represented about 20% year-over-year growth, slower than the fastest early years but still large in absolute volume.
- The 2024 increase alone was larger than total global EV sales in 2020, showing how quickly the market base expanded.
- Battery-electric vehicles remained the dominant powertrain type globally, representing about 65% of EV sales in 2025.
- Range-extender EVs represented less than 7% of global EV sales in 2025, after a higher share in 2024.
- More than 100 countries recorded EV sales growth in 2025, showing that the market is no longer limited to a few early adopters.
- However, sales remain concentrated, with China, Europe, and the United States still accounting for most global electric car volume.
- Forecasts for 2026 remained positive but more cautious, with EV Volumes estimating 22.7 million global sales.
| Demand Signal | Compare | Why It Matters |
|---|---|---|
| Global sales | 2025 versus 2024 and 2020 | Distance from early adoption to mass market. |
| Regional sales | China, Europe, U.S., and rest of world | Where global growth is concentrated. |
| EV stock | Cars on the road versus annual sales | Size of the installed base. |
| Powertrain split | BEV, PHEV, and range extender | How markets balance charging access and driving needs. |
| Forecast demand | 2026 and 2030 outlook | Durability of growth and policy sensitivity. |
EV Adoption Share: Why Volume Alone Does Not Tell the Full Story
Market share is where EV statistics become more useful. China sells the most EVs, but Norway shows what deep market maturity looks like. The United States sells more EVs than many countries, but its share is far below China and much of Europe. Emerging markets may have low share today, but their growth rates can reveal future demand.
Adoption benchmarks to compare
- EVs reached about 25% of global new-car sales in 2025.
- China’s EV share was close to 55% in 2025, with EVs exceeding half of monthly sales in 11 of 12 months.
- Europe’s EV share reached about 28% in 2025, but adoption differed widely by country.
- The European Union’s EV share reached just under 27% in 2025.
- Germany’s EV sales share was around 30% in 2025 after a strong rebound in sales.
- U.S. EV share was 7.8% in 2025, below China and Europe but still much higher than the early 2020s.
- Norway remained the mature adoption benchmark, with EVs representing the overwhelming majority of new-car registrations.
- India, Brazil, Thailand, Indonesia, and other emerging markets remained lower-share markets but offered significant long-term growth potential.
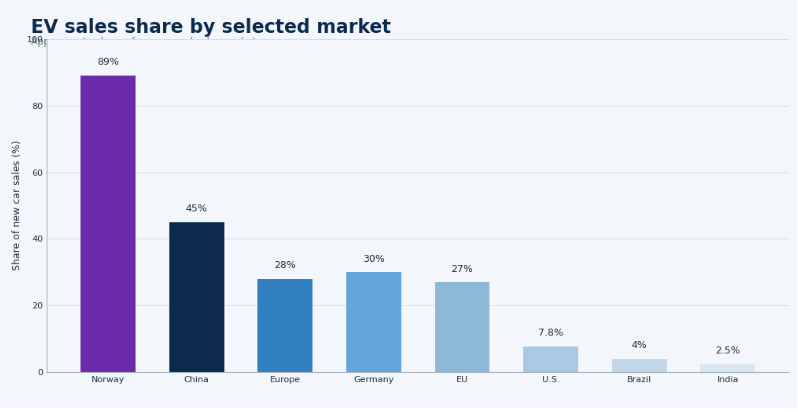
Figure 2. EV sales share shows market maturity more clearly than unit sales because smaller markets can have much higher EV penetration than larger automotive markets.
| Market Type | Example | Meaning |
|---|---|---|
| High volume, high share | China | Scale, maturity, production depth, and pricing power. |
| Smaller volume, very high share | Norway | A mature EV transition model. |
| High volume, moderate share | United States | Large remaining adoption runway. |
| Lower share, fast growth | India, Brazil, Thailand | Emerging-market potential. |
China EV Market Statistics
China is the most important EV market because it is not only the largest buyer of electric cars. It is also the largest producer, battery manufacturing centre, charging-network builder, and export base. China’s statistics therefore explain both demand and supply. They also explain why global automakers face pricing pressure and why trade policy has become part of the EV market story.
China market benchmarks
- More than 13 million electric cars were sold in China in 2025.
- China accounted for about 60% of global electric car sales in 2025.
- Close to 55% of new cars sold in China were electric in 2025.
- China’s monthly EV sales share exceeded 50% in 11 of 12 months in 2025.
- China’s trade-in scheme attracted 11.5 million applications in 2025, and nearly 60% of those were for new energy vehicles.
- China offered CNY 20,000 for replacing an older vehicle with a new EV, compared with CNY 15,000 for replacing it with a conventional vehicle.
- Used electric car sales in China exceeded 1.5 million in 2025, and EVs represented around 8% of used-car sales.
- Average BEV prices in China dropped by more than 10% in 2025, increasing pressure on global competitors.
- Around 30% of Chinese BEV models had entry prices below USD 20,000 in 2025.
- Nearly 22 million electric cars were produced globally in 2025, and China captured nearly 75% of global electric car production.
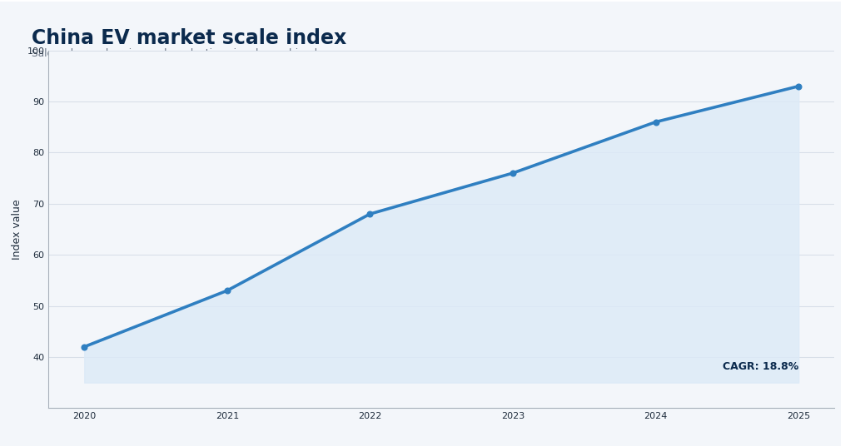
Figure 3. China’s EV leadership comes from the combination of demand, manufacturing scale, battery capacity, charging rollout, domestic brand strength, and export growth.
| China Signal | Why It Matters |
|---|---|
| Largest EV sales market | Sets the global demand rhythm and gives domestic brands scale. |
| High domestic production | Supports cost control, model variety, and faster product cycles. |
| Battery leadership | Shapes global battery pricing and supply-chain power. |
| Charging network scale | Improves ownership readiness and supports high adoption share. |
| Rising exports | Pressures global automakers and creates trade-policy tension. |
Europe EV Market Statistics
Europe is a mature EV region, but it is not one uniform market. Nordic countries show very high adoption, Western Europe drives large volumes, and Southern Europe remains more price- and infrastructure-sensitive. Policy changes, company-car rules, fuel prices, charging density, and model availability can change the pace of EV adoption from one country to another.
Europe market benchmarks
- Europe sold about 4.2 million electric cars in 2025.
- Electric car sales in Europe increased by more than 30% in 2025.
- Europe sold about 1 million more EVs in 2025 than in 2024.
- EVs represented about 28% of all new cars sold in Europe in 2025.
- EU electric car sales totalled almost 3 million in 2025, with sales share just under 27%.
- 24 of 27 EU member states recorded higher EV sales shares in 2025.
- More than half of EU countries saw EV sales share rise by more than 5 percentage points in 2025.
- Germany’s EV sales reached a record 850,000 units in 2025, up about 50% year over year.
- Battery-electric registrations in the EU reached 546,937 in the first quarter of 2026, with 19.4% market share.
- Plug-in hybrids represented 9.6% of EU registrations in the April 2026 year-to-date period, up from 7.9% a year earlier.
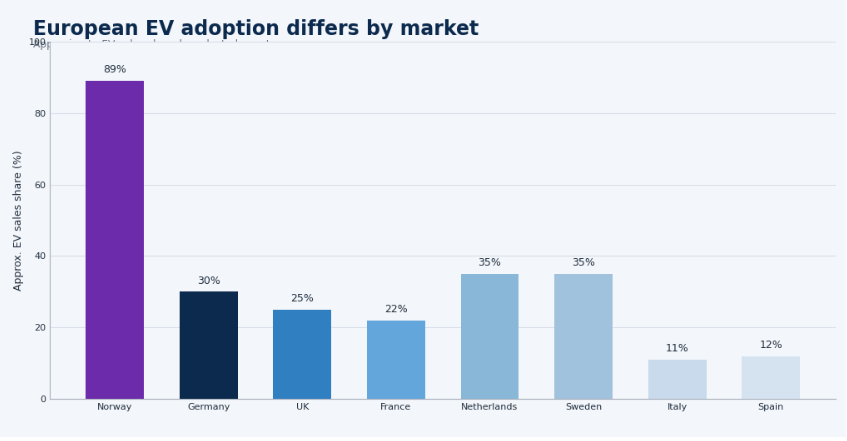
Figure 4. Europe’s EV market should be read country by country because adoption levels differ sharply between Nordic, Western, and Southern European markets.
| Country/Region | EV Signal | Interpretation |
|---|---|---|
| Norway | Very high EV share | Mature adoption benchmark. |
| Germany | Record sales and policy sensitivity | Incentives, price, and fleet rules matter. |
| United Kingdom | Strong BEV growth | Fleet demand, charging rollout, and tax rules shape adoption. |
| France | Policy-supported demand | Domestic incentives and model mix affect sales. |
| Italy and Spain | Lower EV share | Affordability and charging density remain important barriers. |
United States EV Market Statistics
The United States is a large EV market, but it remains uneven. Adoption is concentrated by state, model type, income group, charging access, and incentive timing. The market is no longer only Tesla-led, but Tesla still plays an important role. The end of federal tax-credit timing in 2025 also showed how sensitive short-term demand can be to consumer incentives.
U.S. market benchmarks
- U.S. EV sales in 2025 came in just below the 2024 record of 1.30 million.
- EV share of total U.S. new-vehicle sales was 7.8% in 2025, down from 8.1% in 2024.
- Q3 2025 was a record U.S. EV quarter, with more than 438,000 EVs sold.
- EVs accounted for 10.5% of U.S. new-car sales in Q3 2025 before demand fell in Q4.
- U.S. EV share dropped to 5.8% in Q4 2025 after the incentive-driven rush ended.
- California remained the most important state-level EV market because of policy, charging density, and consumer familiarity.
- Non-Tesla EV choice expanded as more legacy automakers and new EV brands added models.
- Charging reliability, purchase price, model availability, and consumer confidence remained important barriers to wider U.S. adoption.
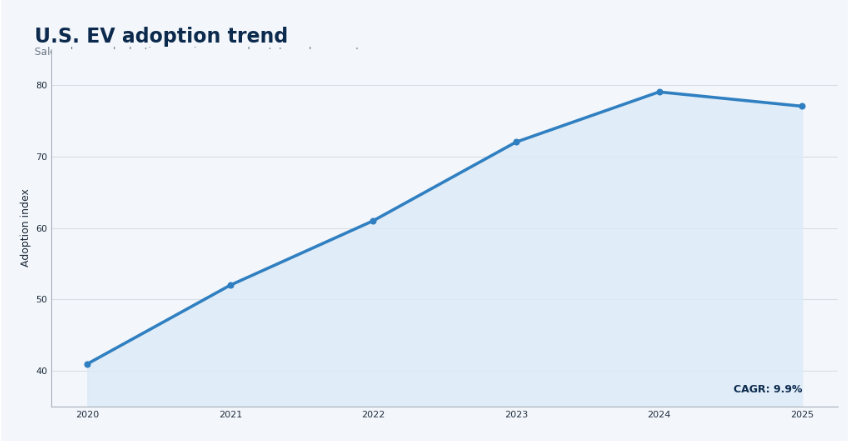
Figure 5. The U.S. EV market is expanding, but adoption remains uneven by state, brand, vehicle segment, charging access, and price point.
| U.S. Signal | Meaning |
|---|---|
| Rising EV sales | Demand is much larger than in the early 2020s. |
| Lower share than China and Europe | More adoption runway remains. |
| California concentration | State policy and infrastructure affect adoption. |
| Charging gaps | Consumer confidence remains tied to real-world charging convenience. |
| More non-Tesla models | Competition is broadening, but profitability still matters. |
Regional EV Intelligence
Regional EV data is one of the highest-value parts of the article because global averages hide the real adoption story. Income levels, fuel prices, electricity prices, import duties, charging density, domestic production, subsidies, fleet policies, and consumer trust all change the shape of EV adoption. The same global EV statistic can mean very different things in China, Germany, Brazil, India, the UAE, or South Africa.
Asia-Pacific
- Asia-Pacific is anchored by China, which combines the world’s largest EV demand base with the world’s largest EV manufacturing base.
- India remains earlier-stage in passenger EV adoption, but two-wheelers, buses, and fleet electrification make the Indian market strategically important.
- Japan has moved more slowly on BEVs because hybrids remain deeply established in its domestic market.
- South Korea matters through automakers and battery producers even when domestic EV share is smaller than China’s.
- Thailand, Indonesia, and Vietnam are important because they connect EV adoption with Southeast Asian manufacturing and policy ambitions.
- Australia has seen rising EV interest as model availability and policy support improve.
Latin America
- Brazil is the largest automotive market in Latin America and one of the most important regional EV growth opportunities.
- Mexico matters because of its role in North American auto manufacturing and supply chains.
- Chile, Colombia, and Costa Rica show how policy support, urban fleets, and charging rollouts can create early adoption momentum.
- Electric buses are especially important in Latin America because public transport electrification can scale faster than private passenger EV adoption.
- Chinese EV imports are changing the region’s affordability and model-availability picture.
Middle East and Africa
- The UAE and Israel are among the more visible early EV markets in the Middle East, supported by premium demand, charging rollout, and policy interest.
- Saudi Arabia’s EV story is tied to industrial investment, manufacturing ambition, and long-term economic diversification.
- South Africa has low EV adoption today but is important because of its automotive export base and policy exposure to global emissions standards.
- North African markets such as Morocco and Egypt may become more important through manufacturing, imports, and urban fleet electrification.
- Many African EV markets will depend on used imports, financing, charging access, grid reliability, and two- or three-wheeler electrification before private EV cars scale widely.
| Region | Implication |
|---|---|
| Asia-Pacific | Treat China as the anchor, but separate India, Japan, Korea, Southeast Asia, and Australia. |
| Europe | Analyze by country because adoption is fragmented. |
| North America | Watch U.S. state-level adoption, charging, affordability, and domestic manufacturing. |
| Latin America | Focus on affordability, Chinese imports, public transport, and early charging networks. |
| Middle East | Watch premium EV adoption, policy targets, charging rollout, and manufacturing investment. |
| Africa | Track affordability, import policy, charging access, fleet electrification, and used EV potential. |
Charging Infrastructure Statistics
Charging is where EV adoption becomes practical. A consumer can like an EV, believe in the technology, and accept the price, but still delay purchase if charging is inconvenient or unreliable. That makes charging statistics central to the market. Charger count matters, but it is only the beginning. Speed, uptime, location, payment access, grid capacity, and home-charging availability all influence ownership confidence.
Charging benchmarks
- More than 1.3 million public charging points were added globally in 2024.
- The 2024 increase represented growth of more than 30% compared with the previous year.
- The public chargers added in 2024 were roughly equal to the total number of public chargers available globally in 2020.
- About two-thirds of public charger growth since 2020 occurred in China.
- China held about 65% of global public charging points in 2024.
- China also held about 60% of the global electric light-duty vehicle stock in 2024.
- Fast chargers are especially important for highway travel, fleets, taxis, delivery use, and drivers without reliable home charging.
- Home charging remains critical because it reduces daily ownership friction and can lower charging cost for consumers.
- Charger reliability is now a market-quality metric because poor uptime can damage EV confidence even where station counts are rising.
- Charger utilization matters for network operators because infrastructure must be both available to drivers and economically sustainable.
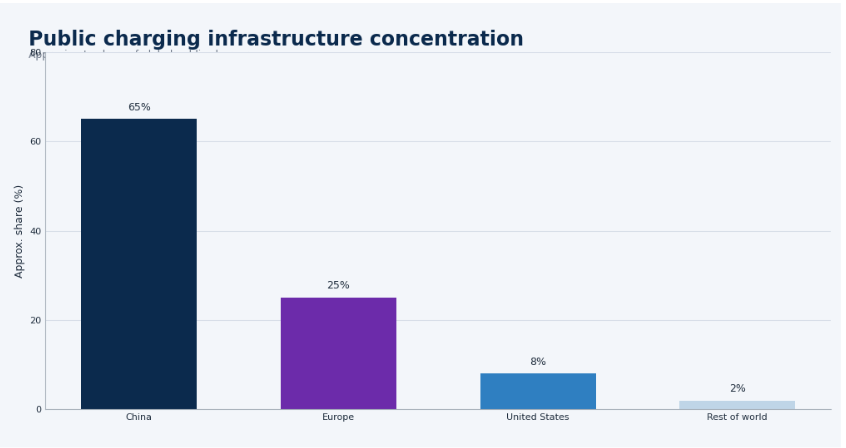
Figure 6. Charging infrastructure should be measured by access, speed, reliability, location, and utilization rather than charger count alone.
| Charging Signal | Why It Matters |
|---|---|
| Public chargers | Help drivers without home charging and support visitor/travel needs. |
| Fast chargers | Support highway use, fleets, taxis, and long-distance travel. |
| Home charging | Reduces daily ownership friction and supports lower charging cost. |
| Charger density | Improves confidence when drivers can see stations nearby. |
| Reliability | Determines the real user experience more than station count alone. |
| Utilization | Affects charging-network economics and investment returns. |
EV Battery and Supply Chain Statistics
Batteries are the cost engine and production engine of the EV market. Battery data explains why some EVs become affordable faster than others, why China has a manufacturing advantage, why automakers are building local battery plants, and why governments treat battery minerals as strategic resources. Sales data shows demand, but battery statistics explain whether that demand can be supplied at the right price.
Battery and supply-chain benchmarks
- Battery-electric vehicles represented about 65% of global electric car sales in 2025.
- Battery demand continued to rise with EV sales, increasing pressure on cell manufacturing, pack assembly, and mineral supply chains.
- China remained the dominant EV battery manufacturing centre and played a major role in cell supply, cathode production, and battery chemistry shifts.
- LFP batteries gained market importance because they can reduce cost, avoid nickel and cobalt, and support lower-priced EVs.
- Nickel-rich chemistries continued to matter for longer-range models, premium vehicles, and some performance use cases.
- Battery pack prices remain one of the most important drivers of EV affordability and automaker margins.
- Battery recycling is becoming more important as the EV stock grows and more vehicles reach end-of-life or second-life use.
- Local battery manufacturing investments in Europe and North America are linked to industrial policy, tax credits, trade rules, and supply-chain security.
- Mineral supply risks remain relevant because lithium, graphite, nickel, cobalt, and manganese supply chains are geographically concentrated.
- Battery strategy affects not only vehicle cost but also range, charging speed, safety, warranty risk, and resale value.
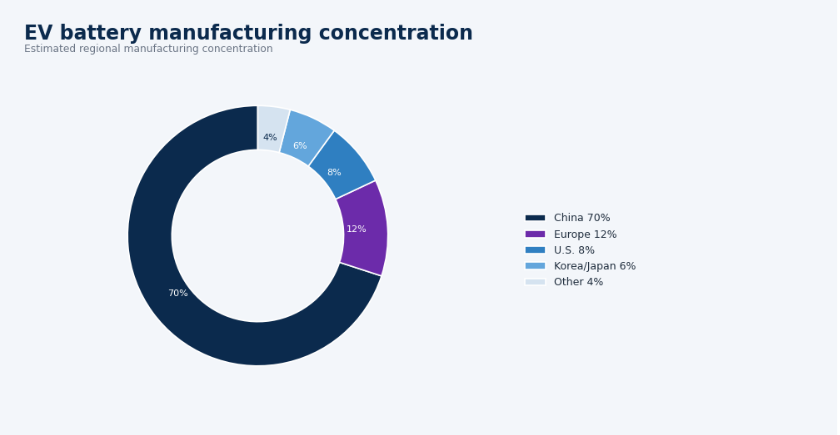
Figure 7. Battery statistics explain EV affordability, range, production scale, and supply-chain power more clearly than vehicle sales alone.
| Battery Signal | Meaning |
|---|---|
| Battery demand | Production scale and material pressure. |
| Pack prices | EV affordability and automaker margins. |
| Chemistry mix | Cost, range, safety, and mineral exposure. |
| Manufacturing capacity | Supply-chain influence and regional competitiveness. |
| Mineral supply | Long-term production and price risk. |
| Recycling | Material security as the EV fleet grows. |
EV Affordability and Consumer Adoption Barriers
Affordability is one of the most important EV adoption tests. A falling battery price does not automatically make every EV affordable, and a subsidy does not solve every barrier. Buyers consider purchase price, monthly payments, incentives, charging access, home parking, insurance, maintenance, resale value, battery warranty, range, and trust in public charging. That is why affordability should be read as a total ownership issue, not only a sticker-price issue.
Adoption barrier benchmarks
- Average BEV prices in China dropped by more than 10% in 2025, intensifying global price competition.
- Around 30% of Chinese BEV models had entry prices below USD 20,000 in 2025.
- Germany’s average BEV price fell by about 6% in 2025, helped by stronger market competition.
- China’s used EV sales exceeded 1.5 million in 2025, but used EV valuation remained a challenge.
- Three-year-old EV value retention in China was about 46% in 2024, below the overall used-car value retention of around 55%.
- Average BEV and PHEV resale value retention in China fell to around 42% by late 2025.
- An estimated 80% of Chinese used-car dealers refused BEVs older than five years, showing how battery confidence can affect resale markets.
- Charging access remains a major barrier for apartment dwellers, renters, rural households, and drivers who cannot install home chargers.
- Range anxiety is often less about average daily driving distance and more about confidence during long trips or cold-weather driving.
- Insurance and repair costs can become adoption barriers if consumers believe EV ownership is financially uncertain after purchase.
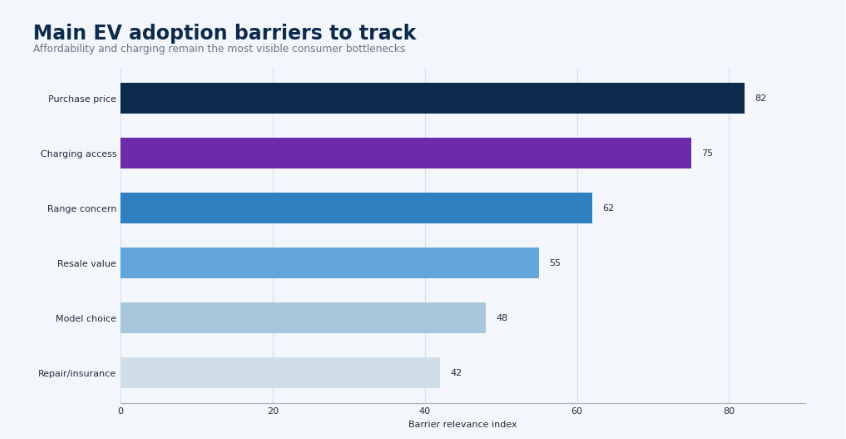
Figure 8. EV affordability should be measured through purchase price, incentives, charging access, running costs, resale value, and consumer confidence.
| Barrier | Market Signal | Likely Fix |
|---|---|---|
| Purchase price | EVs remain costly in many markets | Cheaper models, incentives, and battery cost decline. |
| Charging access | Infrastructure is uneven | Home charging, workplace charging, and reliable public stations. |
| Range anxiety | Consumer confidence barrier | Better batteries, fast charging, and clearer real-world range information. |
| Resale uncertainty | Used EV market still developing | Battery health data, warranties, and transparent valuation. |
| Model availability | Limited affordable choices in some markets | More mass-market EV models and stronger local distribution. |
EV Policy, Incentives, and Regulation Statistics
Policy explains many of the differences between EV markets. Incentives can pull demand forward, emissions rules can push automakers to supply more EVs, charging grants can improve ownership confidence, and tariffs can reshape trade flows. But policy alone is not enough. Incentives work best when consumers can choose affordable vehicles, charge them easily, and trust the ownership experience.
Policy benchmarks and levers
- The EU car CO2 standards targeted a 15% reduction from 2021 levels in 2025, supporting stronger EV supply and registrations.
- Germany reintroduced EV subsidies backed by a EUR 3 billion budget envelope in 2026.
- China’s trade-in support offered CNY 20,000 for replacing an older vehicle with a new EV.
- China’s support for conventional replacement was lower, at CNY 15,000, creating a policy signal in favour of EVs.
- U.S. tax-credit timing affected 2025 demand, helping create a record Q3 before a sharp Q4 slowdown.
- Norway’s long-running incentive structure remains a global example of how tax policy, road benefits, and charging support can accelerate adoption.
- Tariffs and local-content rules are increasingly important because EVs are tied to battery supply chains and domestic manufacturing goals.
- Company-car tax treatment matters in Europe because company vehicles make up a large share of new-car registrations in several markets.
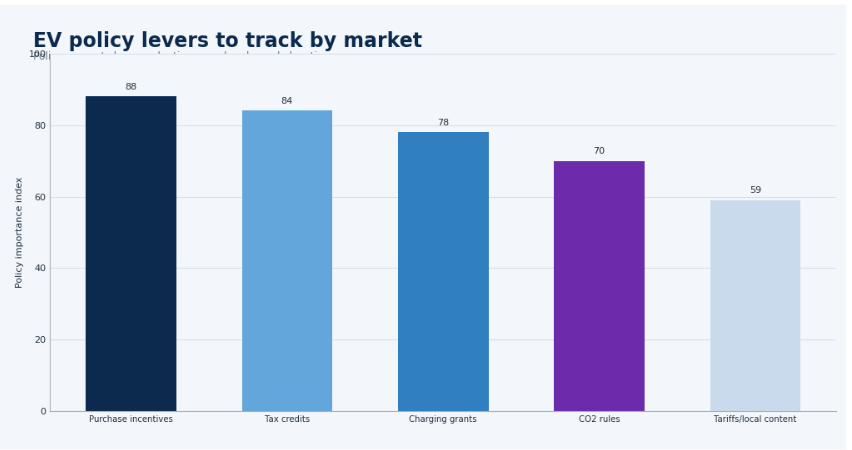
Figure 9. Policy levers influence EV adoption through affordability, automaker supply, charging readiness, domestic manufacturing, and import competitiveness.
| Policy Lever | Effect |
|---|---|
| Purchase subsidies | Short-term adoption and price sensitivity. |
| Tax credits | Consumer affordability and fleet buying decisions. |
| Emissions rules | Automaker strategy and EV model supply. |
| Charging grants | Ownership readiness and public confidence. |
| Local-content rules | Supply-chain location and domestic manufacturing. |
| Tariffs | Import prices, exports, and global competition. |
EV Manufacturing, Brands, and Competition Statistics
The EV market is becoming more competitive and more selective. Early growth rewarded first movers, but the next stage rewards companies that can produce at scale, manage batteries, lower prices, control software, maintain quality, and protect margins. Brand statistics are useful only when they are read beside production capacity, model range, exports, battery access, and profitability.
Competition benchmarks
- Nearly 22 million electric cars were produced globally in 2025, up more than 25% from the previous year.
- About one-quarter of electric cars produced globally in 2025 were traded between major production and demand centres.
- China captured nearly 75% of global electric car production in 2025.
- China captured about 40% of global electric car trade in 2025.
- BYD became the most important global EV competitor because of scale, battery integration, pricing, and model range.
- Tesla remained a major global EV brand, but competition broadened as Chinese and legacy automakers added more models.
- Chinese automakers increased their presence in Europe, adding pressure on European and American brands.
- European and U.S. automakers faced a difficult balance between EV investment, margin protection, and consumer price expectations.
- Model availability is now a market-growth variable because consumers need EV choices across price points, body styles, and driving needs.
- Software, charging access, battery warranties, and over-the-air updates are becoming part of EV competition, not just vehicle hardware.
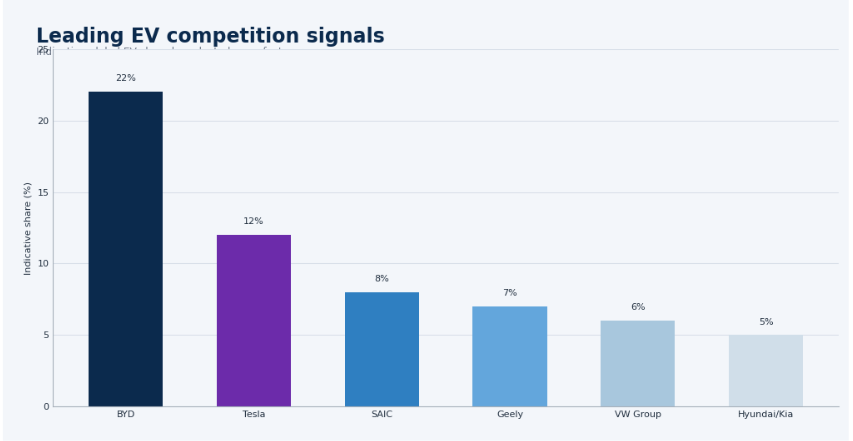
Figure 10. EV competition is shifting from early-market leadership to price, scale, battery access, software, charging ecosystem, and global export strength.
| Competitive Signal | Why It Matters |
|---|---|
| Brand share | Current market leadership. |
| Model count | Consumer choice and segment coverage. |
| Battery access | Cost competitiveness and production security. |
| Exports | Global expansion and trade exposure. |
| Margins | Financial sustainability of EV growth. |
| Software ecosystem | Customer retention and feature differentiation. |
Commercial EV, Fleet, Bus, and Two-Wheeler Statistics
Passenger cars receive most EV attention, but the broader EV market includes buses, vans, trucks, two-wheelers, taxis, ride-hailing vehicles, delivery fleets, and municipal fleets. These segments matter because their economics are often more measurable than private consumer adoption. A fleet can calculate fuel savings, depot charging, maintenance, utilization, and emissions benefits more directly than a household buyer.
Segment benchmarks to include
- Electric buses remain one of the strongest public-sector EV use cases because cities can connect them directly to air-quality and operating-cost goals.
- Electric vans are important for delivery fleets because they often follow predictable routes and can charge at depots.
- Electric trucks remain earlier-stage but strategically important for freight decarbonization and logistics emissions.
- Two-wheelers are central in many Asian markets because they offer a more affordable route to electrification than passenger cars.
- Fleet electrification can scale quickly when charging is planned around depots, routes, and daily mileage.
- Public transport electrification is especially important in emerging markets because bus systems can create visible EV adoption even before private EV cars become common.
- Municipal fleets can help build early charging demand and normalize EV use in city operations.
- Last-mile logistics EV adoption is tied to ecommerce growth, urban emissions rules, and delivery-cost management.
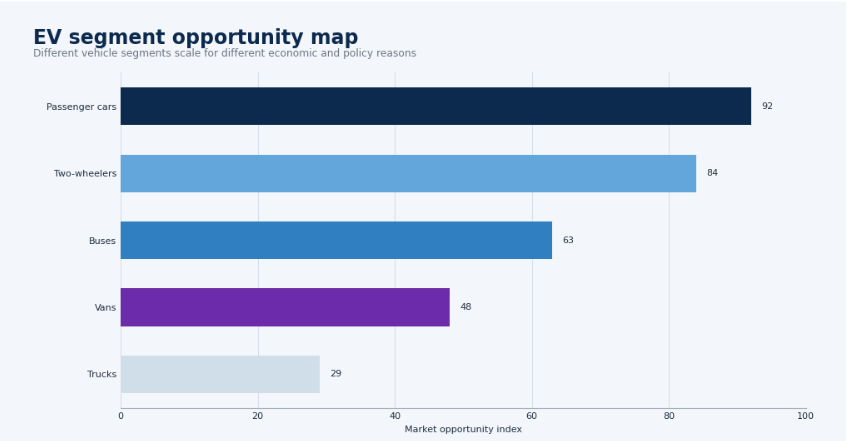
Figure 11. EV adoption is broader than passenger cars; two-wheelers, buses, vans, trucks, and fleets can follow different adoption curves.
| Segment | Market Signal | Why It Matters |
|---|---|---|
| Passenger cars | Largest consumer category | Main public adoption market. |
| Buses | Strong policy fit | Urban emissions and public transport. |
| Vans | Delivery electrification | Fleet cost savings and predictable routes. |
| Trucks | Early but important | Freight decarbonization and logistics planning. |
| Two-wheelers | Large in Asia | Affordable mass electrification. |
EV Market Growth Bottleneck Diagnostic
A polished EV statistics article should help readers decide where to look next. Sales growth alone does not reveal whether a market is healthy. The most useful structure is a diagnostic model that connects numbers to market bottlenecks. This keeps the article from becoming a stat dump and turns each benchmark into a business question.
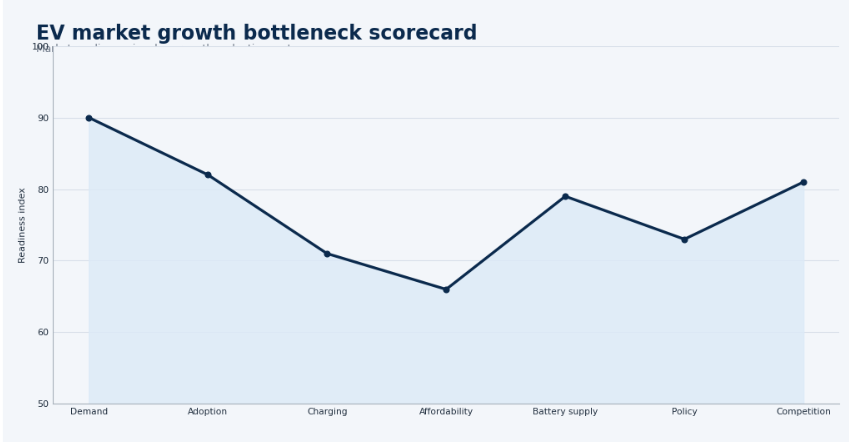
Figure 12. A growth bottleneck scorecard keeps EV statistics tied to demand, adoption maturity, charging readiness, battery supply, affordability, policy, and competition.
| Problem Area | Core Signals | Benchmark |
|---|---|---|
| Demand | EV sales, registrations, growth rate | Where EV demand is expanding. |
| Adoption maturity | EV sales share, BEV/PHEV mix | Whether EVs are becoming mainstream. |
| Charging readiness | Public chargers, fast chargers, reliability | Whether drivers can own EVs confidently. |
| Affordability | EV price, incentives, battery costs | Whether EVs can reach mass-market buyers. |
| Battery supply | Battery demand, manufacturing capacity, minerals | Whether production can scale. |
| Competition | Brand share, model launches, exports | Whether the market is broadening. |
| Policy support | Incentives, mandates, tariffs, charging grants | Whether adoption has structural support. |
| Regional maturity | Country-level sales share and infrastructure | Where adoption gaps remain. |
90-Day EV Market Benchmark Plan
Statistics become useful when they are translated into a repeatable review process. A practical EV market review can be organized into a 90-day cycle. The goal is not to collect every number. The goal is to build a scorecard that separates headline growth from durable adoption drivers.
| Timing | Action | Output |
|---|---|---|
| Days 1-30 | Capture baseline sales, country share, BEV/PHEV mix, chargers, and EV stock. | Clear map of strongest EV demand. |
| Days 31-60 | Compare charging, prices, incentives, infrastructure readiness, and barriers. | Shortlist of adoption drivers and bottlenecks. |
| Days 61-90 | Review competition, exports, fleets, policy, battery supply, and 2030 forecasts. | Repeatable EV market scorecard. |
Metrics EV Market Leaders Should Track
The final scorecard should be detailed enough to locate the market bottleneck without becoming a vanity dashboard. These metrics provide a useful minimum set for automakers, charging networks, battery suppliers, fleets, utilities, investors, and policymakers.
| Metric | Why It Matters |
|---|---|
| EV sales volume | Demand scale and market size. |
| EV sales share | Adoption maturity. |
| BEV/PHEV split | Technology preference and charging dependence. |
| EV stock | Installed base and future service demand. |
| Public chargers | Infrastructure access. |
| Fast chargers | Travel readiness and fleet support. |
| Charger reliability | Real-world ownership quality. |
| Battery prices | Affordability path. |
| Battery demand | Production pressure and material needs. |
| Brand share | Competitive position. |
| Model availability | Consumer choice. |
| Policy support | Demand stability. |
| Regional adoption | Future growth gaps. |
Electric Vehicle Market Statistics FAQ
Common questions
How big is the electric vehicle market?
The EV market is now a mainstream global automotive category. Global electric car sales exceeded 20 million in 2025, and EVs represented about 25% of new-car sales worldwide. The market is large enough to influence automaker platforms, battery demand, charging infrastructure, trade policy, and national industrial strategy.
How many electric vehicles are sold globally each year?
Global electric car sales exceeded 17 million in 2024 and moved above 20 million in 2025. EV Volumes estimated global EV sales at 21.6 million in 2025 and forecast 22.7 million in 2026. The absolute increase is large even when percentage growth slows.
Which country sells the most EVs?
China sells the most EVs by a wide margin. More than 13 million electric cars were sold in China in 2025, and the country accounted for about 60% of global electric car sales. China is also the largest EV production and battery manufacturing hub, which makes it important beyond consumer demand.
What percentage of new cars are electric?
Globally, about 25% of new cars sold in 2025 were electric. The share was much higher in some markets, including China at close to 55% and Europe at about 28%. In the United States, EV share was 7.8% in 2025, showing a large but less mature market.
Which region leads the EV market?
Asia-Pacific leads because China dominates global EV sales, production, batteries, and charging infrastructure. Europe is the next major mature region, while the United States remains a large but uneven market. Emerging regions such as Latin America, the Middle East, and parts of Africa are earlier-stage but important for future growth.
Why is China so important in the EV market?
China is important because it combines demand, production, batteries, charging, domestic brands, and exports. More than 13 million EVs were sold there in 2025, close to 55% of new cars sold in China were electric, and the country captured nearly 75% of global electric car production.
How fast is Europe adopting EVs?
Europe sold about 4.2 million electric cars in 2025, up more than 30% from 2024. EVs represented about 28% of new-car sales across Europe. Adoption differs sharply by country, with Nordic markets much more mature than Southern Europe and large markets such as Germany, France, and the UK shaped by policy and fleet demand.
Is the U.S. EV market still growing?
The U.S. EV market is large but uneven. Sales in 2025 were just below the 2024 record of 1.30 million, and EV share was 7.8%. Demand surged in Q3 2025 when EVs reached 10.5% of new-car sales, then fell in Q4 after tax-credit timing changed buyer behaviour.
What is the biggest barrier to EV adoption?
The biggest barrier depends on the market. In high-cost markets, purchase price and financing matter most. In infrastructure-limited markets, charging access and reliability are bigger issues. Consumers also consider range, resale value, battery warranty, insurance, repair cost, and whether EV models fit their daily driving needs.
Why does charging infrastructure matter?
Charging infrastructure determines whether EV ownership feels practical. More than 1.3 million public charging points were added globally in 2024, but charger count alone is not enough. Drivers also need reliable stations, fast charging where appropriate, easy payments, good locations, and home or workplace charging options.
Are EV batteries becoming cheaper?
Battery costs have generally fallen over the long term, and lower battery prices are one reason EVs can become more affordable. However, battery affordability also depends on chemistry, mineral prices, manufacturing scale, supply-chain concentration, pack design, and automaker margins. Battery price is one of the most important EV adoption indicators.
What is the EV market outlook by 2030?
The outlook remains positive, but growth will depend on affordability, charging, battery supply, policy stability, and competition. Forecasts point to continued sales growth, but the pace may differ by region. China is likely to remain the anchor market, while Europe, the United States, India, Southeast Asia, and Latin America offer different growth paths.
Final Takeaway
Electric vehicle market statistics point to one conclusion: EV adoption is now a full market-system test, not only a vehicle-sales trend. The strongest markets are those that combine demand, charging readiness, battery supply, affordable models, supportive policy, and competitive manufacturing. A market can have strong sales but weak charging, strong incentives but high prices, or strong production but uncertain profitability. The numbers only become useful when they are read together.
China remains the centre of the global EV market because it combines consumer adoption, manufacturing scale, battery strength, price competition, and export capacity. Europe shows mature but fragmented adoption, with Nordic markets far ahead and Southern Europe still facing affordability and infrastructure gaps. The United States remains large and important, but its adoption is uneven by state, brand, segment, price, and charging access. Emerging markets are smaller today, but they may shape the next phase of EV demand through affordable models, two-wheelers, buses, fleets, and imports.
For market leaders, the practical goal is to build an EV scorecard rather than chase a single headline number. Track sales, sales share, stock, public chargers, fast chargers, charger reliability, battery prices, battery demand, model availability, incentives, exports, fleet adoption, and regional maturity. The EV market will keep expanding, but the winners will be the markets and companies that turn demand into affordable, reliable, well-supported, and profitable electric mobility.
The clearest way to use these statistics is to ask what they reveal about bottlenecks. If sales rise but share remains low, adoption may still be early. If share rises but charging is weak, ownership confidence may become the next problem. If prices fall but used EV values weaken, battery trust and resale transparency need attention. If exports rise but tariffs follow, trade policy becomes part of the market story. EV growth is real, but the next stage will be decided by the quality of the market system behind the vehicles.


