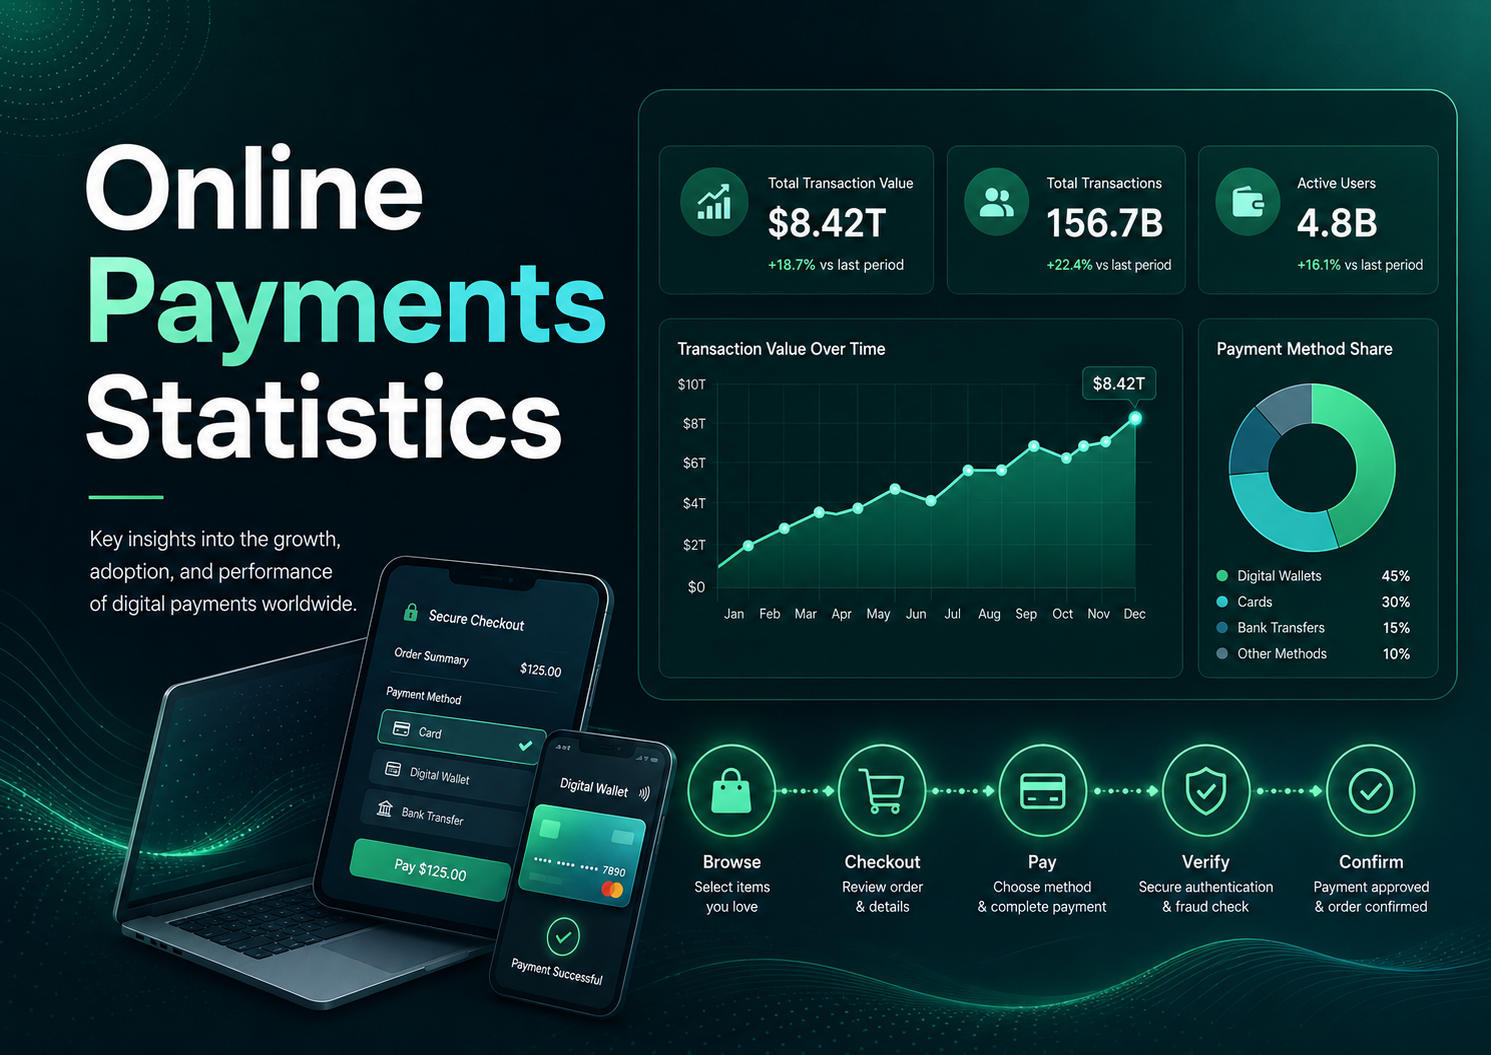
Online payments are no longer a single checkout feature or a card-processing choice. They are a global mix of digital wallets, cards, bank transfers, account-to-account rails, instant payments, payment links, BNPL, ACH, UPI, Pix, and mobile-first payment flows. The same customer who expects a wallet button in one market may expect a bank transfer, instant rail, local card, or QR payment in another. That makes online payment performance a business system, not just a payment form.
The strongest statistics show why this system deserves its own scorecard. Worldpay data puts global digital payment value across ecommerce and in-person commerce at $18.7 trillion in 2024, up from $1.7 trillion in 2014, with a projection above $33.5 trillion by 2030. Global ecommerce spend reached about $6.8 trillion in 2024, while digital wallets represented 53% of global ecommerce value. At the same time, card approval, false declines, fraud controls, local payment expectations, and payment-method availability can still decide whether a customer actually completes payment.
Online payment statistics are most useful when they are read through practical business questions. Ecommerce, invoice payment, subscriptions, service billing, regional expansion, and small-business payment acceptance all require different payment decisions. The most useful benchmarks help teams understand payment choice, regional behavior, mobile convenience, authorization, fraud, and payment completion.
Executive Online Payment Benchmarks
These are the statistics that define the online-payment landscape. They show the scale of digital payment growth, the rise of wallets and bank-based rails, the continuing role of cards, and the risk that payment failure or missing payment methods can erase intent after a customer is ready to pay.
The numbers that define the online payment shift
• Global digital payment value has grown from $1.7 trillion in 2014 to $18.7 trillion in 2024, and Worldpay projects the total will pass $33.5 trillion by 2030.
• Online commerce is already operating at major scale, with global ecommerce spend rising from $1.2 trillion in 2014 to about $6.8 trillion in 2024.
• Digital payment methods now account for 66% of ecommerce value, nearly double the 34% share reported in 2014.
• Digital wallets have become the dominant global ecommerce method, reaching 53% of online payment value in 2024 and a projected 65% by 2030.
• Smartphones have changed the payment surface too, with their share of global ecommerce spend rising from 19% in 2014 to 57% in 2024.
• Cards still shape online payment economics: U.S. consumer-payment data shows credit cards at 35% of all payments by number and debit cards at 30%.
• The euro area shows a different non-cash pattern, with 77.7 billion non-cash payment transactions in H1 2025 and cards representing 57% of transaction count.
• Canada adds another North American comparison: online purchases represented 23% of all Canadian purchases in 2024, while mobile payments accounted for almost 5%.
• India’s UPI crossed 2,000 crore monthly transactions in August 2025, showing how a domestic real-time rail can reshape online and mobile payment behavior.
• Brazil’s Pix has become a high-value business rail too: B2B Pix accounts for only 3% of Pix transaction count but 46% of Pix value, with an average B2B transaction of BRL 5,420.
• Payment choice still affects completion. Stripe found 85% of customers would abandon checkout if their preferred payment method was unavailable, while Adyen reports 54% may leave when they cannot use their preferred method.
• Payment failure is expensive after intent is already present: Checkout.com reports $50.7 billion in false-decline losses across the U.S., U.K., France, and Germany.
Editorial readout The headline numbers point to a simple reality: online payment strategy now has to manage scale, method choice, regional expectation, mobile behavior, and approval quality at the same time. A business that only asks whether it accepts cards is asking too small a question. The better question is whether each customer has a trusted, familiar, low-friction path to complete payment in the market, device, and purchase context they are using.
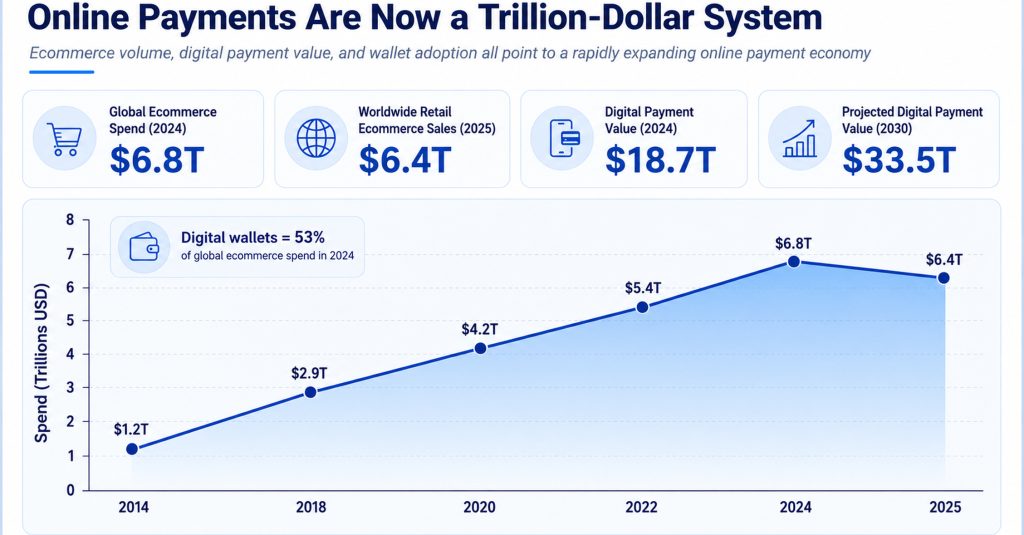
Figure 1. Online payment scale should be reviewed alongside ecommerce growth because payment-method improvements become financially meaningful when transaction value reaches trillions of dollars.
Why Online Payments Are No Longer One Payment Method
The phrase “online payment” hides a lot of operational differences. A card payment relies on card credentials, issuing-bank authorization, fraud controls, and payment routing. A wallet payment may sit on top of a card or bank account, but it changes the user experience through saved credentials and faster confirmation. A pay-by-bank transaction may reduce card dependence but introduces a different set of banking rails, customer authentication steps, settlement expectations, and reconciliation needs.
That distinction matters for small businesses and larger merchants alike. The payment method that improves completion for a mobile shopper may not be the method that works best for a recurring invoice, a B2B portal, a subscription renewal, or an international customer. Online payment performance is therefore less about adding every possible option and more about matching the method to the transaction type.
Online payment categories worth separating
• Card payments remain a baseline method because they are widely recognized, support chargeback rules, and still account for large shares of consumer payment activity in many markets.
• Wallet payments reduce typing and support returning-customer speed; that helps explain why wallets reached 53% of global ecommerce payment value in 2024.
• Bank-based payment methods are not one category. ACH, online banking bill pay, open-banking payments, UPI, Pix, and Faster Payments each carry different customer habits and settlement expectations.
• BNPL and financing methods can influence order value and conversion, but they also require margin, refund, risk, and customer-quality review.
• Invoice payment links sit between ecommerce and accounts receivable: they may use cards, ACH, wallets, or bank payments, but the customer experience still feels like an online payment flow.
• Recurring payments and subscriptions depend on tokenization, failed-payment recovery, card updater tools, customer notifications, and retry timing more than on a one-time checkout layout.
• Cross-border payments add currency, local method availability, authorization routing, tax display, refund, fraud, and support-ticket complexity.
• Payment completion should be measured by method, device, country, customer type, and decline reason rather than as one blended online payment rate.
How to read the method mix A payment method should not be judged only by adoption. A wallet may improve mobile conversion, but a bank transfer may reduce card fees or suit account-to-account expectations. A BNPL option may raise order value, but it may change returns and disputes. A card optimization project may not add a new button at all; it may raise authorization quality, reduce false declines, or improve fallback routing.
The Global Shift From Cards To Wallets, A2A, And Real-Time Rails
Global online payment behavior is changing in two directions at once. Digital wallets have become the most visible consumer-facing shift, especially in mobile commerce. At the same time, bank-based account-to-account rails are becoming more important in markets where instant payments, open banking, or domestic transfer systems have become familiar to consumers and businesses.
The key point is that the shift is not uniform. Wallets dominate some markets, cards remain central in others, and A2A systems can become a default in specific countries. A global average helps show direction, but it cannot tell a business which payment methods to offer in a specific market.
Global method-shift benchmarks
• The value of digital payments across ecommerce and POS reached $18.7 trillion in 2024, more than ten times the $1.7 trillion level recorded in 2014.
• Worldpay projects digital payment value above $33.5 trillion by 2030, so payment-method decisions will affect a much larger pool of completed transactions.
• Global ecommerce spend grew from $1.2 trillion in 2014 to about $6.8 trillion in 2024, giving online payment optimization a larger base of value.
• Digital wallets handled 53% of global ecommerce spend in 2024, while wallet share at POS reached 32%.
• The projected wallet share of global ecommerce value reaches 65% by 2030, making wallet support a core payment decision rather than a convenience feature.
• Worldpay data shows BNPL online spend growing from about $2.2 billion in 2014 to $342 billion in 2024, though financing still needs risk and margin review.
• Account-to-account ecommerce spend is projected to reach $936 billion by 2030, compared with $152 billion in 2014.
• Brazil’s Pix-linked A2A ecommerce value rose from $3.6 billion in 2020 to $35.3 billion in 2024, showing how quickly a domestic instant-payment rail can change online behavior.
• Global smartphone share of ecommerce spend moved from 19% to 57% over the decade, turning payment speed and saved credentials into mobile conversion issues.
• Worldpay projects digital methods to represent 79% of online spend and 53% of in-store spend by 2030.
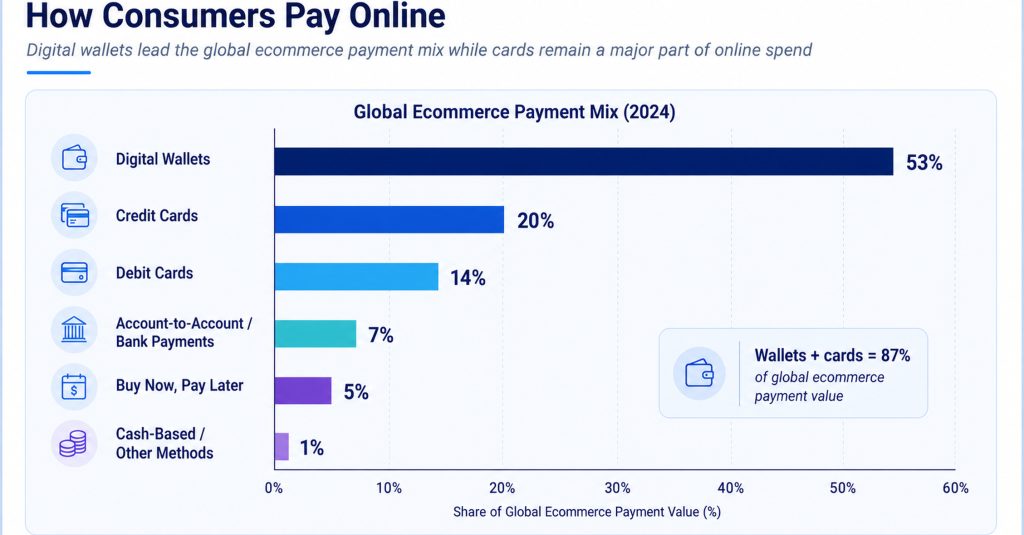
Figure 2. Regional payment-method shares show why online payment planning cannot rely on one global payment-method average.
Regional Online Payment Intelligence
Regional payment data is one of the most important parts of online-payment planning because global averages can mislead. A business may see digital wallets leading worldwide and assume every market is moving the same way. In practice, the U.S. still has deep card economics, Canada has its own mix of cards, Interac, and mobile behavior, Europe combines cards, credit transfers, wallets, e-money, and instant transfers, India has UPI at massive scale, and Brazil has Pix as a high-volume, high-value domestic payment rail.
The practical implication is straightforward: localization is not only language, currency, and tax display. Payment localization means understanding which method customers expect, how authentication works, how fast money moves, how refunds happen, how support tickets are handled, and whether the payment record can reconcile cleanly after the transaction.
North America: cards still matter, but wallet and remote behavior are changing
North America is often described as card-heavy, and that still matters for payment planning. U.S. consumer data puts credit cards at 35% of all payments by count and debit cards at 30%, so card authorization, stored credentials, disputes, and issuer response remain core online-payment issues. At the same time, the online surface is broader than card entry alone: remote purchases and P2P activity represented 23% of consumer purchase and P2P behavior, while average mobile-phone payments reached 11 per month after sitting near 4 per month in 2018.
The business lesson is that a North American payment stack should not frame cards and wallets as competitors. Cards still carry large transaction share, but wallets, mobile checkout, and bill-payment behavior change how customers want to authenticate and complete payment.
• Card performance still deserves executive attention because remote purchases paid with cards represented 72% by number and 54% by value.
• Bill payments are a useful adjacent signal: they represented 20% of payment count but 60% of payment value, which explains why invoice links, bank payments, and online bill-pay experiences need their own scorecard.
• Bank-account-number payments and online banking bill pay covered 25% and 26% of bills respectively, making bank-based options relevant even in a card-heavy region.
Canada: online purchases, mobile payment, and card-linked wallet behavior
Canada should not be folded into a generic North American story. Bank of Canada research shows online purchases represented 23% of all Canadian purchases in 2024, while mobile payments accounted for almost 5%. That combination suggests a market where remote buying is mainstream, but mobile-first payment behavior still has room to grow.
For a Canadian seller, the practical question is not whether to copy a U.S. payment stack. It is whether card, wallet, bank-linked, Interac-related, and invoice-payment behavior create a different completion pattern by customer type and device.
• Online purchase share gives Canadian merchants a clear reason to track remote conversion separately from in-store card behavior.
• Mobile payment share remains smaller than total online purchase share, so saved credentials, wallet placement, and mobile trust cues should be tested rather than assumed.
Europe and the euro area: non-cash scale, cards, transfers, e-money, and instant rails
Europe requires a split view because the euro area combines very large non-cash volume with multiple payment behaviors. The ECB reported 77.7 billion euro-area non-cash payment transactions in H1 2025, worth €116.0 trillion. Cards represented 57% of transaction count, but credit transfers and instant transfers remain important because value movement, business payment, and bank authentication can follow different paths from low-value card purchases.
That is why a European online payment plan should not be built from card share alone. A checkout may need cards for everyday purchases, A2A or transfer methods for local expectations, and careful authentication handling where regulation or bank flows create extra steps.
• Card share is high enough to require strong card authorization, fraud controls, and refund handling.
• Credit transfers and instant transfers matter most when payment certainty, bank movement, or local bank habits are part of the buying decision.
• Remote card transactions should be tracked separately from in-person cards because ecommerce authentication, fraud review, and issuer response can change the outcome after the customer clicks pay.
United Kingdom: mature card behavior with Faster Payments and mobile banking expectations
The U.K. is a mature digital payment market, but maturity does not mean simplicity. Card usage, mobile banking, wallet behavior, and Faster Payments familiarity can all affect how a customer expects an online payment to work. A card-first checkout may still be right for many purchases, while invoice-style, high-value, or service payments may benefit from bank-transfer or pay-by-bank options.
For U.K. companies, the stronger planning method is to compare use cases rather than choose one dominant rail. A lower-value ecommerce order, a recurring subscription, a professional invoice, and a marketplace payout may each need a different online payment path.
• Faster Payments familiarity matters because customers and businesses can become accustomed to quick bank movement rather than uncertain multi-day timing.
• As cash usage declines, online and mobile reliability matters more for everyday purchases, bills, subscriptions, and service payments.
India and Brazil: when domestic rails become online payment infrastructure
India and Brazil are the clearest reminders that online payments are local. India’s UPI scale is a transaction-volume story: the rail crossed 2,000 crore monthly transactions for the first time in August 2025 and processed roughly 22,000 crore transactions during 2025 reporting. A payment method with that level of repeat use is not an alternative option for an India-facing experience; it is often core infrastructure.
Brazil’s Pix tells a different but equally important story. Pix can support everyday consumer payment behavior, QR flows, merchant transactions, and high-value business movement. B2B Pix represented only 3% of Pix transaction count but 46% of Pix value, and the average B2B Pix transaction reached BRL 5,420. That gap between count and value is exactly why payment teams should separate consumer convenience from business-settlement use cases.
• UPI should be placed early in India-facing payment design because customers may see it as the normal path rather than as a local add-on.
• Pix QR usage matters because QR flows can connect ecommerce, bill payment, in-person payment, and embedded payment journeys.
• B2B Pix should be evaluated by value movement and reconciliation quality, not only consumer transaction count.
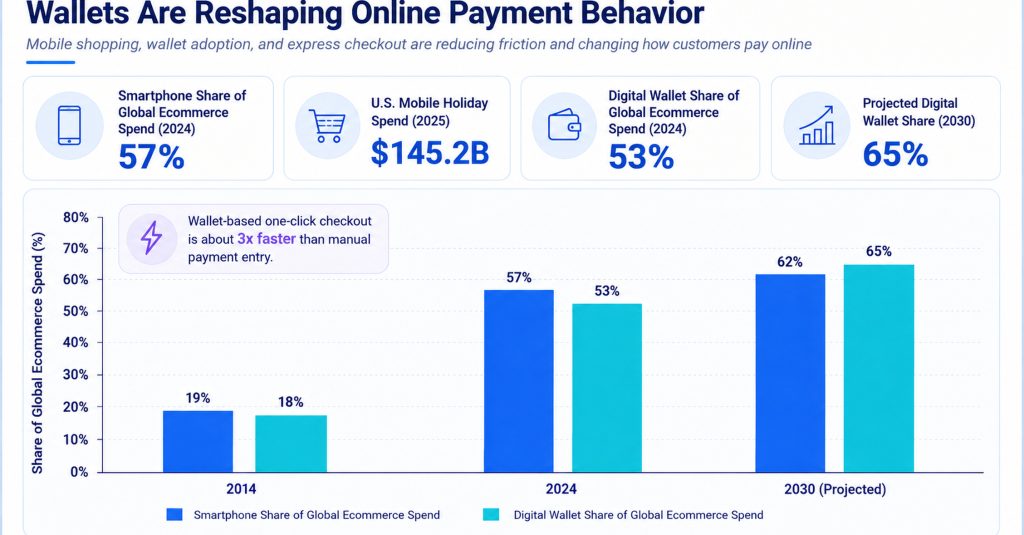
Figure 3. UPI and Pix should be compared as country-scale payment rails, but their adoption stories differ: UPI is a massive volume rail, while Pix shows large-value B2B use alongside consumer ubiquity.
China, APAC, Poland, and Latin America: local method dominance can be decisive
China, Poland, and Latin America show why payment localization cannot stop at the largest English-speaking markets. China’s ecommerce payment mix is wallet-led, with digital wallets representing more than 80% of online transaction value in 2024. Poland shows how A2A can dominate a specific European market, with A2A representing about 70% of ecommerce payment value and projected to rise to 78% by 2030. Across Latin America, local cards, installments, Pix-style instant payment, cash alternatives, and country-specific bank transfers can matter as much as global wallets.
| Market | Payment behavior to watch | Business implication |
|---|---|---|
| United States | Cards remain central; wallets and remote payments keep growing. | Optimize card approval while testing wallet and payment-link performance. |
| Canada | Online purchases are 23% of purchases; mobile payments are nearly 5%. | Do not assume U.S. behavior covers Canadian payment expectations. |
| Euro area | 77.7B non-cash transactions and 57% card transaction share in H1 2025. | Measure cards, transfers, e-money, and instant payments separately. |
| India | UPI crossed 2,000 crore monthly transactions. | Treat UPI as core infrastructure for Indian online payment design. |
| Brazil | B2B Pix is 3% of count but 46% of value. | Separate consumer Pix from high-value business Pix use cases. |
| Poland | A2A represents about 70% of ecommerce value. | A card-first checkout can miss local payment expectations. |
| China | Wallets represent more than 80% of ecommerce transaction value. | Wallet-first design is a market requirement, not a bonus. |
Regional planning rule A regional payment plan should identify the leading local method, the fallback method, the method with the highest approval rate, the method with the lowest support burden, and the method that reconciles most cleanly. Those may not be the same payment option.
Cards, Authorization, And False Declines
Cards are sometimes described as the old online payment layer, but that misses the point. Even where wallets lead, cards often fund wallet transactions. Even where bank-based rails grow, cards remain important for subscriptions, ecommerce, travel, digital services, and cross-border payment. Card performance therefore still matters, especially approval quality and false-decline management.
A customer can choose the right product, complete the form, and press the payment button, then disappear because the authorization fails. That is why online payment teams should measure approval rate, decline reason, retry success, issuer response, routing, fraud-review outcomes, and fallback conversion as part of payment performance.
Authorization and decline benchmarks
• Checkout.com reports $50.7 billion in false-decline losses across the U.S., U.K., France, and Germany, showing how approval quality can erase ready-to-pay demand.
• False-decline losses rose from about $20 billion in 2019 to $50.7 billion in the later study period, making payment optimization a revenue-protection issue.
• After one false decline, 45% of consumers said they would not retry a second payment, which means fallback design cannot rely on customer patience.
• A false decline can damage loyalty too, with 42% saying they would never return to that retailer after the experience.
• Checkout abandonment data shows 8% of U.S. shoppers leave because their card is declined, a smaller percentage than cost surprises but still a direct payment failure.
• Checkout.com has reported that some merchants see up to 5% of payments wrongly declined as fraud, which can be significant in high-volume online businesses.
• For U.S. consumer behavior, credit cards account for 35% of payment count and debit cards for 30%, reinforcing why card acceptance and card performance still matter.
• Cards represent 75% of purchase transactions by number in U.S. consumer data, making purchase-level approval and fraud management central to payment completion.
Card-performance readout The practical goal is not simply to push every customer toward a new method. A strong online payment system improves card authorization where cards are expected, offers wallets or bank options where they reduce friction, and gives the customer a clear fallback path when the first method fails.
Digital Wallets, Mobile Payments, And Express Checkout Behavior
Digital wallets are both a payment method and a usability shortcut. They can shorten card entry, reduce mobile typing, support saved credentials, and create a familiar trust layer. That matters because mobile screens make payment friction more costly: every extra field, keyboard issue, address problem, or authentication error can interrupt the moment when the customer is ready to pay.
Wallet and mobile-payment signals
• Wallets represented 53% of global ecommerce spend in 2024, making them the largest global online payment category by value.
• Worldpay projects global wallet share of ecommerce value to reach 65% by 2030, strengthening the case for wallet-first checkout review.
• Wallet ecommerce value reached roughly $3.6 trillion globally in 2024, making wallet payment performance material rather than experimental.
• Wallet share at POS reached 32% globally, which matters because in-person wallet habits can shape online payment expectations.
• Smartphones accounted for 57% of global ecommerce spend in 2024, up from 19% in 2014.
• U.S. mobile phone payments averaged 11 per month in 2024, compared with 4 per month in 2018.
• Canadian mobile payments accounted for almost 5% of purchases, a smaller share than online purchases but still enough to influence mobile-payment design.
• China’s wallet share above 80% of ecommerce value shows what happens when wallet behavior becomes the primary online payment habit in a major market.
• In the U.K., growing wallet and mobile-banking behavior should be evaluated alongside card conversion and Faster Payments expectations.
• Wallet payment should be judged on completion, approval, repeat purchase, refund behavior, support tickets, and fraud outcomes, not only button clicks.
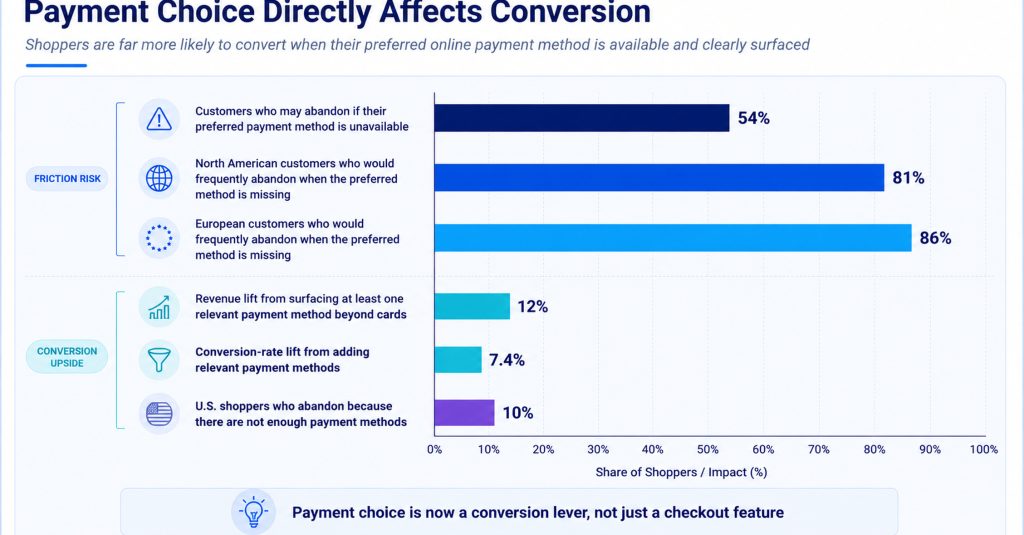
Figure 4. Consumer payment behavior shows that online payment planning must connect cards, remote purchases, mobile behavior, and regional non-cash payment habits.
Mobile-wallet interpretation The wallet question is not just whether Apple Pay, Google Pay, PayPal, or a local wallet is available. Businesses should also review wallet button placement, mobile conversion, authorization rates, return-customer completion, refund handling, and whether wallet-funded transactions behave differently from manually entered cards.
A2A, Pay By Bank, UPI, Pix, ACH, And Instant Payments
Bank-based online payments are easy to oversimplify. ACH in the U.S., online banking bill pay, open-banking pay-by-bank, UPI in India, Pix in Brazil, Faster Payments in the U.K., SEPA instant transfers in Europe, and other domestic systems can all be described as account-based payment. But each has different customer habits, payment confirmation, settlement, refund, dispute, and reconciliation characteristics.
For businesses, the main decision is not whether account-to-account payment is “better” than cards. It is where it fits. A2A may be useful for invoice payment, high-value purchases, bill pay, subscription cost control, or markets where bank transfer is already familiar. Cards and wallets may still be better for speed, international acceptance, chargeback expectations, and consumer familiarity in other contexts.
Bank-based and instant-payment benchmarks
• Account-to-account ecommerce spend is projected to reach $936 billion by 2030, a large increase from $152 billion in 2014.
• Brazil’s Pix-linked A2A ecommerce value increased from $3.6 billion in 2020 to $35.3 billion in 2024.
• Poland’s ecommerce payment mix is dominated by A2A at about 70%, with projected growth to 78% by 2030.
• India’s UPI crossed 2,000 crore monthly transactions in August 2025, giving Indian online payment teams a domestic real-time rail at consumer scale.
• During 2025 reporting, UPI processed roughly 22,000 crore transactions, showing the depth of repeated use rather than only a one-month spike.
• The ACH Network processed 35.2 billion payments in 2025, worth $93.0 trillion, giving bank-based payments major U.S. scale even outside checkout-focused ecommerce.
• Same Day ACH reached 1.4 billion payments and $3.9 trillion in value in 2025, giving faster bank payment a larger operating base.
• B2B ACH volume reached 8.08 billion payments in 2025, while B2B ACH value reached $63.11 trillion.
• Euro-area instant transfers matter because they can reduce the delay between authorization and confirmed bank movement in markets where transfer-based payments are familiar.
• For bill payment behavior, U.S. consumers used bank-account-number payment for 25% of bills and online banking bill pay for 26%.
| Rail / method | Where it can fit | What to measure |
|---|---|---|
| ACH / Same Day ACH | Invoice payment, bill pay, recurring payment, U.S. bank transfers | Settlement timing, returns, authorization, reconciliation. |
| UPI | India ecommerce, mobile, P2P, P2M, QR, service payments | Completion, QR success, bank response, support tickets. |
| Pix | Brazil ecommerce, QR, P2P, P2B, B2B transfer | Use case, average value, confirmation speed, refund flow. |
| Pay by bank / open banking | Markets where account-based online payment is familiar | Customer adoption, conversion, authentication, cost, disputes. |
| Faster Payments / instant transfers | U.K./European bank-transfer and account-based payment flows | Payment confirmation, fraud checks, settlement, reconciliation. |
BNPL, Financing, And Online Payment Choice
Buy now, pay later is part of online payment choice, but it should be treated differently from a wallet, card, or bank payment. BNPL can influence affordability perception and order size. It can also change fee structure, returns, customer support, dispute behavior, and credit risk. That makes it a payment-method and financing decision at the same time.
• Worldpay data shows BNPL online spend growing from about $2.2 billion in 2014 to $342 billion in 2024.
• Financial Times coverage of Worldpay data reported global BNPL spending of $316 billion in 2023 after 18% annual growth.
• The U.S. accounted for roughly $95 billion of BNPL spend in that reporting, making it a major market even where cards remain strong.
• Adobe holiday-period reporting cited U.S. BNPL spend of $20.0 billion from Nov. 1 to Dec. 31, 2025.
• That holiday BNPL spend was reported as 9% higher year over year, showing continued seasonal relevance.
• A 2024 Journal of Retailing study found BNPL adoption increased online order size by 6.42%, a useful conversion and basket-size signal.
• BNPL share differs by market, so a financing option that fits one country may not be a priority in another.
• BNPL should be evaluated with return rate, refund timing, dispute rate, provider fees, customer quality, repeat purchase, and support contacts, not only checkout conversion.
BNPL decision rule BNPL is strongest when it increases profitable completed demand rather than simply shifting payment timing. A useful scorecard compares order value, conversion, provider cost, refunds, disputes, and customer lifetime value against cards, wallets, and bank-based methods.
Online Payment Fraud, Security, And Consumer Trust
Online payment trust has two sides. Fraud controls protect the business, but over-blocking can reject legitimate customers. Security messaging reassures some customers, but too much friction can create abandonment. The right payment system has to reduce fraud without making payment feel uncertain, risky, or overly difficult.
Risk and trust signals to track
• Baymard abandonment data shows 19% of U.S. shoppers leave because they do not trust the site with card information.
• Checkout abandonment also includes 8% leaving because their card was declined and 10% leaving because there were not enough payment methods.
• Checkout.com reports $50.7 billion in false-decline losses across four major markets, making risk tuning a revenue issue.
• After a false decline, 45% of consumers said they would not retry a second payment and 42% said they would never return to that retailer.
• Visa Acceptance/Cybersource fraud research covers more than 1,000 ecommerce merchants across more than 35 countries, showing how international online fraud practices vary.
• Merchant/payment-fraud research has estimated cumulative online-payment fraud losses of $343 billion between 2023 and 2027.
• One merchant fraud benchmark reported revenue lost to payment fraud falling from 3.6% in 2022 to 2.9% in 2023, but even a smaller percentage can be material at scale.
• Mastercard-sponsored coverage has estimated sellers could lose $15 billion to fraudulent chargebacks in 2025.
• Chargeback volume in the same coverage was expected to rise from $33.79 billion to $41.69 billion by 2028.
• Government taxes and fees show how payment cost and surcharge visibility can affect behavior, with credit-card surcharge shares around 21% in one consumer-payment dataset.
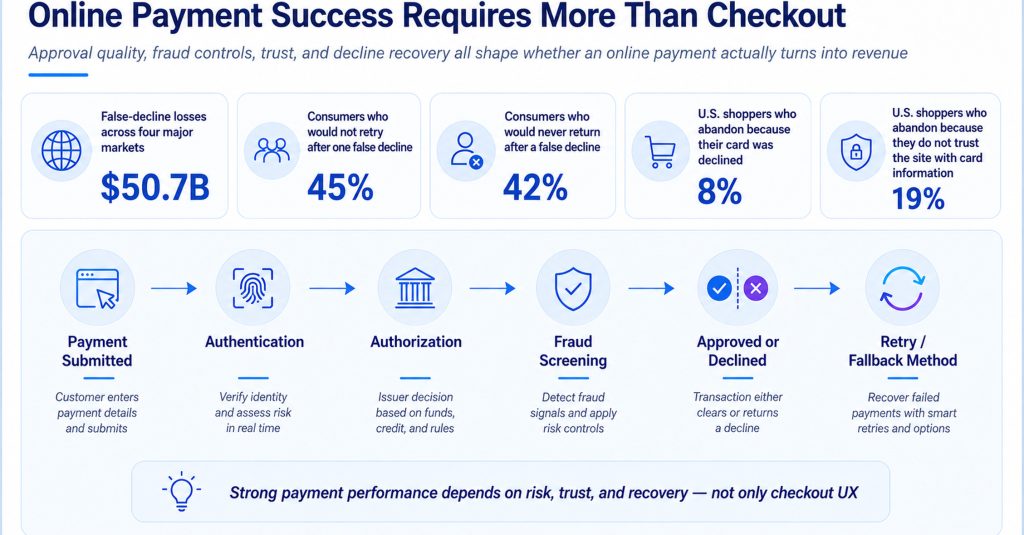
Figure 5. Online payment risk should be measured across missing methods, declines, trust concerns, false declines, fraud, and customer retry behavior.
Risk interpretation A fraud system that blocks too much demand can look successful in a fraud dashboard while hurting revenue. A checkout that offers more methods but does not manage risk can create losses. The practical answer is a combined scorecard: approval, false decline, fraud, chargeback, authentication, fallback, and support outcomes by payment method and market.
What Online Payment Data Means For Small Businesses
Small businesses often do not need a global payments architecture, but they still need the same kind of thinking at a smaller scale. A local service provider may use invoice payment links. A retailer may need wallet buttons on mobile. A subscription business may need retry logic for failed cards. A consultant working with international clients may need bank transfer, card, or wallet options by region. The data matters because payment friction shows up as delayed cash, support work, abandoned orders, or failed recurring revenue.
The most useful small-business approach is to start with the customer journey. Is the customer paying an invoice, buying online, renewing a subscription, paying a deposit, or settling a service balance after the work is complete? Each situation points to a different payment mix.
Practical payment decisions for smaller teams
• An online seller should review wallet adoption because global wallet share reached 53% of ecommerce value, but it should also check whether its actual mobile visitors use the wallet button.
• A service business using payment links should compare cards, ACH, and wallet payments because the same invoice can be paid through multiple online rails.
• A subscription business should pay close attention to failed payments because a single decline can turn into churn if retry and customer-update flows are weak.
• A company selling into Canada should not assume U.S. behavior fully applies when online purchases represent 23% of Canadian purchases and local bank/payment habits differ.
• A business selling into India needs UPI planning because monthly transaction volume above 2,000 crore means customers often expect that rail.
• A company selling into Brazil should consider Pix if its customers expect instant bank payment, especially when Pix-linked A2A ecommerce grew from $3.6 billion to $35.3 billion over four years.
• A high-value B2B seller should not treat Pix, ACH, or pay-by-bank as consumer-only options when B2B Pix represents 46% of Pix value and B2B ACH value reaches $63.11 trillion.
• A merchant expanding into Europe should review country-level A2A behavior because Poland’s ecommerce A2A share near 70% is very different from a card-first assumption.
• A business with international card declines should monitor false-decline risk because 45% of consumers may not retry after a false decline.
• A company with a high mobile share should track mobile completion separately because smartphone ecommerce share reached 57% globally.
| Business situation | Payment question | Useful metric |
|---|---|---|
| Mobile ecommerce | Are wallet and saved-payment paths visible enough? | Wallet conversion, mobile completion, payment time. |
| Invoice payment links | Which method gets paid fastest with fewest exceptions? | Time to paid, fee, failed payment, reconciliation. |
| Subscriptions | What happens after a failed renewal payment? | Retry success, update rate, churn, support tickets. |
| Regional selling | Does the method mix match local expectation? | Conversion by country and payment method. |
| High-value B2B payment | Can bank-based methods reduce friction or cost? | Approval, settlement, return rate, remittance quality. |
A Regional Playbook For Online Payment Localization
The regional data should change how a business plans online payment rollout. A company selling in one country can choose a narrow payment stack and refine it over time. A company selling across regions needs a payment map. The map should show which methods are expected, which methods fund wallets, which bank rails are trusted, which methods create support burden, and which options are likely to raise completion without damaging margin.
A practical regional playbook starts with a simple assumption: customers do not experience online payments as “global payment infrastructure.” They experience a familiar button, bank prompt, QR code, wallet sheet, transfer option, card form, or invoice link. The regional statistics help teams decide which of those paths deserves priority in each market.
How regional statistics should change payment design
| Regional signal | Question to ask before rollout | Metric to review after launch |
|---|---|---|
| Wallet-heavy market | Is the wallet button visible early enough on mobile? | Wallet conversion, repeat completion, authorization. |
| Card-heavy market | Are issuer declines and fraud rules tuned well? | Approval rate, false decline, retry success. |
| A2A-heavy market | Does the bank payment flow feel familiar and trusted? | A2A completion, authentication failure, support tickets. |
| Instant rail market | Can the business reconcile fast confirmation cleanly? | Settlement timing, reference quality, refunds. |
| BNPL-friendly market | Does financing raise profitable orders or only shift risk? | AOV, returns, fees, disputes, repeat purchase. |
| Cross-border market | Are local methods, currency, tax, and refunds aligned? | Country conversion, refund time, failed payment reasons. |
Regional playbook rule The strongest regional payment decision is usually not “add more methods.” It is “add the right method and measure the whole payment outcome.” That outcome includes completion, authorization, cost, settlement, reconciliation, refund behavior, customer support, and fraud risk.
The regional playbook should begin with the question each market actually answers. North America asks whether card and wallet performance are both strong enough. Canada asks whether remote purchases and mobile habits should be measured separately. Europe asks when cards, transfers, and instant rails belong in the same journey. India asks whether UPI is visible enough. Brazil asks whether Pix should serve consumer checkout, business settlement, or both.
• A North American checkout should protect card performance because U.S. credit and debit cards together account for 65% of consumer payments by number.
• A U.S. invoice-payment flow should not ignore bank-based options when bank-account-number payments and online banking bill pay each account for about a quarter of bill-payment activity.
• A Canadian payment flow should track online purchases separately because remote purchases represent 23% of Canadian purchases while mobile payment share is still much smaller.
• A euro-area rollout should not treat cards as the whole story even though cards represent 57% of non-cash transaction count.
• UPI, Pix, Poland’s A2A-heavy ecommerce mix, and China’s wallet-led ecommerce behavior all show why country payment habits can be more important than global averages.
Regional payment planning is also an internal operations issue. If a new method raises conversion but creates refund confusion, support tickets, reconciliation gaps, or slow settlement, the business has not finished the localization work. The better measure is completed payment quality: method availability, authorization, fraud, fee, support effort, settlement, and repeat purchase by country.
How Online Payment Performance Changes By Business Model
The best payment mix also changes by business model. A retailer, SaaS company, service provider, marketplace, digital product seller, and B2B invoice portal do not need identical payment priorities. The same global statistics can lead to different decisions depending on whether the business is trying to reduce cart abandonment, speed invoice payment, prevent subscription churn, or support regional customers.
Business model examples
| Regional signal | Question to ask before rollout | Metric to review after launch |
|---|---|---|
| Wallet-heavy market | Is the wallet button visible early enough on mobile? | Wallet conversion, repeat completion, authorization. |
| Card-heavy market | Are issuer declines and fraud rules tuned well? | Approval rate, false decline, retry success. |
| A2A-heavy market | Does the bank payment flow feel familiar and trusted? | A2A completion, authentication failure, support tickets. |
| Instant rail market | Can the business reconcile fast confirmation cleanly? | Settlement timing, reference quality, refunds. |
| BNPL-friendly market | Does financing raise profitable orders or only shift risk? | AOV, returns, fees, disputes, repeat purchase. |
| Cross-border market | Are local methods, currency, tax, and refunds aligned? | Country conversion, refund time, failed payment reasons. |
Regional playbook rule The strongest regional payment decision is usually not “add more methods.” It is “add the right method and measure the whole payment outcome.” That outcome includes completion, authorization, cost, settlement, reconciliation, refund behavior, customer support, and fraud risk.
A retailer, SaaS company, professional-services firm, marketplace, digital product seller, and B2B invoice portal may all accept “online payments,” but they are not solving the same problem. The retailer cares about mobile conversion and wallets. The SaaS business cares about renewal recovery. The services firm cares about invoice links and time-to-paid. The marketplace has to separate buyer payment from seller payout.
• A mobile-first retailer should start with wallet and card performance because smartphones now represent 57% of global ecommerce spend and wallets hold 53% of global ecommerce value.
• A digital subscription business should review failed-payment recovery because a decline can turn into churn if the customer never updates the payment method.
• A professional-services firm using invoice links should compare card, ACH, and wallet payments by time-to-paid rather than only by fee percentage.
• A B2B seller should not assume bank payments are niche when B2B ACH value reached $63.11 trillion and B2B Pix represents 46% of Pix value in Brazil.
• A marketplace should measure buyer method and seller payout separately because customer checkout and merchant settlement have different risk, timing, and reconciliation needs.
• A cross-border ecommerce brand should judge payment methods country by country because Poland, China, India, Brazil, Canada, the U.S., and the euro area all point to different customer expectations.
Consider a small online retailer selling into the U.S., Canada, and the U.K. Its payment stack may begin with cards and wallets, then add bank-based options where customer demand and transaction value justify them. The team should not judge success only by method adoption. It should compare completion, approval, support contact, refund behavior, and repeat purchase after each change.
Regional Implementation Examples For Online Payment Teams
The regional statistics become more useful when they are tied to business decisions. A company rarely changes its whole payment stack at once. It usually starts with one market, one payment method, one customer segment, or one pain point. The examples below show how the same data can guide different online payment choices without turning every market into a long checklist.
How a business might use the regional data
• A U.S.-focused ecommerce store might prioritize card approval and wallet visibility first because cards still carry a large share of payment behavior and wallet use often depends on card funding.
• A Canadian seller could compare card, Interac-related habits, and mobile completion because online purchases make up 23% of purchases while mobile payments are still under 5%.
• A euro-area merchant should test cards and transfer-based methods separately because 77.7 billion non-cash transactions do not all behave the same way operationally.
• A U.K. service business could add pay-by-bank or bank-transfer options for invoice-style payment while still measuring card and wallet completion for lower-friction customer journeys.
• An India-facing platform should not bury UPI deep in the checkout when a rail with more than 2,000 crore monthly transactions has become familiar to customers.
• A Brazil-facing merchant should treat Pix as more than a consumer convenience because B2B Pix carries 46% of value and an average B2B transaction of BRL 5,420.
• A seller entering Poland should review A2A availability early because an ecommerce market with roughly 70% A2A share may penalize a card-only payment design.
• A business entering China should design around wallet-led behavior because online wallet share above 80% changes what customers consider normal.
• A marketplace should separate buyer payment method from seller payout method because wallet-heavy buyer behavior does not automatically decide the best payout rail.
• A subscription company should measure payment failure by method and region because renewal recovery depends on local bank response, card updater availability, customer communication, and fallback options.
These examples also explain why online payment localization should be staged. A business can launch a local method, measure a few weeks of completion and support data, then decide whether the method is truly improving payment performance. A method that adds five points of conversion but doubles refund tickets or creates reconciliation gaps may need operational work before it is scaled widely. A method that seems small by share but supports large invoices, repeat customers, or a key country can be strategically important even if it is not the global leader.
Implementation rule Regional payment work should move from evidence to controlled rollout. Identify the local expectation, launch the method where it solves a clear problem, measure completion and cost, then decide whether to expand. That keeps regional payment strategy from becoming either under-localized or over-complicated.
Online Payment Metrics Leaders Should Track
The best online payment scorecard separates customer choice from technical performance and financial outcome. A method can be popular but expensive. A method can be cheap but unfamiliar. A method can approve well in one country and fail in another. A single blended payment conversion rate hides those differences.
| Metric | Why it matters |
|---|---|
| Payment-method mix | Shows whether customers choose cards, wallets, BNPL, bank payments, ACH, UPI, Pix, or local methods. |
| Payment completion rate | Measures successful payment after the customer starts the payment step. |
| Approval rate | Shows whether submitted payments are actually authorized. |
| Decline reason mix | Separates insufficient funds, fraud rules, issuer declines, authentication, and technical errors. |
| False-decline rate | Captures legitimate customers wrongly rejected by risk or authorization systems. |
| Wallet uptake | Shows whether wallet availability is visible and useful to mobile and returning customers. |
| A2A / bank-payment share | Shows whether account-based methods are gaining traction by market or invoice type. |
| Fraud and chargeback rates | Protects margin while checking whether controls are rejecting good demand. |
| Refund and support workload | Shows the operational cost of each method after payment. |
| Regional conversion | Prevents global averages from hiding local payment-method mismatch. |
• A useful payment dashboard should show method mix by country, not only total online sales, because wallet, card, A2A, UPI, Pix, and BNPL expectations vary sharply by market.
• Payment completion should be separated from checkout completion because a customer may submit the form and still fail authorization.
• Approval rate should be paired with fraud rate because a higher block rate may reduce fraud while also rejecting good customers.
• False-decline tracking matters because 45% of consumers may not retry after one false decline.
• Support tickets by payment method can reveal problems that conversion data misses, especially for bank authentication, refund timing, failed wallet attempts, or BNPL questions.
• Refund timing should be measured because cards, wallets, BNPL, and bank payments can create different customer expectations after the sale.
• Reconciliation quality should be part of the scorecard when payment links, bank transfers, ACH, Pix, or UPI payments need to match invoices, subscriptions, or customer accounts.
• Regional payment experiments should include a control period because a new local method may shift demand from another method rather than create new completed orders.
Scorecard principle Online payment data should answer a business question, not only fill a dashboard. Which method completes the most profitable orders? Which method creates the fewest failed payments? Which market needs a local method? Which decline reason is preventable? Which payment path creates support tickets? Those answers are more useful than a single blended conversion number.
Online Payments Statistics FAQ
Common questions
• What are online payments?
Online payments are digital payments completed remotely or through an online flow. They include cards, digital wallets, bank payments, ACH, pay by bank, UPI, Pix, BNPL, payment links, subscription payments, and invoice payment portals.
• How large is the online payments market?
Worldpay data puts global digital payment value across ecommerce and POS at $18.7 trillion in 2024, with a projection above $33.5 trillion by 2030. Global ecommerce spend reached about $6.8 trillion in 2024.
• What is the most important online payment method?
There is no single global answer. Digital wallets represent 53% of global ecommerce value, but cards remain central in many markets, while A2A dominates specific countries such as Poland and domestic rails like UPI and Pix shape India and Brazil.
• Why do regional payment stats matter?
Regional stats matter because local payment expectations can determine completion. China is wallet-led, Poland is heavily A2A, India relies on UPI at massive scale, Brazil has Pix, and Canada has a different mix from the U.S.
• Are cards still important for online payments?
Yes. U.S. consumer data shows credit cards at 35% of all payments by count and debit cards at 30%. Even when wallets grow, many wallet payments are still funded by cards.
• How do false declines affect online payments?
False declines can remove revenue after a customer is ready to pay. Checkout.com reports $50.7 billion in false-decline losses across the U.S., U.K., France, and Germany, and 45% of consumers said they would not retry after one false decline.
• Should small businesses offer more payment methods?
Small businesses should offer the methods their customers actually use, then measure completion, fees, settlement, disputes, and support workload. More methods are useful only when they improve completed profitable payment.
• Which metrics matter most for online payments?
The most useful metrics include payment-method mix, payment completion, approval rate, decline reasons, false declines, fraud, chargebacks, wallet uptake, A2A share, refunds, support tickets, and regional conversion by method.
Final Takeaway
Online payments have become a regional, technical, and operational system. The statistics show huge global growth, but they also show why no single method or global average is enough. Wallets dominate global ecommerce value, cards still shape approval and funding in many markets, bank-based rails are growing, and country systems such as UPI and Pix can define customer expectation inside their home markets.
The best online payment strategy starts with the customer and then measures the full payment outcome. Can the customer use a trusted method? Does the payment complete? Is the transaction approved? Does fraud control block good demand? Does the method reconcile cleanly? Does the refund process work? Does the method reduce support workload or create it?
For business leaders, the practical goal is not to add every payment option. It is to build a payment mix that is trusted, localized, measurable, and financially controlled. That means strong card performance where cards matter, wallet speed where mobile convenience matters, bank-based options where local rails are expected, clear fallback paths when payment fails, and a scorecard that treats payment completion as part of revenue, cash flow, and customer experience.


