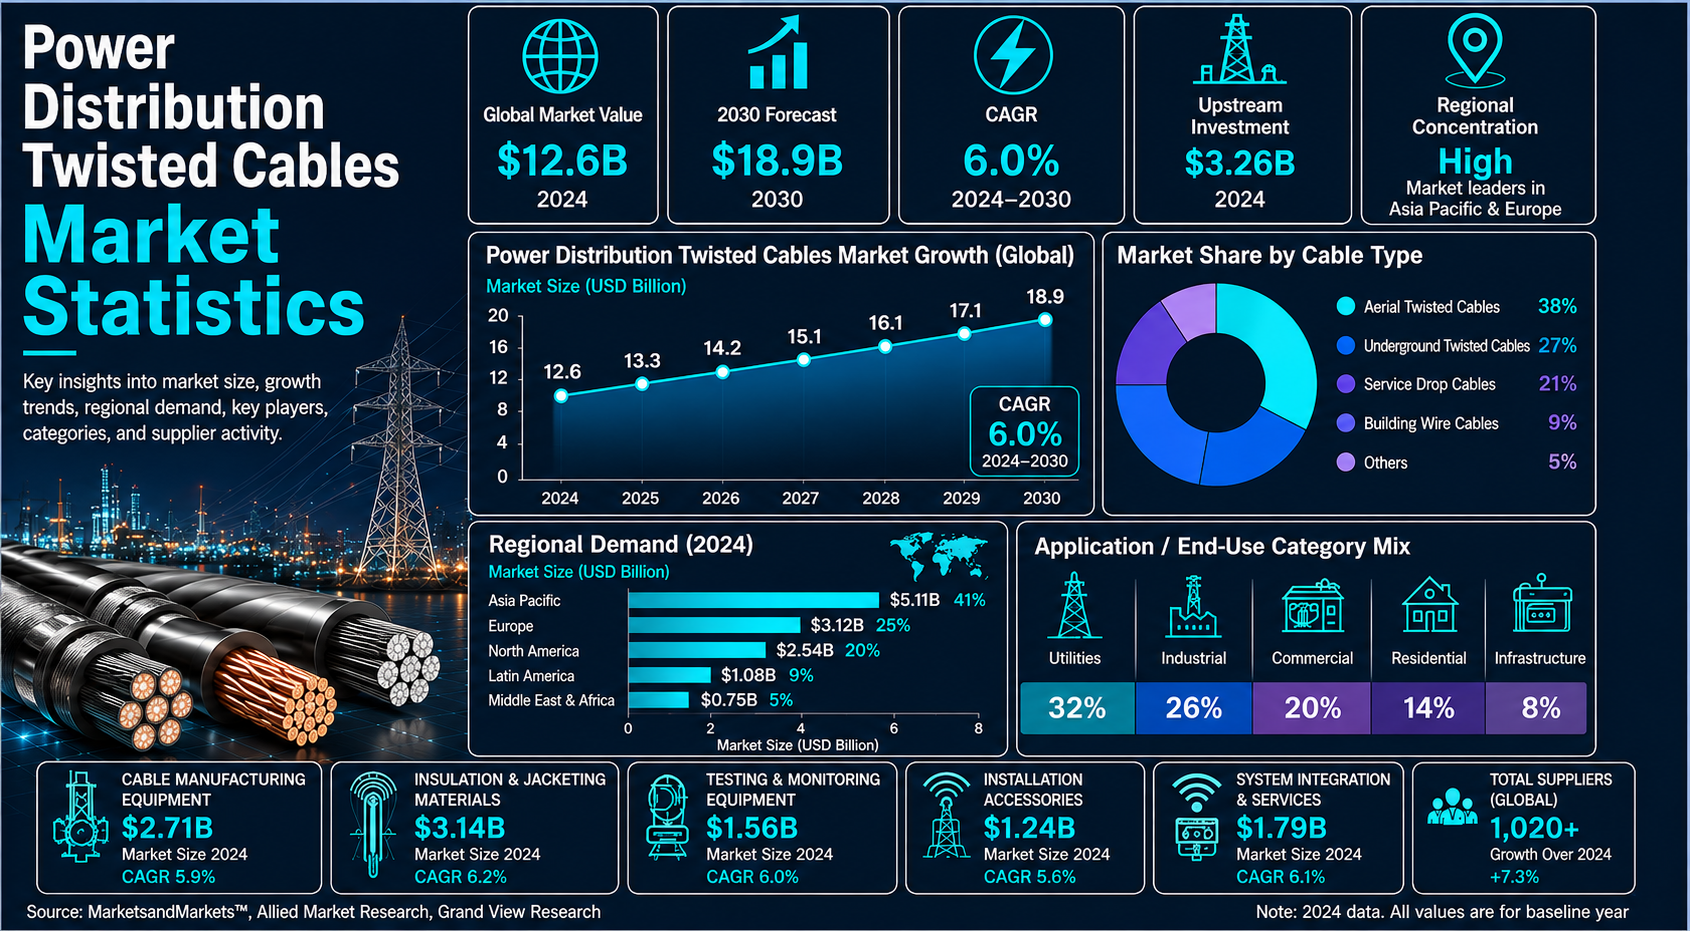
Power distribution twisted cables sit inside one of the most important infrastructure shifts in the electricity economy: the need to move more power through safer, more reliable, and more efficient distribution networks. They are not only cable products. They are part of the last-mile grid that connects homes, factories, farms, renewable assets, charging points, and commercial buildings to usable electricity.
The market is becoming more important because electricity demand is rising at the same time that utilities are dealing with aging distribution networks, high technical losses, weather exposure, renewable connection pressure, and new load from electric vehicles and data-heavy buildings. Twisted and bundled cable systems can support safer overhead distribution, reduce some installation complexity, improve conductor organization, and help utilities modernize low-voltage and medium-voltage routes without treating every upgrade as a completely new network design.
The strongest market statistics show a steady infrastructure cycle rather than a short-term demand spike. The global power distribution twisted cables market was estimated at USD 11.64 billion in 2024, while one forecast places it near USD 15.79 billion by 2030 and another estimate projects USD 16.16 billion by 2031. Those values become more meaningful when viewed beside global grid investment, renewable additions, rural electrification gaps, T&D losses, and material-cost pressure.
Executive Power Distribution Cable Benchmarks
These are the statistics that frame the market. They show the size of the opportunity, the pace of expected growth, and the infrastructure forces that make distribution cable demand different from a simple construction-material category.
The numbers that define the cable market
- The global power distribution twisted cables market was estimated at USD 11.64 billion in 2024.
- Grand View Research projects the market at USD 12.23 billion in 2025 and USD 15.79 billion by 2030.
- The same forecast implies a 5.2% CAGR for power distribution twisted cables from 2025 to 2030.
- Mordor Intelligence reports a 2025 market size of USD 11.35 billion and a 2031 forecast of USD 16.16 billion.
- Mordor’s longer forecast implies a 7.32% CAGR from 2026 to 2031, giving the article a higher-growth comparison point.
- A derived GVR-based forecast path places the market near USD 12.88 billion in 2026, USD 13.55 billion in 2027, USD 14.26 billion in 2028, and USD 15.00 billion in 2029.
- The copper conductor segment had an implied 2025 revenue of about USD 7.707 billion when reported share assumptions were applied to the USD 11.35 billion market base.
- The low-voltage segment had an implied 2025 revenue of about USD 5.039 billion, showing why last-mile distribution remains central to the market.
- Overhead aerial bundled systems had an implied 2025 revenue of about USD 5.641 billion, linking twisted cable demand directly to overhead distribution upgrades.
- Global electricity demand increased by 4.3% in 2024, adding 1,080 TWh of consumption in a single year.
- China alone added more than 550 TWh of electricity consumption in 2024, making grid expansion a major cable-demand signal.
- Solar PV additions reached about 550 GW in 2024, while total renewable additions were roughly 700 GW.
- Digital-era loads, EV charging, building electrification, and rural access programs all increase the need for reliable distribution infrastructure.
- The global electricity-access rate was 91.6% in 2023, which still leaves large access gaps in countries where last-mile distribution expansion is a core development need.
The executive benchmark set should therefore be read as a demand map, not only a forecast list. Revenue growth depends on where utilities have approved distribution upgrades, where local networks need reinforcement, and where electrification is creating new service connections. A strong twisted-cable outlook combines macro demand with project-level signals such as feeder additions, low-voltage network expansion, aerial bundled conductor programs, and utility replacement cycles.
|
Editorial readout The headline numbers point to a market shaped by five connected forces: grid expansion, replacement of aging distribution assets, renewable and EV load growth, rural and urban electrification, and cable material economics. A useful market view should not treat CAGR as the whole story. It should connect product demand with utility spending, country-level infrastructure needs, and the practical economics of conductor materials. |
Why Distribution Cable Demand Now Carries Grid-Scale Stakes
Distribution cable demand matters more when electricity systems are expanding and becoming more complex. Utilities are not only connecting new customers. They are also reinforcing feeders, reducing losses, improving safety, connecting renewable generation, preparing for higher peak loads, and replacing older assets that were built for a slower electricity economy.
Grid expansion and electrification benchmarks
- Global electricity demand grew by 4.3% in 2024, compared with average annual growth of 2.7% from 2010 to 2023.
- Electricity consumption increased by 1,080 TWh in 2024, which creates pressure across generation, transmission, and distribution networks.
- Advanced economies increased electricity consumption by 230 TWh in 2024, reversing the weaker demand pattern seen in some earlier years.
- Southeast Asia electricity consumption jumped by more than 7% in 2024, making the region important for urban and industrial distribution upgrades.
- The European Union recorded about 1.5% electricity-consumption growth in 2024, while renewable integration continued to reshape network needs.
- Global renewable capacity additions were near 700 GW in 2024, with solar accounting for the largest share of new capacity.
- Solar PV additions of 550 GW represented about 78.6% of renewable additions in 2024, reinforcing the need for local connection and distribution planning.
- Wind additions of 120 GW represented about 17.1% of renewable additions in 2024, adding another layer of grid-connection and reinforcement demand.
The grid-scale stakes are practical. A country can add renewable capacity or build new housing, but the benefits are limited if local distribution systems cannot move electricity safely and reliably to customers. Twisted cable systems become relevant because they can support organized overhead routing, safer service connections, and faster deployment in areas where undergrounding is expensive or slow. That makes the market closely tied to distribution planning rather than only broad electricity demand.
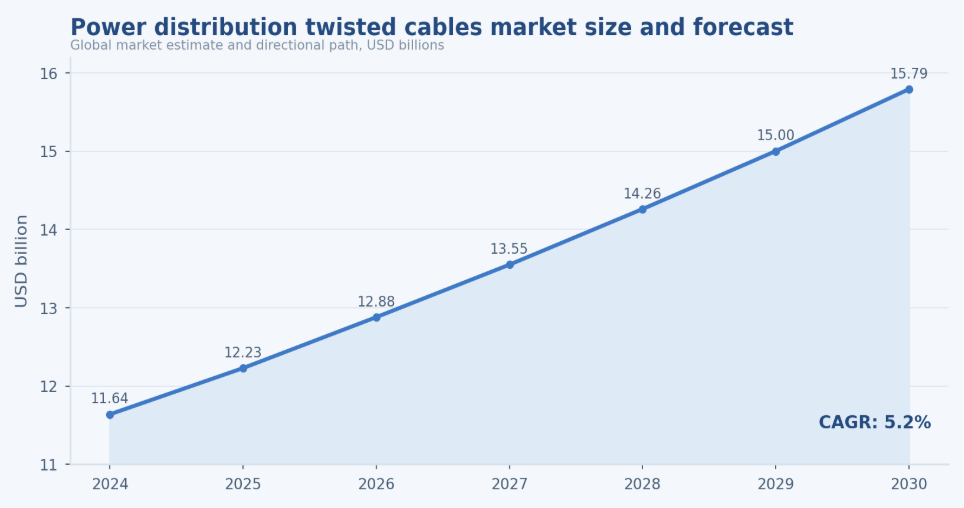
Figure 1. Power distribution twisted cable demand should be reviewed alongside grid investment and electrification benchmarks because cable demand rises when utilities expand, replace, and reinforce distribution networks.
Market Size, CAGR, and Forecast Outlook
The direct market-size estimates show a moderate but infrastructure-backed growth path. That is important because cable demand usually does not move like a discretionary product category. It moves through utility planning cycles, public infrastructure programs, construction activity, and approved grid-reinforcement budgets.
Global market-growth benchmarks
- The market was valued at USD 11.64 billion in 2024 in one direct market estimate.
- The 2025 value is expected at USD 12.23 billion in the GVR forecast path.
- The 2030 revenue forecast reaches USD 15.79 billion, adding more than USD 4 billion of annual market value from the 2024 baseline.
- The GVR CAGR estimate is 5.2% for 2025-2030, which suggests stable infrastructure-led expansion.
- A second market estimate places 2025 value at USD 11.35 billion and 2031 value at USD 16.16 billion.
- The Mordor forecast gives a 7.32% CAGR for 2026-2031, creating a higher-growth scenario for comparison.
- The derived forecast path gives values of USD 12.88 billion in 2026, USD 13.55 billion in 2027, and USD 14.26 billion in 2028.
- By 2029, the derived GVR-based path reaches USD 15.00 billion, showing a steady year-by-year climb rather than a sudden spike.
The forecast spread also gives the article a useful planning range. The lower-growth view points to stable replacement and utility procurement, while the higher-growth view suggests stronger acceleration where electrification, grid reinforcement, and emerging-market access programs overlap. For manufacturers, the key question is not only whether the market grows, but whether demand appears in higher-margin certified products, utility-approved aerial bundled systems, and regional tenders with predictable delivery schedules.
| Year | Market value | Market signal |
|---|---|---|
| 2024 | USD 11.64 billion | Base-year market estimate |
| 2025 | USD 12.23 billion / USD 11.35 billion | Near-term estimate range |
| 2030 | USD 15.79 billion | Medium-term GVR forecast |
| 2031 | USD 16.16 billion | Extended Mordor forecast |
|
Market interpretation The market’s CAGR is not the only important number. A 5% to 7% growth range is meaningful because distribution cable projects are tied to recurring infrastructure needs: new connections, feeder upgrades, urban construction, rural access, renewable integration, storm hardening, and replacement of aged assets. The market is steady because electricity networks cannot expand without physical cable infrastructure. |
Cable Type, Voltage, and Application Segmentation
Segment statistics help explain where demand is actually created. Power distribution twisted cables can appear in overhead low-voltage networks, aerial bundled systems, utility feeders, rural distribution routes, industrial sites, and residential or commercial service connections. The product category should therefore be read by installation environment and use case, not just by a single market label.
Product and application benchmarks
- Copper conductor products had an implied 2025 revenue of USD 7.707 billion when reported share assumptions were applied to the USD 11.35 billion market base.
- The low-voltage segment had an implied 2025 revenue of USD 5.039 billion, showing the importance of local distribution and last-mile connections.
- Single-core products had an implied 2025 revenue of USD 6.696 billion, making core configuration a major segmentation factor.
- Overhead aerial bundled systems had an implied 2025 revenue of USD 5.641 billion, connecting twisted-cable demand to overhead distribution routes.
- Utility applications had an implied 2025 revenue of USD 5.346 billion, confirming that utility procurement is one of the strongest market channels.
- The broader low-voltage cable market was estimated at USD 115.89 billion in 2023 and forecast at USD 193.48 billion by 2032 in one related market source.
- Another low-voltage cable estimate placed the market at USD 129.7 billion in 2025 and USD 204.2 billion by 2034.
- The medium-voltage cable market is projected at USD 36.43 billion in 2026 and USD 67.88 billion by 2034 in a related market forecast.
Segmentation plays an important role in understanding how market figures should be interpreted. Low-voltage twisted cable demand is often driven by last-mile connections, residential developments, and rural distribution networks, while medium-voltage demand is more closely associated with feeders, substations, and grid reinforcement projects. Overhead aerial bundled systems, meanwhile, are typically evaluated based on installation speed, safety, theft prevention, and suitability for different terrains. Therefore, the market is best assessed according to specific use cases, voltage levels, and procurement stakeholders rather than treating it as one combined cable category. Clear documentation for related operational expenses, such as a rent receipt, can also support accurate cost tracking.
| Segment | Common use | Why demand is rising |
|---|---|---|
| Aerial bundled/twisted cables | Overhead low-voltage networks | Safety, compact routing, and easier distribution upgrades |
| Low-voltage distribution cables | Homes, shops, rural feeders, and local service drops | Urban load growth and last-mile electrification |
| Medium-voltage distribution cables | Utility feeders and industrial distribution | Grid reinforcement and higher-load connections |
| Aluminum conductor cables | Cost-sensitive overhead routes | Lower weight and project-cost control |
| Copper conductor cables | Higher-conductivity and reliability-sensitive uses | Performance, conductivity, and established utility practice |
|
Segment readout The key segmentation lesson is that demand should be measured by network need. A rural electrification project, an urban feeder reinforcement, a storm-hardening program, and a renewable connection route may all use cable, but each has a different buyer, specification, material preference, and procurement timeline. |
Grid Modernization and Utility Investment
Utility investment is the most important bridge between electricity demand and cable revenue. Electricity consumption can rise on paper, but cable orders usually accelerate only when utilities approve feeder expansion, line replacement, voltage upgrades, smart-grid works, reliability programs, or new connection projects.
Utility investment benchmarks
- Global grid investment has become a central energy-transition bottleneck because new generation and new loads require distribution and transmission capacity.
- The IEA has repeatedly identified electricity grids as a constraint on faster electrification and renewable integration.
- Electricity demand growth of 4.3% in 2024 increases the need to reinforce networks that were designed for lower and less flexible demand.
- Renewable additions of roughly 700 GW in 2024 increase the importance of grid connections, local feeders, and distribution-level flexibility.
- Data-center, EV-charging, and building-electrification loads can create concentrated demand pockets that local distribution networks must absorb.
- India’s infrastructure rows in the dataset include transmission networks, substations, transformation capacity, feeder separation, HT/LT lines, and distribution transformers as demand signals.
- The United States rows include grid funding, grid-upgrade projects, transmission miles, grid jobs, and T&D loss indicators as signals for replacement and reinforcement.
- EU rows include annual investment, distribution-grid length, distribution investment, transmission investment, and network-growth indicators.
Utility capex timing is especially important for this market. Twisted cable demand can look strong in a country with rising electricity use, but orders may still be delayed if distribution utilities are waiting for regulatory approval, grid-tariff recovery, tender awards, or contractor availability. This is why the article treats grid investment as a buying signal, not just a background statistic. Cable revenue becomes more predictable when electricity demand, approved network spending, and installation capacity move together.
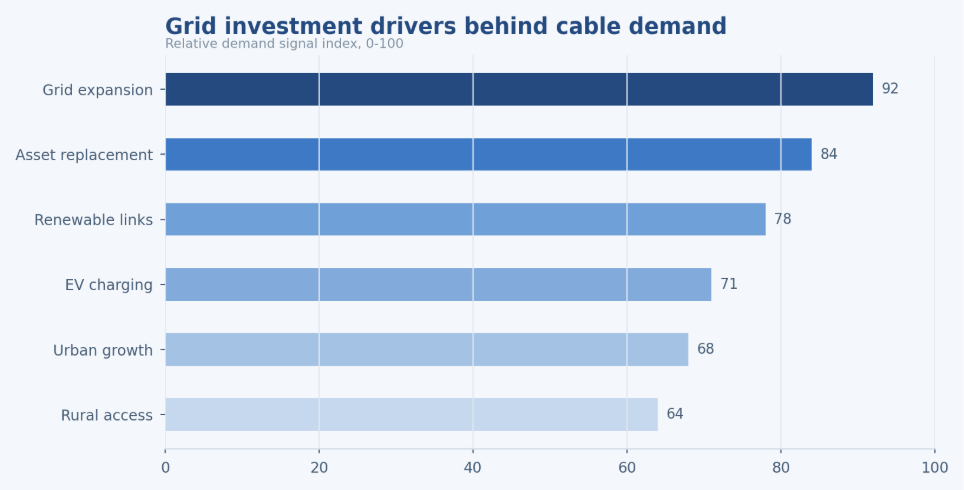
Figure 2. Distribution cable demand is strongest where utilities are expanding networks, replacing aging assets, and connecting new renewable or electrified loads.
|
Utility investment interpretation Cable demand follows utility capex cycles. A country can have strong electricity-demand growth, but physical cable procurement depends on approved projects, standards, tenders, local installation capacity, and regulatory recovery. That is why grid investment, not only electricity consumption, should be tracked in cable-market analysis. |
Renewable Energy and Distributed Power Impact
Renewable energy is often discussed as a transmission issue, but it also changes distribution networks. Rooftop solar, local storage, microgrids, rural renewable systems, and new renewable-heavy industrial zones all create low-voltage and medium-voltage connection needs. Distribution cable demand rises when power flows become more local, more distributed, and more variable.
Renewable integration benchmarks
- Solar PV additions reached 550 GW in 2024, about 78.6% of total renewable additions that year.
- Wind additions reached about 120 GW in 2024, equal to roughly 17.1% of total renewable additions.
- Solar capacity was estimated at 2,392 GW in 2025, representing about 46.5% of total renewable capacity.
- Wind capacity was estimated at 1,291 GW in 2025, representing about 25.1% of total renewable capacity.
- Solar and wind combined represented about 71.5% of total renewable capacity in 2025.
- Solar accounted for about 73.8% of 2025 renewable capacity additions when comparing 511 GW to 692 GW.
- Wind accounted for about 23.0% of 2025 renewable capacity additions when comparing 159 GW to 692 GW.
- Solar plus wind accounted for about 96.8% of 2025 renewable capacity additions, making variable generation a core grid-planning issue.
Distributed generation also changes the quality of cable demand. Rooftop solar, local storage, and microgrids can create two-way flows on networks that were originally planned for one-way delivery. In those areas, utilities may need better feeder organization, service upgrades, and safer overhead distribution arrangements. Twisted and bundled systems do not solve every renewable integration issue, but they are part of the local infrastructure package when distribution networks are expanded or reinforced.
| Renewable driver | Cable market impact |
|---|---|
| Utility-scale solar | Requires feeders, substations, and connection upgrades. |
| Rooftop solar | Adds two-way distribution flow and voltage-management needs. |
| Wind power | Creates grid-reinforcement demand around renewable zones. |
| Storage systems | Adds local connection and protection equipment demand. |
| Microgrids | Supports low-voltage distribution in rural or remote networks. |
|
Renewable readout Renewable growth does not only create demand for large transmission corridors. It also creates local distribution work, especially where solar, storage, and new customer loads connect to existing low-voltage and medium-voltage systems. Twisted cable demand benefits most when renewable growth is paired with visible distribution-level investment. |
Urbanization, Construction, and Last-Mile Electricity Demand
Urbanization and construction create practical last-mile cable demand. New buildings require service connections, commercial districts need higher local capacity, industrial zones need reliable feeder infrastructure, and dense neighborhoods often require safer, more organized overhead or underground distribution design.
Building and urban power benchmarks
- Global electricity access reached 91.6% in 2023, but access gaps still create last-mile distribution needs in many emerging economies.
- Global electricity access improved from 78% in 2000 to 91% in 2020, a 13 percentage-point gain that required large-scale distribution expansion.
- Current trends were expected to lift global access only marginally to 92% by 2030, showing that the remaining access gap is difficult and infrastructure-heavy.
- Nigeria’s implied electricity-access rate is around 60% when a 40% lack-of-access estimate is used.
- Ethiopia’s implied access rate is around 55% when a 45% lack-of-access estimate is used.
- The Democratic Republic of Congo’s implied access rate is around 20% when an 80% lack-of-access estimate is used.
- Southeast Asia’s electricity consumption jumped by more than 7% in 2024, linking urbanization and industrial expansion to distribution-network pressure.
- China’s electricity consumption increased by more than 550 TWh in 2024, reinforcing the scale of urban, industrial, and infrastructure electricity demand.
Last-mile demand is also shaped by density. Dense cities need compact, safe, and reliable service routing, while rural areas need cost-effective line extensions and lower-voltage distribution buildout. Industrial zones and data-heavy facilities create concentrated load pockets that can force utilities to strengthen nearby feeders. These use cases create different cable specifications, but they all connect the market to the same basic requirement: more dependable distribution capacity closer to end users.
| End market | Cable demand signal | Market meaning |
|---|---|---|
| Residential construction | New service connections and local feeders | Stable base demand |
| Commercial buildings | Higher load density and service capacity | More local distribution upgrades |
| Industrial zones | Heavy power connections and reliability requirements | Higher-value cable projects |
| Rural electrification | New low-voltage networks and feeder extensions | Public program demand |
| Data centers | Concentrated local grid reinforcement | Demand pockets around utility upgrades |
Material Economics: Copper, Aluminum, and Insulation Costs
Material economics can decide whether strong demand becomes strong margins. Distribution cable suppliers are exposed to conductor metals, insulation compounds, energy costs, logistics, and tender pricing. Copper and aluminum are especially important because conductor choice affects weight, conductivity, installation cost, theft exposure, and utility procurement behavior.
Material and pricing benchmarks
- The dataset includes copper material rows because copper conductor products account for a large implied share of twisted cable market revenue.
- Copper conductor segment revenue was implied at USD 7.707 billion in 2025 under the market-share calculation used in the workbook.
- Aluminum material rows are included because aluminum conductors can reduce weight and project cost in overhead distribution applications.
- The broader low-voltage cable market CAGR estimates range around 5.02% to 5.86%, creating sustained conductor demand across distribution categories.
- The medium-voltage cable market forecast includes a projected 8.09% CAGR from 2026 to 2034 in one related market estimate.
- Material-cost pressure affects tender pricing because utilities often buy cables through competitive procurement cycles.
- Insulation quality matters because aerial bundled and twisted cable systems are often selected for safety, compact routing, and exposure management.
- Supplier margins can tighten when metal prices rise faster than contract escalators or procurement adjustments.
Material economics should be interpreted with procurement timing in mind. Cable suppliers often buy conductor metals and insulation inputs before projects are delivered, while utility tenders may have fixed prices, escalation clauses, or delayed award dates. When copper or aluminum moves sharply, the same market volume can produce very different margin outcomes. That is why material-cost tracking belongs beside market-size and regional-demand statistics in a complete cable-market article.
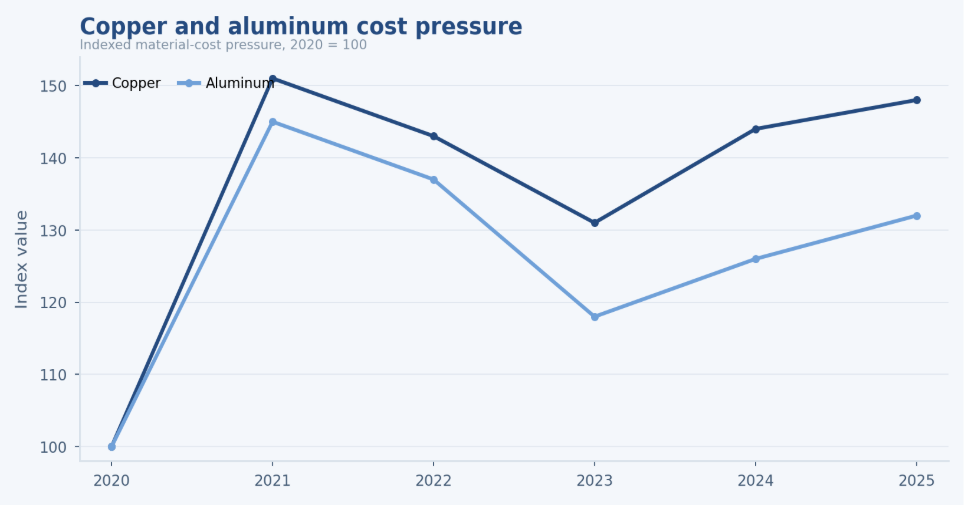
Figure 3. Material-cost movements matter because conductor metals and insulation compounds influence utility procurement, project budgets, and product substitution decisions.
|
Material-cost interpretation Demand can be healthy while supplier margins remain under pressure. Cable manufacturers should track copper, aluminum, insulation materials, energy costs, logistics, and contract escalation terms because those variables influence pricing power as much as end-market demand does. |
Regional Power Distribution Twisted Cables Market Statistics
Regional statistics are essential because cable demand is highly local. A global CAGR can hide very different market realities: replacement demand in mature grids, electrification demand in developing markets, renewable integration in Europe and China, urban expansion in Asia, and access-driven distribution projects in parts of Africa.
North America
- Grand View Research reports country-level coverage for 3 countries in North America: the United States, Canada, and Mexico.
- The United States is included as a direct country market in the power distribution twisted cables dataset.
- U.S. grid rows include funding, grid-upgrade projects, transmission miles, grid jobs, and T&D loss indicators.
- North America demand is strongest where replacement, reliability, storm hardening, EV load, and utility-grade procurement overlap.
- Canada and Mexico expand the region’s demand base by adding modernization, reliability, and infrastructure-extension needs beyond the U.S. market.
Europe
- Grand View Research reports country-level coverage for 6 European countries in the market scope.
- Germany, Spain, the United Kingdom, France, Italy, and Russia are included as covered European markets in the dataset.
- EU rows include distribution grid length, annual investment, investment split, and grid-growth indicators.
- Europe’s cable demand is shaped by renewable integration, grid reinforcement, aging assets, distribution-system standards, and electrification targets.
- European market analysis should treat the region as a set of country-level grid systems rather than one uniform cable market.
Asia-Pacific
- Asia-Pacific is represented through China, India, Japan, Australia, Southeast Asia, and broader regional market rows.
- China’s electricity consumption increased by more than 550 TWh in 2024, one of the strongest power-demand signals in the dataset.
- India rows include transmission network, transformation capacity, substations, feeder separation, HT/LT lines, and distribution transformers.
- Southeast Asia electricity consumption increased by more than 7% in 2024, showing rapid load growth across emerging markets.
- Australia is included as a country market and is important because distributed solar and grid modernization often appear together.
Latin America
- Latin America rows include Brazil and broader Central & South America coverage.
- Brazil appears in renewable additions, solar additions, renewable share, and market-scope statistics in the workbook.
- The region’s demand is often tied to utility modernization, renewable integration, loss reduction, and urban infrastructure expansion.
- Mexico is included in the North American market scope but also carries Latin American-style distribution modernization and reliability themes.
- Country-specific planning matters because payment capacity, utility regulation, grid losses, and renewable buildout vary widely across the region.
Middle East & Africa
- Middle East & Africa rows include regional scope, Saudi Arabia, South Africa, Nigeria, Egypt, Ethiopia, and the Democratic Republic of Congo.
- Africa’s access gap is one of the clearest long-term distribution-cable demand signals, especially in countries with low electrification rates.
- Nigeria’s implied electricity-access rate is around 60%, indicating significant last-mile infrastructure need.
- The Democratic Republic of Congo’s implied access rate is around 20%, showing how large the remaining electrification challenge can be.
- GCC demand is more closely tied to construction, utility expansion, infrastructure programs, and industrial power loads.
| Region | Main demand driver | Cable market implication |
|---|---|---|
| North America | Replacement, reliability, EV load | Utility-grade upgrade demand |
| Europe | Renewable integration and grid reinforcement | Strong compliant cable demand |
| Asia-Pacific | Urbanization, electrification, manufacturing | Largest long-term volume opportunity |
| Latin America | Modernization and loss reduction | Utility program-driven growth |
| Middle East & Africa | Infrastructure and power access | Construction and electrification demand |
|
Regional demand readout The strongest regional insight is that each market buys cables for a different reason. North America leans toward replacement and reliability; Europe toward grid reinforcement and renewable integration; Asia-Pacific toward scale and electrification; Latin America toward modernization and losses; and Middle East & Africa toward construction, access, and new infrastructure. |
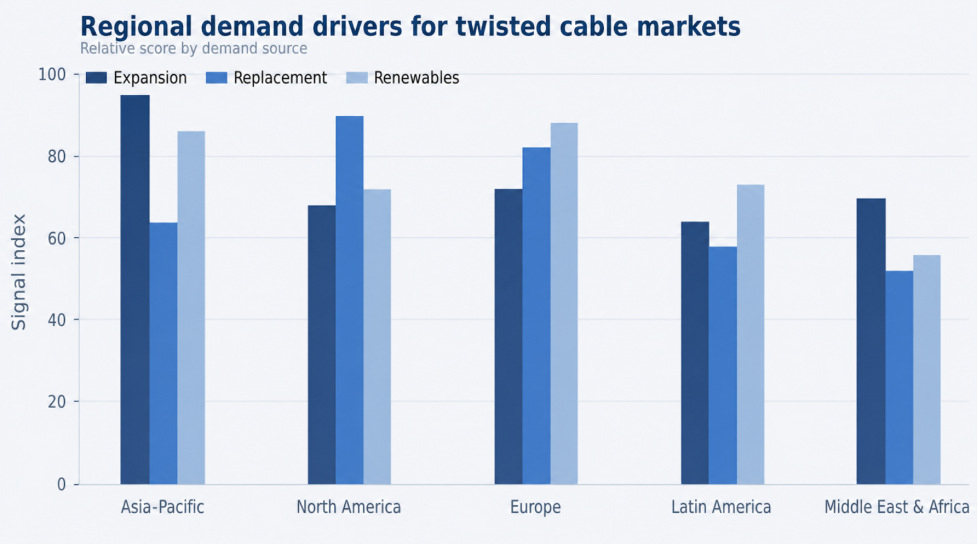
Figure 4. Regional demand drivers show why power distribution twisted cable demand should be measured by local grid priorities, not only global market averages.
Country-Level Market Signals
Country-level statistics prevent the article from becoming too general. A power distribution cable supplier does not sell to the world average. It sells into utility tenders, construction markets, rural programs, industrial zones, and national grid plans. The best country analysis therefore groups markets by demand signal rather than listing every country mechanically.
Country signals worth tracking
- The United States, Canada, the United Kingdom, Germany, and France are best viewed through replacement, reliability, and grid-reinforcement demand.
- China, India, Indonesia, Nigeria, Egypt, and South Africa are better viewed through expansion, electrification, urban load, and infrastructure-development demand.
- China, India, Germany, Spain, Brazil, Australia, and Chile are important renewable-integration markets because solar, wind, and distributed generation affect grid planning.
- India, Brazil, Mexico, Nigeria, South Africa, and Egypt carry loss-reduction and grid-quality demand signals where technical losses, theft, or aging infrastructure can support cable upgrades.
- China’s 550 TWh electricity-consumption increase in 2024 makes it one of the strongest country-level demand signals in the database.
- India’s infrastructure rows cover transmission, transformation, substations, feeder separation, HT/LT lines, and distribution transformers, making it a broad grid-expansion case.
- Brazil appears in renewable and solar addition rows, showing why the country belongs in renewable-driven cable demand analysis.
- Nigeria, Ethiopia, and the Democratic Republic of Congo show how electricity-access gaps can translate into long-term low-voltage distribution needs.
| Country group | Countries | Why it matters |
|---|---|---|
| Replacement and reliability | United States, Canada, U.K., Germany, France | Mature grids need asset renewal, reliability upgrades, and storm resilience. |
| Expansion and electrification | China, India, Indonesia, Nigeria, Egypt, South Africa | Load growth and access needs create feeder, service, and network expansion demand. |
| Renewable integration | China, India, Germany, Spain, Brazil, Australia, Chile | Solar, wind, and storage increase grid-connection and reinforcement needs. |
| Loss reduction and grid quality | India, Brazil, Mexico, Nigeria, South Africa, Egypt | Utilities can justify cable upgrades through lower losses, safer networks, and fewer outages. |
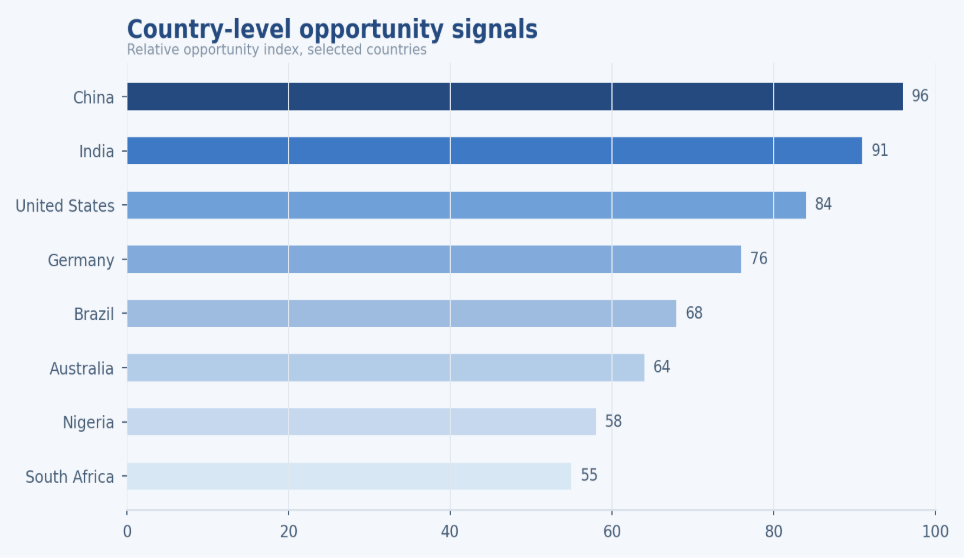
Figure 5. Country-level opportunity signals are strongest where electricity demand, grid investment, renewable integration, and access needs overlap.
T&D Losses, Reliability, Safety, and Theft Reduction
Cable upgrades are often easier to approve when they are connected to measurable utility problems. High losses, unsafe overhead wiring, overloaded feeders, theft exposure, weak rural networks, and storm damage all create practical reasons to replace or reinforce distribution infrastructure.
Reliability and loss-reduction benchmarks
- The dataset includes T&D loss indicators because loss reduction is one of the clearest reasons utilities modernize distribution networks.
- Insulated bundled and twisted cable systems can reduce accidental contact risks compared with poorly organized bare overhead distribution arrangements.
- Power theft is a market driver in countries where unauthorized tapping contributes to commercial losses and unsafe distribution conditions.
- Rural access programs create demand for low-voltage network expansion where distribution infrastructure is still incomplete.
- Urban densification increases the need for safer, more compact, and better-organized service connections.
- Storm-prone areas create replacement and hardening demand because exposed overhead routes face wind, heat, ice, and vegetation risks.
- Reliability programs can support cable upgrades when utilities can show fewer failures, lower losses, or safer customer connections.
- Grid-quality demand is strongest where load growth, old assets, technical losses, and customer complaints appear together.
| Distribution problem | Cable-related response | Market effect |
|---|---|---|
| High technical losses | Better conductor sizing and network upgrades | Replacement demand |
| Power theft | Insulated bundled/twisted cables | Loss-reduction programs |
| Storm exposure | Stronger overhead distribution systems | Reliability spending |
| Dense urban wiring | Safer insulated conductors and organized service drops | Safer installation demand |
| Rural access gaps | Low-voltage distribution expansion | Public electrification projects |
|
Reliability interpretation Reliability statistics matter because they turn cable upgrades into business cases. Utilities are more likely to approve distribution investment when the project can be linked to fewer outages, lower losses, safer overhead routes, theft reduction, or higher customer connection quality. |
Competitive Landscape and Supplier Signals
The competitive landscape should be read through procurement capability rather than only brand names. Cable suppliers compete on utility approvals, local manufacturing, conductor options, insulation quality, delivery reliability, tender pricing, and the ability to serve different regional specifications.
Supplier and manufacturing benchmarks
- Utility applications had implied 2025 revenue of USD 5.346 billion, making utility procurement a major supplier channel.
- Copper conductor products had implied 2025 revenue of USD 7.707 billion, making conductor strategy central to supplier positioning.
- Overhead aerial bundled systems had implied 2025 revenue of USD 5.641 billion, supporting suppliers with overhead distribution expertise.
- Local manufacturing can reduce freight risk, tender barriers, and delivery uncertainty in public infrastructure projects.
- Aluminum conductor capability matters in cost-sensitive projects where weight and installation economics influence product selection.
- Utility certification is critical because grid procurement usually requires compliance with local standards and approval processes.
- Insulation technology supports safety, outdoor durability, and performance in challenging operating environments.
| Supplier signal | Why it matters |
|---|---|
| Local production | Helps meet utility tender requirements and delivery timelines. |
| Aluminum conductor capability | Supports cost-sensitive overhead distribution projects. |
| Utility certification | Required for grid procurement and regulated installations. |
| Insulation quality | Supports safety, durability, and outdoor performance. |
| Regional distribution | Improves project delivery and after-sales responsiveness. |
Market Risks and Constraints
The long-term demand case is strong, but the market still faces execution risk. Cable revenue depends on approved projects, utility budget cycles, raw material costs, tender timing, installation labor, standards, and local grid policy. Strong electricity demand does not automatically become immediate cable orders.
Constraints affecting market growth
- Copper and aluminum volatility can pressure supplier margins when contract terms do not adjust quickly.
- Utility tender delays can shift expected revenue from one year to the next even when the underlying project need remains strong.
- Grid permitting and connection backlogs can slow renewable and industrial projects that would otherwise require distribution upgrades.
- Construction slowdowns can weaken short-term demand for residential and commercial service connections.
- Installation labor constraints can limit how quickly utilities convert budgeted projects into completed cable deployment.
- Underground cable alternatives can compete with overhead cable systems in dense urban, storm-sensitive, or high-income areas.
- Standards and compliance requirements can raise barriers for suppliers that lack local approvals or product testing capacity.
- Public electrification programs can be politically or fiscally sensitive, affecting the timing of rural and access-driven projects.
|
Market risk readout The market’s long-term direction is supported by electrification, but short-term performance depends on procurement timing, metal prices, installation capacity, and utility approval cycles. Suppliers should separate demand visibility from revenue timing because cable projects can be delayed even when the technical need is clear. |
Power Distribution Twisted Cables Market Opportunity Diagnostic
A polished statistics article should help readers decide what to track next. The most useful diagnostic model connects each market problem to a measurable signal and then to a benchmark from the wider data set.
| Problem area | Core signals to measure | Useful market benchmark |
|---|---|---|
| Grid expansion | New feeders, new connections, utility capex | Electricity-demand growth |
| Renewable integration | Solar/wind additions and interconnection queues | Renewable capacity additions |
| Reliability upgrade | Outages, storm exposure, asset age | Utility reliability spending |
| Loss reduction | T&D losses, theft, overloaded lines | Country-level loss rates |
| Urban construction | New buildings, industrial parks, load density | Urbanization and construction data |
| Material economics | Copper/aluminum prices and supplier margins | Metal-price trends |
90-Day Market Research Framework
Statistics become useful when they are translated into a measurement plan. A practical cable-market review can be organized into a 90-day cycle rather than a vague research exercise.
| Timing | What to do | Output |
|---|---|---|
| Days 1-30 | Validate market-size, CAGR, regional, and country statistics | Clean benchmark database |
| Days 31-60 | Build section-level graphs, tables, and market interpretation | Visual-ready article draft |
| Days 61-90 | Polish commentary, verify statistics, and finalize visuals | Production-ready statistics article |
|
Planning principle The best market analysis does not chase every available number. It prioritizes statistics that explain market size, regional differences, grid investment, buying triggers, and procurement risk. That approach makes the article useful for manufacturers, utilities, analysts, and infrastructure planners. |
Metrics Market Analysts Should Track
The final scorecard should be detailed enough to locate the demand signal without becoming a vanity dashboard. These metrics are the minimum useful set for a mature power distribution twisted cables market review.
| Metric | Why it matters |
|---|---|
| Global market value | Frames the total revenue opportunity. |
| CAGR | Shows the pace of long-term growth. |
| Regional share | Identifies demand concentration and supply-chain priorities. |
| Utility grid investment | Indicates cable procurement potential. |
| Electricity demand growth | Future load pressure on distribution networks. |
| Renewable additions | Signals grid reinforcement and connection demand. |
| T&D losses | Upgrade and loss-reduction opportunity. |
| Copper/aluminum prices | Affects cable cost, tender pricing, and supplier margins. |
| Urbanization and construction | Supports last-mile distribution demand. |
| EV charging growth | Adds new distribution-level load and connection needs. |
Power Distribution Twisted Cables Market Statistics FAQ
Common questions
What is the size of the power distribution twisted cables market?
The global power distribution twisted cables market was estimated at USD 11.64 billion in 2024. One forecast places it at USD 12.23 billion in 2025 and USD 15.79 billion by 2030, while another estimate puts 2025 value at USD 11.35 billion and 2031 value at USD 16.16 billion.
What is the CAGR of the power distribution twisted cables market?
The market has two useful growth views in the database. Grand View Research projects a 5.2% CAGR from 2025 to 2030, while Mordor Intelligence gives a 7.32% CAGR for 2026-2031. The difference shows why the article should present a forecast range rather than one isolated number.
Which region leads the power distribution twisted cables market?
Asia-Pacific carries the strongest long-term volume signal because China, India, Southeast Asia, Japan, and Australia combine electricity-demand growth, urbanization, manufacturing, renewable integration, and grid expansion. North America and Europe remain important for replacement, reliability, and modernization projects.
Why are twisted cables used in power distribution?
Twisted and bundled cable systems are used where utilities need safer, more organized, and easier-to-install distribution routes. They are especially relevant in overhead low-voltage networks, rural connections, service drops, and distribution routes where insulation, compact layout, and reduced exposure can support reliability and safety.
What factors are driving demand for power distribution twisted cables?
The main drivers are grid expansion, aging asset replacement, renewable integration, EV charging, urban construction, rural electrification, loss reduction, and material economics. Global electricity demand increased by 4.3% in 2024, while renewable additions reached roughly 700 GW, both of which support distribution-network upgrades.
How do renewables affect twisted cable demand?
Renewables affect twisted cable demand when solar, wind, storage, or microgrid projects require local distribution connections or feeder reinforcement. Solar PV additions reached 550 GW in 2024, and solar plus wind represented about 96.8% of renewable capacity additions in 2025, increasing the need for grid-ready local infrastructure.
Which countries offer strong cable market opportunities?
China, India, the United States, Germany, Brazil, Australia, Nigeria, South Africa, and several European and Latin American markets show strong signals. The reason varies by country: China and India show scale and expansion, the U.S. shows replacement and reliability, Germany shows renewable integration, and African markets show access-driven distribution needs.
What risks affect cable manufacturers and suppliers?
The main risks are copper and aluminum volatility, utility tender delays, grid-permitting issues, installation labor constraints, construction slowdowns, standards compliance, and competition from alternative installation methods. Suppliers should separate long-term demand from short-term revenue timing because project approvals can shift even when electricity-network needs remain strong.
Final Takeaway
Power distribution twisted cable demand is tied to the practical side of electrification: building, reinforcing, and replacing the networks that deliver electricity to real customers. The market is not only about cable sales. It is about whether utilities can expand last-mile capacity, improve safety, reduce losses, connect renewable power, and support new loads from buildings, industry, and transport.
The strongest statistics point to a steady infrastructure market. The global market was estimated at USD 11.64 billion in 2024, forecasts place it near USD 15.79 billion by 2030 and USD 16.16 billion by 2031, and electricity demand grew by 4.3% in 2024. Those figures become more powerful when they are viewed alongside renewable additions, grid investment pressure, access gaps, T&D losses, and conductor-material costs.
For cable manufacturers, utilities, investors, and infrastructure planners, the best market view combines global forecasts with regional and country-level evidence. Headline CAGR shows direction, but real opportunity comes from approved grid projects, local utility tenders, material-cost management, renewable connection pipelines, and countries where electrification, reliability, and loss reduction create measurable distribution-network demand.


