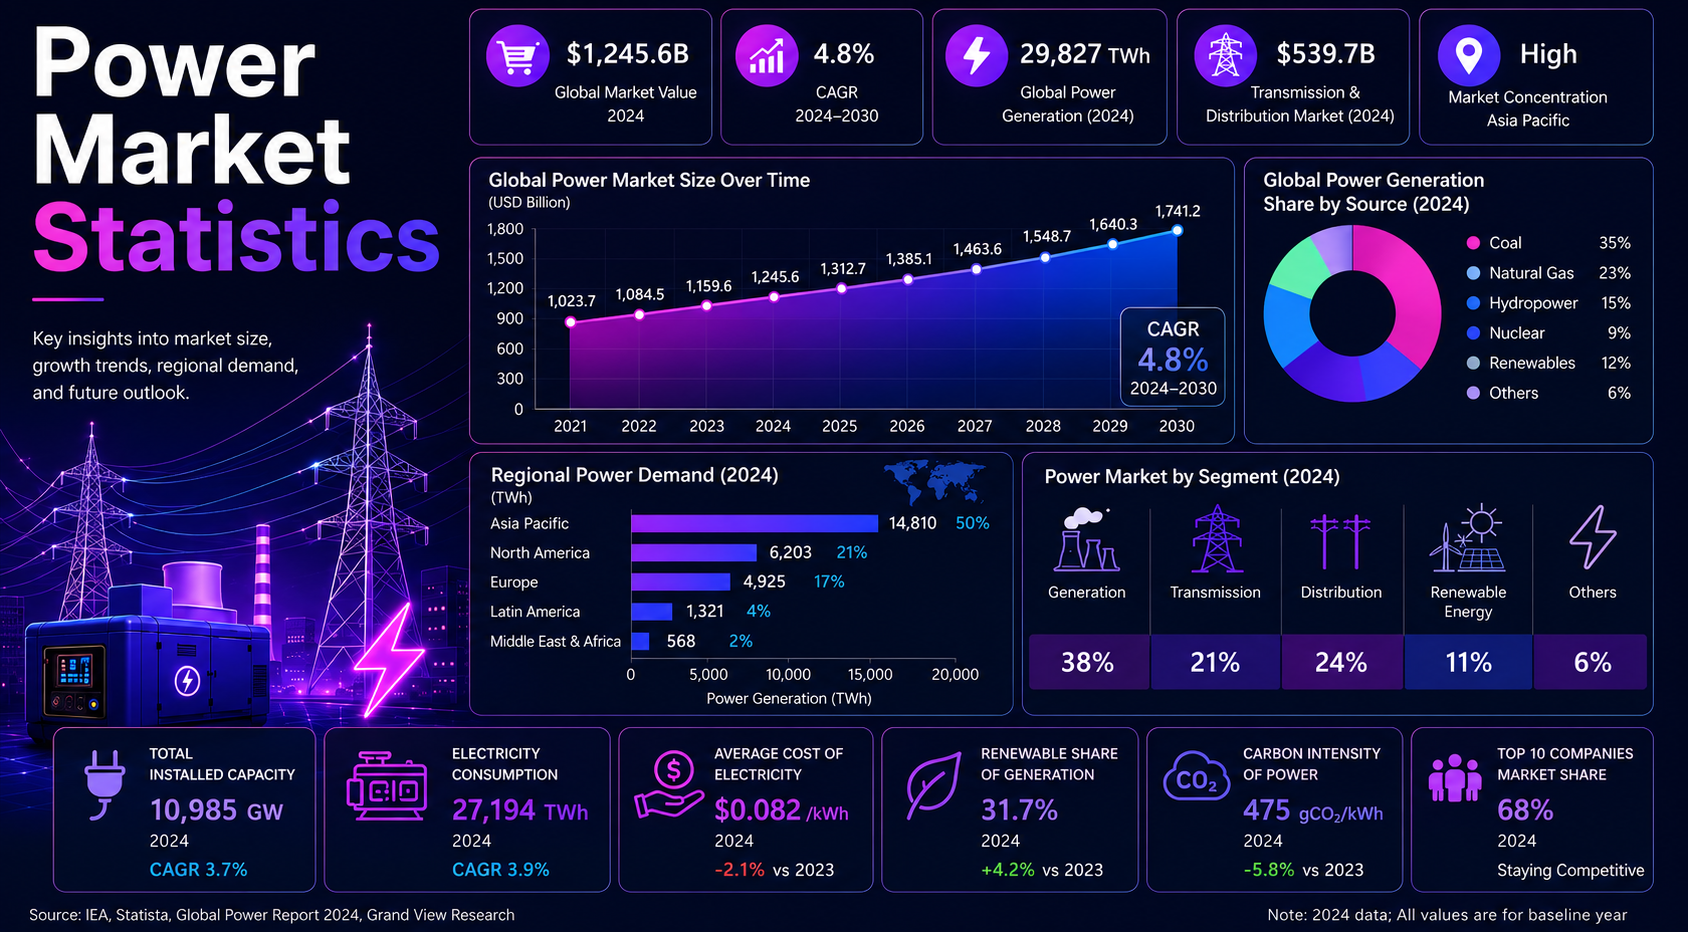
Power markets are where electricity demand, generation capacity, fuel supply, renewable integration, grid reliability, and energy security meet. The market is not only a generation story. It includes power plants, transmission lines, distribution networks, storage, wholesale pricing, capacity planning, retail consumption, system balancing, and the rules that decide which resources can deliver electricity when demand rises.
The strongest statistics show why power now deserves its own benchmark scorecard. Global electricity consumption increased by 1,080 TWh in 2024, generation grew by more than 1,200 TWh, renewables and nuclear supplied over 80% of generation growth, and the world added 585 GW of renewable power capacity. At the same time, fossil fuels still produced nearly 60% of global electricity, coal remained the largest single source, and grid infrastructure became a major constraint on new clean-power deployment.
This article is organized for scanning. Each section starts with a short explanation, then presents curated benchmark bullets, followed by a table, readout box, or figure where it helps. The goal is not to list every available power number. It is to show which statistics help utilities, developers, investors, energy buyers, and policymakers understand where the power market is growing, where it is constrained, and which metrics deserve closer tracking.
Executive Power Market Benchmarks
These are the statistics that frame the article. They show the scale of electricity demand, the speed of renewable additions, the continuing role of fossil generation, and the pressure that rising loads place on grids and flexibility resources.
The numbers that define the power market
• Global electricity consumption increased by 1,080 TWh in 2024, so the market is adding load at a pace that affects generation, fuel planning and grids together.
• Electricity generation rose by more than 1,200 TWh, with renewables and nuclear supplying over 80% of that growth while fossil fuels still produced nearly 60% of total power.
• Coal remained the largest source with a 35% share, which is why reliability and emissions have to be reviewed together rather than treated as separate topics.
• Renewables supplied about one-third of global electricity and reached 46% of installed capacity by the end of 2024.
• New capacity was much cleaner than the existing mix: renewables delivered 92.5% of global additions, including 452 GW of solar and 113 GW of wind.
• The long-term target is still demanding. Annual renewable additions need to rise above 1,120 GW and installed renewable capacity needs to move toward 11 TW by 2030 to stay aligned with the COP28 tripling pathway.
Taken together, these numbers show a market where demand growth, clean capacity, fossil reliability and grid readiness have to be read as one system.
Editorial readout
The headline data points to five power-market systems that now need to be reviewed together: demand growth, generation mix, grid capacity, storage and flexibility, and regional energy security. A country can add large amounts of renewable capacity and still face reliability pressure if transmission, distribution, storage, permitting, and dispatchable backup do not move at the same pace. Power-market analysis is therefore strongest when it connects capacity additions with actual generation, demand growth, peak load, system flexibility, and local grid constraints.
Why the Power Market Now Carries Global Economic Weight
Power markets matter more when electricity becomes the operating layer for homes, factories, transport, cooling, digital infrastructure, and industrial policy. Demand growth is no longer explained only by population or GDP. It now comes from data centers, electric vehicles, heat pumps, cooling, manufacturing, and the shift from direct fossil-fuel use to electrified systems.
Market-size and demand-growth benchmarks
Electricity growth now affects grid planning, fuel procurement, investment and reliability at the same time. The strongest demand numbers show a market expanding at system scale, not a small consumption category.
• Global electricity generation reached 30,664.34 TWh in 2024, while consumption reached 28,533.57 TWh, making even small percentage changes large enough to reshape infrastructure plans.
• The market expanded quickly: generation rose 3.86%, consumption increased 3.91%, and broader electricity demand grew by 4.4%.
• Growth is expected to continue, with demand forecast to rise 3.3% in 2025 and 3.7% in 2026, when consumption is expected to exceed 29,000 TWh.
• Southeast Asia showed one of the clearest regional demand signals, with electricity consumption increasing by more than 7%.
• Buildings added more than 600 TWh of electricity use and accounted for nearly 60% of global consumption growth, while industry represented nearly 40%.
• Electric vehicles are becoming a structural load driver as global electric car sales passed 17 million units and exceeded 20% of all car sales.
The important point is not just that demand is rising. It is that new load is coming from several systems at once: buildings, industry, transport, data centers and electrified equipment. That mix makes the power market harder to plan because capacity, transmission, distribution and flexibility must all expand in the right places.
The market context changes the business case. A 1% change in demand can represent hundreds of terawatt-hours at global scale. That difference affects fuel procurement, reserve margins, grid expansion, emissions, wholesale prices, and customer bills. It also changes how policymakers think about electricity security, because power systems must match supply and demand continuously, not only over a full year.
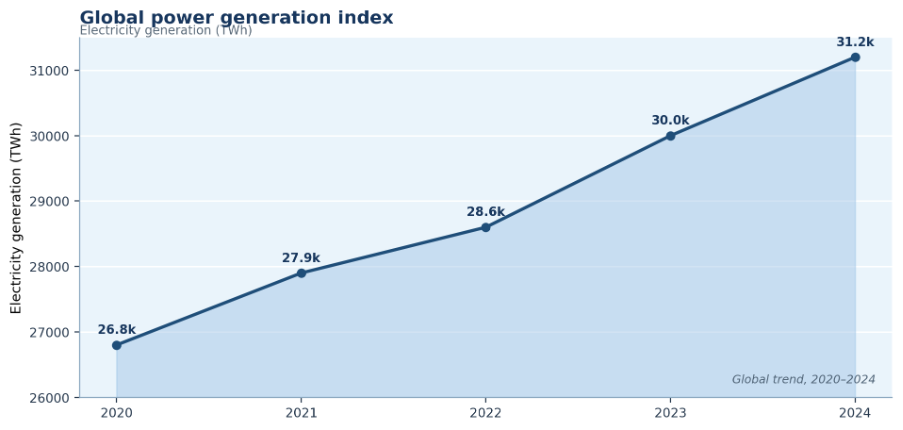
Figure 1. Global electricity demand, generation growth, and renewable capacity additions should be reviewed together because power systems must balance growth, reliability, and decarbonization at the same time.
Where Global Power Generation Is Expanding Fastest
Generation statistics show the size of the power system, but the more useful question is where growth is coming from. In 2024, clean generation grew faster than fossil generation, but fossil sources still provided most electricity supply. That creates a transition pattern where the marginal additions are cleaner while the installed operating system remains mixed.
Generation mix benchmarks
• Global electricity generation grew at an average 2.6% per year between 2010 and 2023, but demand growth accelerated again in 2024.
• Fossil generation increased by just over 1%, with natural gas up about 2.5% and coal rising by less than 1%.
• Renewables supplied a record 32% of electricity, while coal still held the largest source position at about 34%.
• Renewable sources added 858 TWh of generation, showing that clean output is now taking a larger share of incremental growth.
• Nuclear power supplied about 9% of global electricity, giving several markets a firm low-carbon source alongside renewables.
• In the first half of 2025, renewables generated 5,072 TWh globally, coal generated 4,896 TWh, and wind plus solar output rose by 403 TWh.
The mix is changing, but not evenly. Clean sources are taking more growth while coal and gas still carry major reliability roles.
| Source | Market role | Key trend | Article interpretation |
|---|---|---|---|
| Coal | Large baseload and industrial power source | Still the largest single global source | Important in Asia and emerging markets, but exposed to emissions pressure |
| Natural gas | Flexible and dispatchable generation | Holds a large share in mature markets | Supports reliability and peak supply where renewables rise |
| Hydropower | Mature renewable and flexibility resource | Weather-sensitive but system valuable | Important for balancing and low-carbon supply |
| Solar PV | Fastest capacity-growth technology | Dominates new renewable additions | Raises daytime supply and storage needs |
| Wind | Large-scale renewable resource | Strong in China, the U.S. and Europe | Requires transmission and balancing capacity |
| Nuclear | Firm low-carbon power | Stable share globally | Supports reliability and emissions reduction where policy allows |
Generation readout
The power market is shifting, but it is not shifting evenly. Solar and wind are expanding quickly, yet coal, gas, hydro, and nuclear still decide reliability in many systems. The strongest generation analysis compares annual output with installed capacity, because capacity additions do not automatically translate into dispatchable electricity at the exact hour when demand peaks.
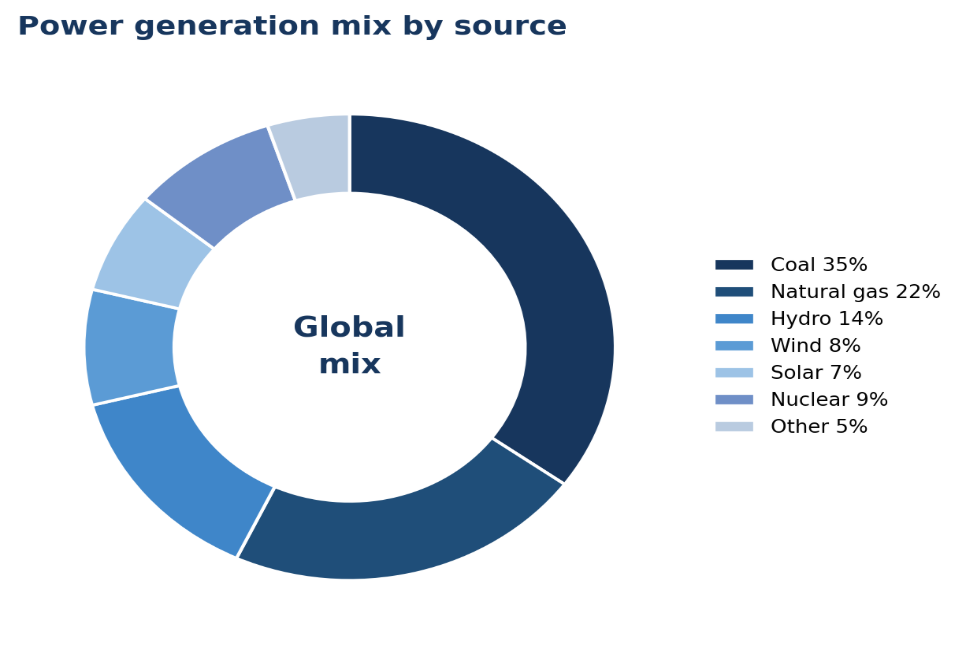
Figure 2. The global generation mix still depends heavily on fossil fuels, while renewables and nuclear together form the low-carbon base that is expanding in many markets.
Renewable Power Is Reshaping the Generation Mix
Renewable power is now the main source of new capacity growth. The numbers are strongest when viewed through both capacity and generation. Capacity shows what is being built; generation shows what actually reaches the grid. Solar dominates new additions, but wind, hydro, storage, and transmission determine how much renewable energy can be used reliably.
Renewable capacity and generation benchmarks
Renewable power growth is no longer spread evenly across every region or technology. The market is increasingly shaped by a few large capacity builders, while solar continues to carry most of the growth.
• Global renewable power capacity expanded by 15.1% in 2024.
• China, the United States, and the European Union accounted for 83.6% of new renewable capacity installed that year.
• Together, those three markets added about 489 GW of new renewable capacity.
• Africa added 4.2 GW, equal to roughly 0.7% of global renewable capacity additions.
• Solar accounted for about 77% of the 585 GW of renewable capacity added worldwide.
• Wind represented roughly 19% of new renewable capacity additions.
The numbers show that renewable growth is strong, but it is also concentrated. Solar is driving most new capacity, while wind remains important for larger grid-scale supply. For power-market planning, the key question is not only how much renewable capacity is added, but whether grids, storage, and transmission can absorb that growth efficiently.
| Technology | Growth signal | Main markets | Market implication |
|---|---|---|---|
| Solar PV | Largest source of new renewable capacity | China, U.S., India, Europe | Drives daytime generation and battery-storage demand |
| Wind | Major grid-scale renewable source | China, U.S., Europe | Requires transmission, balancing and project permitting |
| Hydropower | Large existing renewable base | China, Brazil, Canada, Africa | Provides flexibility but faces drought exposure |
| Bioenergy | Dispatchable renewable output | Europe, Asia, Americas | Useful where firm renewable output is needed |
| Geothermal | Smaller but stable source | U.S., Indonesia, Kenya | Valuable baseload option in suitable regions |
Renewable market readout
Renewable capacity growth is not the same as reliable power supply. A market can add record solar capacity and still face curtailment, evening shortages, transmission congestion, or seasonal balancing problems. The practical renewable scorecard should combine installed capacity, actual generation, capacity factor, curtailment, interconnection queues, storage, and transmission readiness.
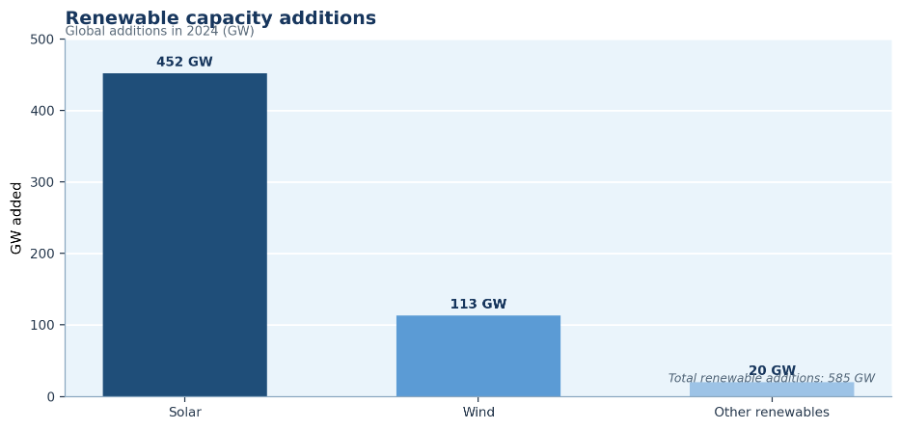
Figure 3. Renewable additions are increasingly dominated by solar, but grid integration depends on wind, hydro, storage, demand response, and transmission expansion.
Solar Power Is Becoming the Main Source of New Capacity
Solar power has become the clearest growth engine in the power market. Its speed matters because solar can be built faster than many other generation sources, but high solar penetration changes the daily shape of power systems. It increases midday output, puts pressure on evening ramps, and makes storage and flexible demand more important.
Solar market benchmarks
• Solar PV supplied 7% of global electricity generation in 2024.
• China increased solar generation by 43% in the first half of 2025.
• India increased solar generation by 31% in the first half of 2025.
• China’s solar cell output rose 18% year on year in the first half of 2025.
Solar growth is now a grid-planning question as much as a capacity story because daytime supply must be absorbed, stored or moved.
| Solar trend | Why it matters |
|---|---|
| Utility-scale solar growth | Adds low-cost daytime power and changes price patterns |
| Rooftop solar adoption | Changes distribution-grid flows and customer roles |
| Solar-plus-storage | Improves evening supply and grid services |
| Solar curtailment | Shows where flexibility or transmission is lagging |
Solar interpretation
Solar is now a central planning variable for grids, capacity markets, industrial buyers and utilities. The strongest solar statistics should be connected to storage duration, evening peak demand, transmission congestion, distribution upgrades and the ability to absorb midday generation without wasting clean electricity.
Wind Power Remains a Core Grid-Scale Renewable Source
Wind power remains one of the most important grid-scale renewable sources. It is particularly valuable where wind output complements solar, where offshore projects can serve large coastal load centers, and where transmission connects windy regions to cities and industrial demand centers.
Wind market benchmarks
• Wind supplied 8% of global electricity in 2024 and remains one of the main utility-scale renewable sources.
• China and India showed strong momentum in the first half of 2025, with wind generation rising 16% and 29% respectively.
• The global wind industry installed a record 117 GW in 2023, led mainly by 106 GW of onshore wind.
• Offshore wind added 10.8 GW, a smaller total but still important for coastal power systems and European energy planning.
• Cumulative global wind capacity passed 1 TW, with China alone installing a record 75 GW during 2023.
• To stay on track for climate targets, annual wind installations would need to climb toward 320 GW and cumulative capacity toward 3 TW by 2030.
Wind remains a scale resource, but its value depends on permitting, transmission access and how well output complements solar.
Wind market interpretation
Wind remains central to large-scale renewable generation, but its growth depends heavily on permitting, turbine supply chains, transmission access, offshore project economics, and grid connection speed. A power market with strong wind resources still needs interconnection capacity, balancing markets, and demand flexibility to turn wind potential into reliable delivered electricity.
Why Fossil Power Still Matters for Reliability
Fossil power is declining in share in some markets, but it remains important in absolute generation. Coal and gas still support industrial demand, peak loads, backup supply, and reliability in many systems. The power market transition therefore cannot be understood only by looking at renewable additions; it also requires a clear view of fossil generation, retirements, and replacement capacity.
Coal, gas, and fossil-generation benchmarks
• Natural gas has supplied over 20% of global electricity for more than two decades, which explains why it remains central to flexibility and reliability planning.
• China cut fossil-fuel power generation by 2% in the first half of 2025, while India’s coal and gas generation fell by 3.1%.
• Global coal power capacity still increased by 18.8 GW in 2024 because 44 GW of new capacity exceeded 25.2 GW of retirements.
• Total coal capacity stood at 2,143 GW, showing that coal remains a large installed base even as clean power expands.
• China commissioned 30.5 GW of coal capacity and India added 5.6 GW, keeping Asia central to the coal-transition story.
• The net addition of 18.8 GW shows why fossil power must be read through reliability, demand growth and emissions policy together.
These figures explain why transition planning must reduce emissions without weakening reserve margins or industrial power security.
| Region | Fossil-power role | Key issue |
|---|---|---|
| Asia-Pacific | Coal remains important for industrial demand and system reliability | Emissions pressure, air quality and clean-power integration |
| North America | Gas is central to flexible generation and peak supply | Fuel-price volatility and emissions management |
| Europe | Coal has declined, while gas supports balancing and reliability | Energy security and renewable variability |
| Middle East | Gas-fired generation remains central in many systems | Diversification into solar and nuclear |
| Africa | Fossil power supports reliability in several markets | Access, affordability and fuel-supply constraints |
Fossil power readout
Fossil generation can fall as a share while still remaining critical in absolute supply. Coal, gas, and oil statistics should be interpreted through four questions: how much energy they provide, when they operate, what they cost, and how quickly low-carbon alternatives can replace their reliability function. A narrow capacity comparison can miss the operational value of dispatchable resources.
Nuclear Power’s Role in Firm Low-Carbon Supply
Nuclear power occupies a different position from solar and wind. It does not grow as quickly as modular renewable technologies, but it provides firm low-carbon generation where existing fleets are reliable and policy support exists. Nuclear statistics matter most in markets trying to lower emissions without losing around-the-clock capacity.
Nuclear generation benchmarks
• Renewables generated about one-third of global electricity in 2024 compared with 9% from nuclear.
• The global electricity mix was roughly 60% fossil and 40% renewables plus nuclear in 2024.
• France generated 537.23 TWh of electricity in 2024.
• France’s electricity generation changed by +7.72% year over year in 2024.
| Nuclear market signal | Why it matters |
|---|---|
| Firm low-carbon output | Supports reliability while reducing power-sector emissions |
| Fleet performance | Determines whether nuclear-heavy countries can export or must import power |
| Lifetime extensions | Can preserve low-carbon capacity faster than building new plants |
| New-build programs | Signal long-term policy interest in clean firm power |
Nuclear interpretation
Nuclear power should be framed as firm low-carbon infrastructure. It is not the fastest growth segment, but it can reduce system risk where intermittent renewable growth is high and fossil retirements are planned. For article analysis, nuclear belongs beside storage, hydro and flexible generation because it affects reliability, emissions and reserve planning.
Why Grid Capacity Is Becoming the Power Market Bottleneck
The grid is now one of the most important constraints in the power market. Generation capacity can be built faster than transmission lines, substations, interconnection processes, and distribution upgrades. That means power-market growth increasingly depends on whether electricity can move from where it is produced to where it is needed.
Grid investment and reliability benchmarks
• U.S. data centres consumed around 180 TWh in 2024, making digital infrastructure a visible power-planning load rather than a niche demand source.
• By 2030, U.S. data-centre demand is projected to rise by about 240 TWh compared with 2024.
• Meta, Amazon, Alphabet and Microsoft were cited as committing USD 320 billion in 2025 capex, up from USD 230 billion the previous year.
• Global installed generation capacity reached 9,758 GW in 2024 and increased 7.45% year over year.
• Capacity has expanded by 180.30% since 2000, but grid delivery has not always kept pace with new generation.
• China held 3,376.72 GW of installed capacity, equal to 34.62% of the global total, while the United States held 1,283.64 GW, or 13.16%.
Grid statistics turn capacity targets into delivery reality. New power has limited value if networks cannot connect and move it.
| Grid pressure | Measure | Why it matters |
|---|---|---|
| Renewable connection delays | Queue volume and waiting time | Slows clean-power deployment and raises project risk |
| Transmission congestion | Curtailment and price separation | Raises system cost and reduces renewable value |
| Distribution load growth | Peak demand and feeder capacity | Affects EV charging, heat pumps and rooftop solar |
| Reliability events | Outage frequency and duration | Affects households, factories and data centers |
| Grid digitalization | Smart meters, automation and monitoring | Improves demand response and operational control |
Grid bottleneck readout
The grid is no longer a background asset. It is becoming the main delivery constraint for the power market. New generation only matters when it can connect, dispatch, and reach load centers. That is why grid planning now needs to sit beside generation planning, data-center planning, EV charging strategy, and renewable procurement decisions.
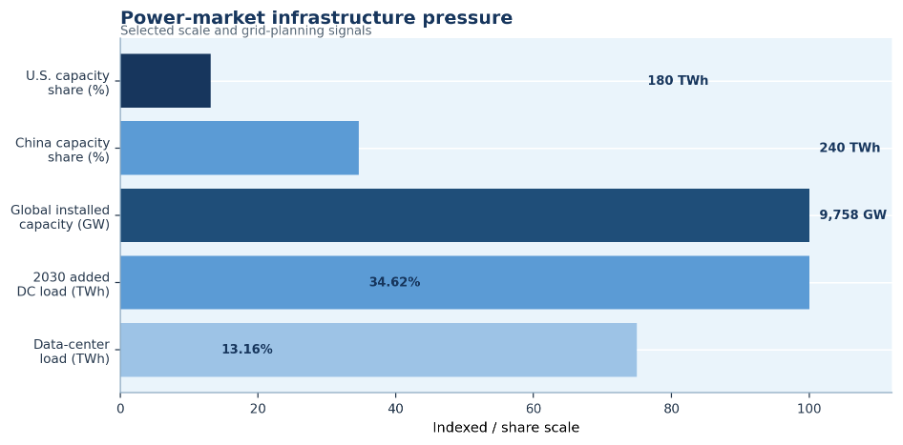
Figure 4. Power market risk is increasingly concentrated around infrastructure mismatch: rising demand, renewable additions, fossil reliability needs, grid bottlenecks, weather exposure, and investment gaps.
Storage and Flexibility Are Becoming Market Infrastructure
Storage and flexibility are becoming core power-market infrastructure because electricity systems need fast balancing, reserve support, and peak management. As solar and wind shares rise, the value of flexible resources increases. Batteries, pumped hydro, demand response, flexible gas, interconnectors, and smart grid controls all help convert variable supply into dependable service.
Battery storage, pumped hydro, and flexibility benchmarks
| Flexibility source | Market role | Best use case |
|---|---|---|
| Battery storage | Fast-response balancing and short-duration shifting | Solar shifting, frequency response and peak management |
| Pumped hydro | Large-scale long-duration storage | System balancing and reserve support |
| Demand response | Reduces peak pressure | Commercial, industrial and residential load shifting |
| Flexible gas | Dispatchable backup | Reliability during low renewable output |
| Interconnectors | Regional balancing | Cross-border power sharing and reserve support |
Storage interpretation
Storage statistics should be read together with solar penetration, peak demand, ancillary services and grid congestion. Batteries do not replace every form of dispatchable capacity, but they can improve system flexibility, reduce curtailment, shift renewable output and provide fast grid services. The practical question is not only how much storage is installed, but how long it can discharge and which market signals pay for its value.
Regional Power Market Intelligence
Regional power data is one of the highest-value parts of a power statistics article. Global averages hide large differences in demand growth, generation mix, fossil dependence, renewable resources, grid maturity, affordability and energy-security priorities.
North America
• The United States generated 4,392.55 TWh and consumed 4,194.34 TWh in 2024, making it one of the world’s largest mature power systems.
• U.S. generation rose 3.19% and consumption increased 2.69%, with demand continuing to rise in the first half of 2025.
• EIA-linked coverage forecast U.S. power consumption near 4,099 billion kWh, while natural gas was expected to hold a 42% generation share.
• Coal’s U.S. generation share was projected to fall to 14% in 2025, while renewables were expected to reach 25%.
• Canada generated 611.34 TWh, showing how hydropower-heavy markets can remain important balancing partners in North American electricity trade.
North America is a mature power region, but its load profile is changing. Natural gas remains central, renewables are rising, and data-center load is creating local pressure in several markets. The planning challenge is not only adding capacity; it is connecting new generation, keeping reserve margins healthy, and managing peak demand without pushing reliability costs too high.
Europe
• EU electricity consumption grew by about 1.5% in 2024, signaling a modest recovery after weaker demand years.
• European gas-fired generation rose 14% in the first half of 2025, while coal generation increased 1.1%.
• Germany generated 490.18 TWh, down 0.85% year over year, as the system continued adjusting around renewables, imports and dispatchable backup.
• Colombia, Lithuania and Luxembourg posted strong year-over-year generation gains, but these smaller markets should be read as country-specific changes rather than regional direction.
• Croatia and Estonia saw generation declines, showing why European power analysis needs country-level context rather than one blended average.
Europe’s power market is defined by decarbonization, energy security, cross-border trading, nuclear availability, gas balancing and accelerated renewable integration. The region’s numbers show why country-level analysis matters: France, Germany, the United Kingdom, Spain, Poland, the Nordics and smaller European markets can move in different directions in the same year.
Asia-Pacific
• China’s electricity consumption rose by more than 550 TWh and increased 7% in 2024, making it the central demand story in the global power market.
• Chinese consumption is expected to rise by about 5% in 2025, while first-half demand grew 3.7% year over year.
• Services electricity use grew 7.1%, new energy vehicle output rose 36%, and battery production increased 51%, linking power demand to industrial strategy.
• India’s demand rose 1.4% in the first half of 2025 and is forecast to grow 4% in 2025 and 6.6% in 2026.
• China generated 10,161.50 TWh in 2024, far ahead of India’s 2,051.78 TWh and Japan’s 907.01 TWh.
• Cambodia’s generation grew 22.87% year over year and was more than 5,400% higher than in 2000, showing how smaller emerging systems can grow from a low base.
Asia-Pacific is the largest and fastest-changing power region. China dominates generation scale and renewable additions, India continues to add demand, and Southeast Asia is a high-growth electricity region. The regional challenge is to add clean generation quickly while still supporting industrialization, affordability and reliability.
Latin America
• Brazil generated 737.08 TWh in 2024, up 5.16% year over year and 111.86% higher than in 2000.
• Paraguay’s generation increased 20.33%, showing the importance of hydropower and country-specific supply conditions in the region.
• Latin America’s power story is less about one uniform trend and more about hydropower exposure, solar growth, wind potential and drought management.
Latin America has strong renewable advantages, especially hydropower, wind and solar potential. The region’s opportunity is large, but hydrology risk and grid investment matter. Drought can affect hydropower-heavy systems, while solar and wind expansion require transmission access and market structures that support private investment.
Middle East and Africa
• South Africa generated 242.77 TWh in 2024, while Egypt produced 218.50 TWh and Algeria generated 96.37 TWh.
• South Africa’s generation increased 5.16%, Egypt’s rose 2.37%, and Algeria’s grew 0.51% year over year.
• Tanzania and Namibia recorded generation declines, which shows why reliability and access remain major planning questions in several African markets.
• The region combines gas-heavy systems, emerging solar and nuclear projects, and markets where basic reliability and affordability are still the first priorities.
The Middle East and Africa combine two power-market stories. Gas-rich Middle Eastern systems are diversifying into solar, nuclear and grid modernization, while many African markets still focus on access, reliability and affordability. Africa’s small share of 2024 renewable additions shows the gap between resource potential and deployed capacity.
| Region | Main trend | Planning point |
|---|---|---|
| North America | Gas, renewables, storage and data centers | Expand transmission and manage peak demand |
| Europe | Renewable growth, nuclear variation and energy security | Strengthen interconnection and flexibility |
| Asia-Pacific | Demand growth and coal transition | Add clean power while maintaining reliability |
| Latin America | Hydropower strength and solar/wind growth | Manage drought and grid expansion |
| Middle East & Africa | Access, gas, solar and reliability | Build generation, grids and affordability models |
Regional market rule
Power-market localization is not optional. The same global trend can mean different things by region. A solar-heavy system may need storage, a gas-heavy system may need fuel-price protection, a hydro-heavy system may need drought resilience, and a coal-heavy system may need transition capacity. Regional statistics should therefore be used to identify system constraints, not simply to rank markets by size.
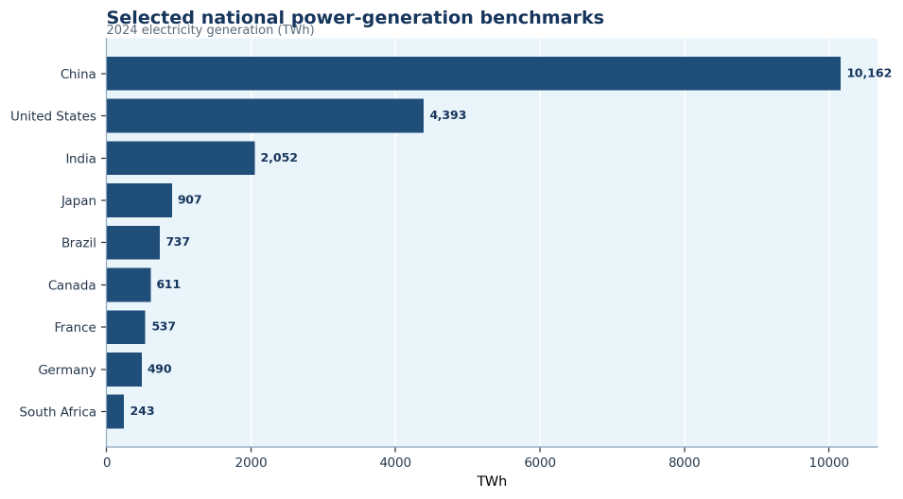
Figure 5. Regional power markets differ sharply, with Asia-Pacific leading demand scale, North America balancing gas and renewables, Europe managing clean-power integration, Latin America relying heavily on renewable resources, and Africa prioritizing access and reliability.
Country-Level Power Market Statistics
Country-level statistics make the article more useful because power systems are planned nationally and locally. Global averages do not show whether a market is coal-heavy, hydro-heavy, gas-heavy, nuclear-heavy, or dependent on imported fuel. They also do not show which countries are adding demand fastest.
Country benchmarks worth separating
• China’s electricity generation was 651.40% higher than in 2000, while India’s was 234.10% higher and the United States was 15.55% higher.
• China consumed 9,793.70 TWh of electricity in 2024, compared with 1,757.57 TWh for India.
• China’s consumption rose 7.15% year over year, while India’s increased 4.78%.
• These country differences explain why global power-market averages can hide very different planning realities.
| Country | Power market strength | Main challenge |
|---|---|---|
| China | Scale of generation, renewables and industrial electricity use | Coal dependence, grid balancing and regional congestion |
| United States | Gas generation, storage growth and large power demand | Transmission, peak demand and data-center load |
| India | Fast demand growth and expanding renewables | Reliability, coal transition and grid expansion |
| Germany | High renewable penetration and market reform experience | Grid congestion and backup capacity |
| France | Nuclear-heavy low-carbon supply | Fleet reliability and modernization |
| Brazil | Hydropower and rising wind/solar | Drought sensitivity and transmission needs |
| Japan | Advanced power system and solar capacity | Energy security and nuclear restart pace |
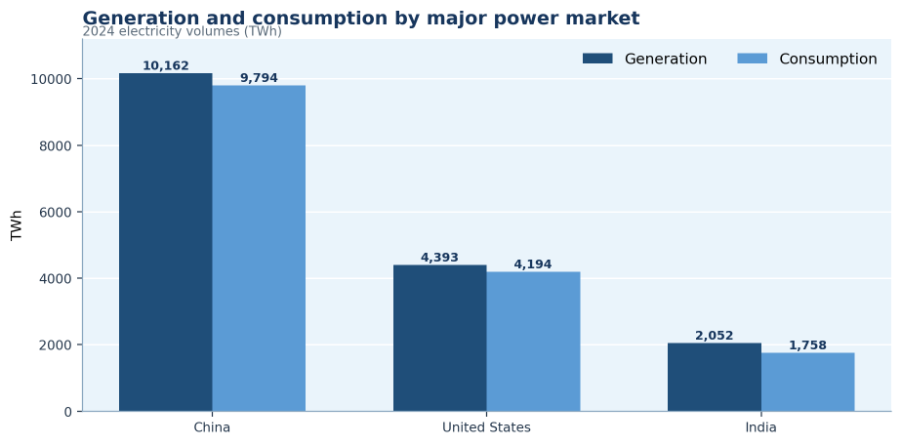
Figure 6. Country-level generation statistics show why power market analysis should separate China, the United States, India and other large systems instead of relying only on global averages.
Demand Growth Drivers Reshaping Electricity Systems
Demand growth is becoming more structural. Population, economic activity and industrial expansion still matter, but electricity now carries more of the energy system. Buildings, transport, cooling, digital infrastructure and manufacturing are all raising the importance of annual demand and peak demand.
Load drivers worth tracking
• Buildings grew electricity use by 5% in 2024, driven by cooling, appliances, urbanization and commercial activity.
• Industrial electricity use increased by nearly 4%, keeping heavy industry tied closely to power reliability and prices.
• Transport electricity consumption rose by over 8% as EV adoption moved more load onto electricity systems.
• Global electric car sales grew by more than 25%, with China accounting for almost two-thirds of sales and increasing EV sales by nearly 40%.
These drivers make demand growth more structural, linking electricity planning to buildings, cooling, transport, industry and digital infrastructure.
| Demand driver | Why it adds load | Market implication |
|---|---|---|
| Data centers and AI | High continuous power demand and local concentration | Raises grid connection and generation needs |
| Electric vehicles | Shifts transport energy from fuels to electricity | Adds charging infrastructure and peak management needs |
| Heat pumps | Electrifies heating demand | Can increase winter peak demand |
| Cooling | Raises summer load during heat waves | Increases grid stress and reserve needs |
| Industrial electrification | Replaces fossil-fuel process energy with electricity | Requires reliable large-scale supply |
Demand readout
Electricity demand is no longer just a macroeconomic indicator. It is a planning signal for digital infrastructure, transport, buildings, cooling and industrial competitiveness. The most useful demand forecast separates annual consumption from peak demand, because grid assets and reliability planning are often driven by the highest-load hours rather than average usage.
Power Market Investment Statistics
Power investment is moving across generation, grids, storage, digital infrastructure and clean-power supply chains. The important question is whether capital is balanced. Generation growth without grid expansion can create curtailment. Renewable growth without storage can increase balancing pressure. Grid upgrades without new supply can still leave reliability gaps.
Generation, grid and clean-power investment benchmarks
| Investment area | Why it matters |
|---|---|
| Renewable generation | Adds low-carbon capacity and reduces fuel exposure |
| Fossil generation | Supports reliability where dispatchable alternatives are limited |
| Nuclear | Provides firm low-carbon electricity where policy and economics support it |
| Transmission | Moves power from generation zones to demand centers |
| Distribution | Supports EVs, rooftop solar, heat pumps and local load growth |
| Storage | Balances variable renewable output and supports grid services |
| Digital grid | Improves monitoring, automation and demand response |
Investment planning principle
The best power-market investment plan does not chase one asset class. It balances generation, grids, storage, flexibility, affordability and emissions goals. A market can overbuild capacity and still underdeliver reliability if the investment mix ignores transmission, distribution, interconnection, reserve margins and local peak-load constraints.
Reliability, emissions, costs and infrastructure risks
• Global coal power capacity was 13% higher in 2024 than when the Paris Agreement was signed.
• Coal retirements equaled only about 57% of new coal capacity additions, showing why phase-down speed still matters.
• The risk is not only emissions. It is the possibility that demand growth, network delivery, affordability and reliability move at different speeds.
Risk data is useful when it leads to action on reliability, weather exposure, affordability, emissions and infrastructure bottlenecks.
| Risk area | Core signal | Why it matters |
|---|---|---|
| Reliability | Outages, reserve margins and peak demand | Protects households, factories and digital infrastructure |
| Emissions | Carbon intensity and fossil share | Tracks decarbonization progress |
| Grid congestion | Curtailment and price separation | Shows infrastructure bottlenecks |
| Fuel volatility | Gas and coal price exposure | Affects consumer prices and industrial costs |
| Weather risk | Heat waves, droughts and storms | Impacts demand, hydro output and grid assets |
| Investment gap | Grid and generation spending | Determines transition speed and reliability |
Risk interpretation
Power-market risk is often a mismatch problem. Demand may rise faster than capacity, renewable additions may outpace grids, fossil retirements may run ahead of firm replacement, and weather patterns may weaken hydro or raise cooling load. The strongest risk analysis tracks whether generation, grids, storage, fuel supply and market rules are moving together.
Power Market Opportunity Diagnostic
A polished power-market benchmark should help teams decide where to look next. The most useful diagnostic model connects statistics to practical action: where to add capacity, where to strengthen grids, where to add flexibility, and where to reduce risk.
| Opportunity area | Measure | Useful benchmark |
|---|---|---|
| Renewable expansion | Capacity additions and generation share | Renewables as a share of new power capacity |
| Grid modernization | Transmission investment, congestion and connection delays | Installed capacity growth versus grid readiness |
| Storage growth | Battery capacity, discharge duration and grid services | Solar and wind growth versus flexibility additions |
| Demand flexibility | Demand response and peak reduction | Buildings, industry and transport load growth |
| Electrification | EVs, heat pumps, data centers and industrial load | Annual consumption and peak demand growth |
| Energy security | Fuel dependence and domestic generation mix | Local generation diversity and import exposure |
2030 Power Market Planning Framework
Statistics become useful when they are translated into a planning framework. A 2030 power-market view should not focus on a single target. It should compare generation expansion, grid readiness, storage, reliability, affordability and emissions progress together.
| Planning area | Action | Output |
|---|---|---|
| Generation mix | Model demand growth, retirements and renewable additions | Reliable supply plan |
| Grid expansion | Prioritize transmission and distribution bottlenecks | Lower congestion and faster connections |
| Storage and flexibility | Add batteries, demand response and flexible resources | Better renewable integration |
| Reliability | Track reserve margins and outage risks | Stronger system resilience |
| Affordability | Compare investment cost with retail and industrial price impact | Balanced transition strategy |
| Emissions | Track power-sector carbon intensity and fossil share | Cleaner power supply |
Planning principle
The best power teams do not chase every benchmark. They compare external statistics against their own load, generation mix, grid constraints and customer base. Then they prioritize the gaps with high volume, clear ownership and measurable impact on reliability, affordability, emissions and energy security.
Metrics Power Market Leaders Should Track
The final scorecard should locate the pressure point without becoming a vanity dashboard. These are the minimum useful metrics for a mature power-market review.
| Metric | Why it matters |
|---|---|
| Total generation | Shows market size and production capacity |
| Demand growth | Shows pressure on supply and grids |
| Peak demand | Determines grid and capacity needs |
| Generation mix | Tracks fossil, renewable and nuclear balance |
| Renewable additions | Shows clean-power transition speed |
| Capacity factor | Shows actual output quality |
| Grid investment | Indicates infrastructure readiness |
| Storage capacity | Measures flexibility support |
| Outage duration | Shows reliability performance |
| Carbon intensity | Tracks emissions progress |
| Wholesale prices | Shows market stress |
| Imports and exports | Shows interconnection value |
Power Market Statistics FAQ
Common questions
What is the power market?
The power market includes electricity generation, transmission, distribution, wholesale trading, retail supply, grid balancing, storage, demand response, and the rules that decide how electricity reaches customers.
How large is the global power market?
Global electricity generation reached 30,664.34 TWh in 2024, while global electricity consumption reached 28,533.57 TWh. That scale means small percentage changes can represent hundreds of terawatt-hours of extra supply or demand.
Which country generates the most electricity?
China is the largest electricity generator by a wide margin. It generated 10,161.50 TWh in 2024, compared with 4,392.55 TWh for the United States and 2,051.78 TWh for India.
What is the fastest-growing source of new power capacity?
Solar PV is the fastest-growing major source of new power capacity. The world added a record 452 GW of solar capacity in 2024, equal to roughly 77% of all renewable capacity added that year.
Are renewables now the largest source of new power capacity?
Yes. Renewables accounted for 92.5% of global power capacity additions in 2024, with total additions reaching 585 GW. The caveat is that new capacity still has to be matched with generation output, storage and grid readiness.
Which power-market metrics matter most?
The most useful scorecard combines generation, consumption, peak demand, capacity additions, generation mix, grid investment, storage, outages, prices, carbon intensity and import/export dependence.
Final Takeaway
Power market performance increasingly depends on multiple systems working together, including electricity demand, the generation mix, grid infrastructure, energy storage, reliability, affordability, and emissions. Electricity consumption is growing rapidly in many markets, renewable generation capacity continues to expand, while fossil-fuel generation still plays an important role in maintaining reserve margins and system reliability. Effective financial and operational record-keeping, including documentation such as a rent receipt, can also support better management of related business expenses.
The most useful power-market analysis finds the actual constraint. If demand rises faster than supply, the issue is capacity. If renewable projects are waiting to connect, the issue is grid readiness. If solar output is being curtailed, the issue may be flexibility, storage, or transmission.
For power-market leaders, the practical goal is a system that is reliable, affordable, cleaner, flexible, and regionally secure. That means tracking generation and demand together, comparing capacity additions with actual output, expanding grids before bottlenecks become expensive, and adding storage where variable renewables are rising.


