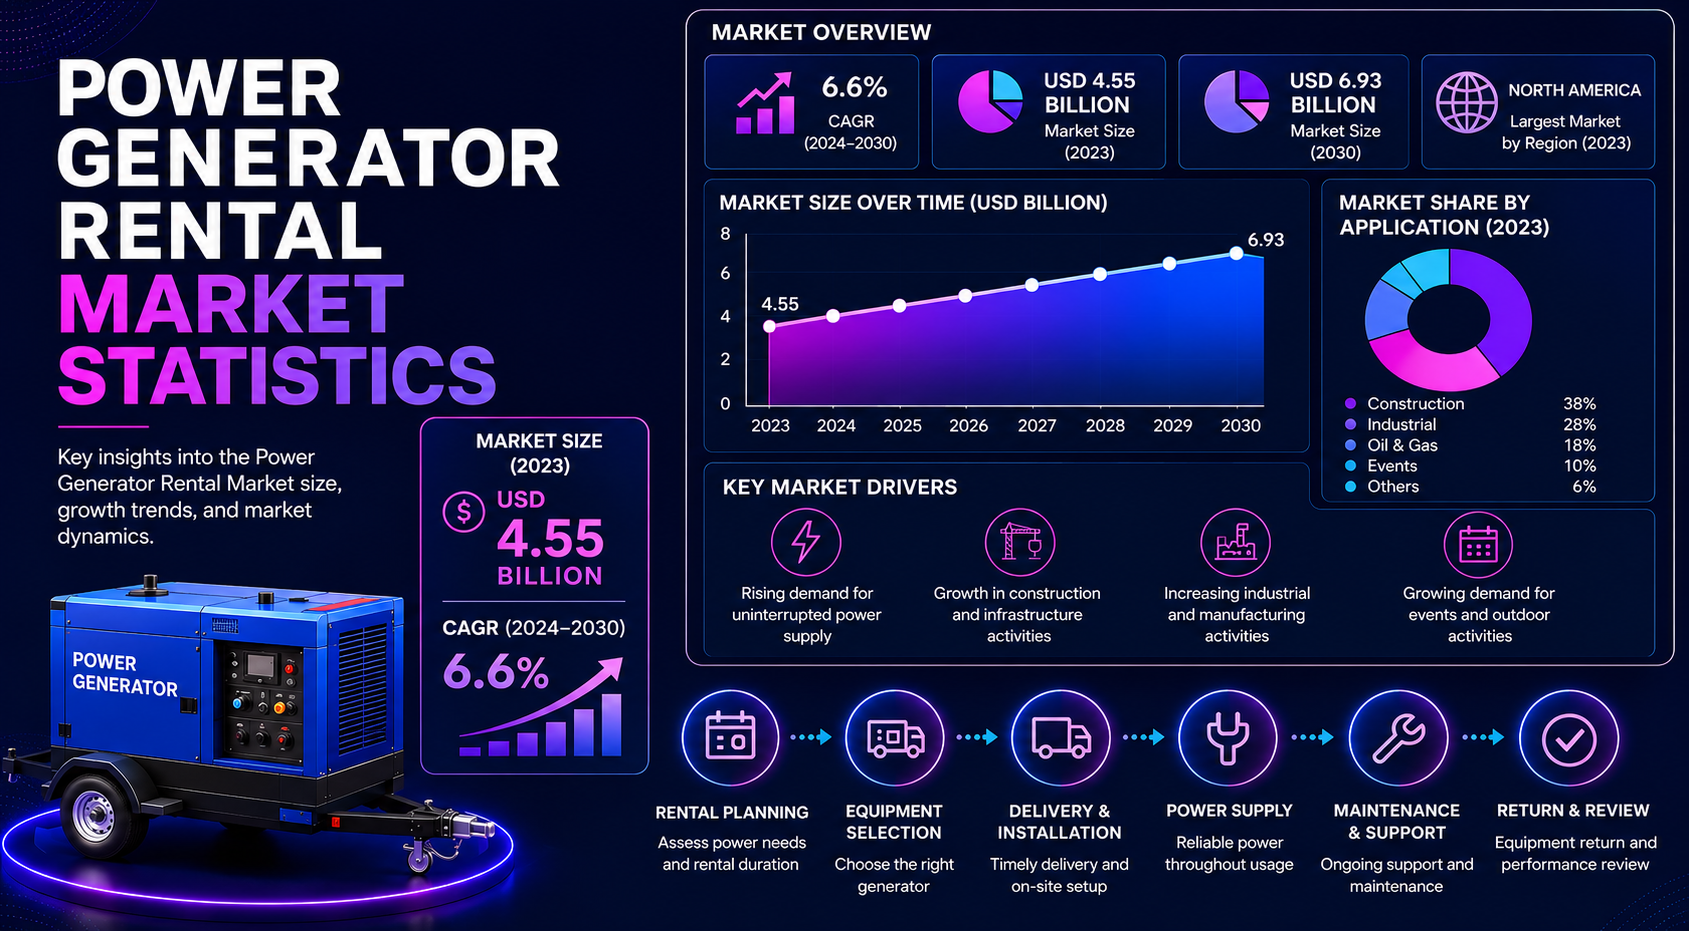
Power generator rental is where temporary power demand is protected, delayed, or disrupted. Construction sites, oilfields, mining operations, hospitals, data centers, telecom networks, utilities, festivals, and commercial facilities may not always need permanent generation assets, but they still need reliable electricity at the exact moment operations begin. That makes generator rental a reliability service, not only an equipment category.
The strongest statistics show why this market deserves its own scorecard. The power generator rental market was estimated at USD 13.26 billion in 2025, is estimated at USD 14.05 billion in 2026, and is projected to reach USD 18.75 billion by 2031. Diesel units command 68.72% of revenue, standby and backup rentals account for 53.65%, the 101–500 kVA band accounts for 38.12%, and construction leads end-use demand with 26.74% share. Data centers are forecast to record the highest end-user CAGR at 9.66%, showing that temporary power is becoming increasingly tied to digital infrastructure and uptime.
A useful generator rental benchmark separates planned project power from urgent backup demand. It also separates fuel type, power rating, application, end use, region, and rental logistics. The sections below use that structure to show where temporary power demand is concentrated, which segments are growing fastest, and which operating metrics matter most for rental companies and equipment users.
Executive Generator Rental Benchmarks
These statistics frame the generator rental opportunity. They show the scale of the market, the dominance of diesel, the importance of backup power, the central role of construction, and the faster growth emerging in hybrid systems, peak shaving, Asia-Pacific, and data-center demand.
The numbers that define the generator rental market
• Power generator rental revenue was estimated at USD 13.26 billion in 2025.
• The market is estimated at USD 14.05 billion in 2026 and projected to reach USD 18.75 billion by 2031.
• Generator rental is forecast to grow at a 5.95% CAGR from 2026 to 2031.
• Diesel led the market with 68.72% revenue share in 2025.
• Standby and backup rentals commanded 53.65% of generator rental revenue in 2025.
• The 101–500 kVA rating band accounted for 38.12% of market size in 2025.
• Construction led end-use demand with 26.74% revenue share in 2025.
• Construction sites accounted for USD 3.55 billion of generator rental market size in 2025.
• Asia-Pacific captured 32.48% of generator rental revenue in 2025 and is forecast to grow at a 7.55% CAGR through 2031.
• Data centers represented a USD 1.58 billion rental base in 2025 and are forecast to grow at a 9.66% CAGR through 2031.
• Hybrid battery-integrated rental generator sets are forecast to grow at a 9.35% CAGR through 2031.
• Peak-shaving rentals are forecast to advance at an 8.92% CAGR through 2031.
Editorial readout
Generator rental demand is best understood as several markets operating at once: construction site power, industrial uptime, emergency response, remote operations, and grid support. Total revenue shows the size of the opportunity, but fleet strategy should be based on the combination of region, power rating, fuel, application, rental duration, and response urgency.
Why Generator Rental Now Carries Billion-Dollar Power Stakes
Generator rental matters most when temporary power is connected to construction schedules, emergency response, utility reliability, industrial continuity, and digital infrastructure. A permanent generator can be expensive, slow to deploy, or difficult to justify when the need is seasonal, project-based, or uncertain. Rental solves a different problem by providing electricity capacity for the exact period, location, and load profile where the customer needs it.
The market also benefits from demand that is difficult to forecast perfectly. Storm damage, grid weakness, equipment failure, maintenance shutdowns, oilfield activity, remote mining work, and peak-load periods create urgent power requirements. Providers that can move equipment quickly, service it reliably, and match the right capacity to the job are not merely renting machines. They are selling uptime.
Market-size and growth benchmarks
• Power generator rental revenue was estimated at USD 13.26 billion in 2025.
• The market is estimated at USD 14.05 billion in 2026.
• The market is projected to reach USD 18.75 billion by 2031.
• The forecast points to a 5.95% CAGR from 2026 to 2031.
• Another market estimate placed generator rental at USD 8.99 billion in 2025 and USD 11.96 billion by 2030.
• The broader power rental market was valued at USD 13.61 billion in 2025 and is projected to reach USD 22.51 billion by 2034.
Market estimates vary because some sources measure generator rental only while others include temporary power, mobile power, or wider power-rental services. The series should therefore be kept separate rather than averaged. The consistent direction is that flexible power capacity remains a growing operating requirement for construction, industrial, utility, digital, and emergency users.
| Scope | Base benchmark | Forecast / growth |
|---|---|---|
| Power generator rental | USD 13.26B (2025) | USD 18.75B (2031) |
| Power generator rental | USD 14.05B (2026) | 5.95% CAGR to 2031 |
| Alternative generator-rental scope | USD 8.99B (2025) | USD 11.96B (2030) |
| Broader power rental | USD 13.61B (2025) | USD 22.51B (2034) |
| Data-center rentals | USD 1.58B (2025) | 9.66% CAGR to 2031 |
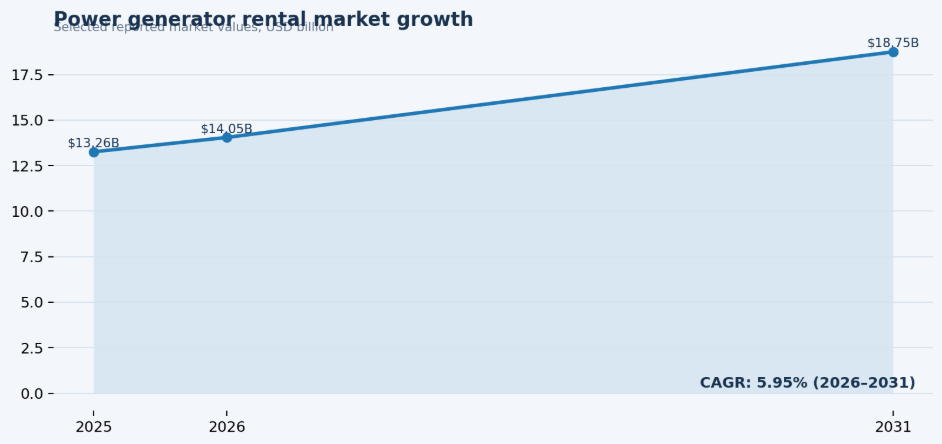
Figure 1. Reported generator rental market values show steady growth through 2031, while alternative market estimates should remain separate because their scopes differ.
Where Temporary Power Demand Starts Building
Temporary power demand begins when an organization needs electricity faster, more flexibly, or more economically than a permanent asset can provide. The need may be planned, such as construction, maintenance, mining, or an event. It may also be urgent, such as an outage, storm response, industrial failure, or grid-support requirement. The same rental fleet can serve both types of demand, but the commercial model is different.
Demand drivers worth separating
• Construction led generator rental end-use demand with 26.74% revenue share in 2025.
• Construction sites accounted for USD 3.55 billion of generator rental market size in 2025.
• Standby and backup applications commanded 53.65% of rental revenue in 2025.
• Peak-shaving rentals are forecast to advance at an 8.92% CAGR through 2031.
• Data centers represented a USD 1.58 billion generator rental base in 2025.
• Data centers are forecast to record a 9.66% CAGR through 2031.
• Hybrid battery-integrated rental generator sets are forecast to grow at a 9.35% CAGR through 2031.
| Demand driver | Why it matters | Typical users |
|---|---|---|
| Grid instability | Creates backup and emergency need | Utilities, healthcare, telecom |
| Construction growth | Requires temporary pre-grid power | Contractors, infrastructure |
| Remote operations | Creates off-grid project demand | Mining, oil and gas |
| Peak-load pressure | Requires temporary load support | Utilities, manufacturing |
| Critical uptime | Makes interruption expensive | Data centers, hospitals |
| Emissions pressure | Changes fleet technology choice | Urban projects, events |
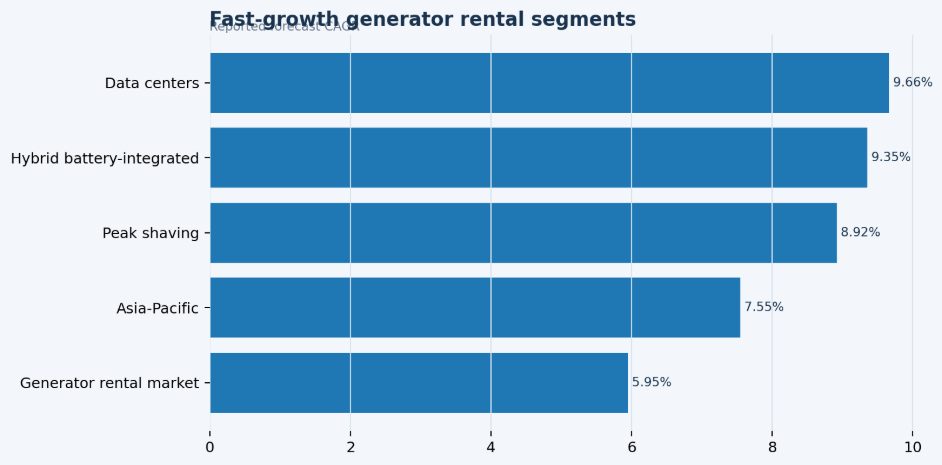
Figure 2. Data centers, hybrid systems, peak shaving, and Asia-Pacific are growing faster than the overall generator rental market in the cited forecasts.
Diesel, Gas, and Hybrid Rentals: How Fuel Choice Shapes the Market
Fuel type is one of the most important generator-rental decisions because it affects power output, fuel logistics, emissions, noise, site access, and customer economics. Diesel remains the rental baseline because it is widely available, rugged, and familiar across construction, mining, oil and gas, and emergency applications. Gas units, hybrid systems, and battery-supported rentals are gaining attention where emissions, runtime optimization, and noise limits matter.
Fuel benchmarks
• Diesel units held 68.72% of the power generator rental market in 2025.
• Diesel generator rentals represented USD 9.11 billion in 2025.
• Hybrid battery-integrated rental generator sets are forecast to expand at a 9.35% CAGR through 2031.
• Hybrid generator systems can cut diesel consumption by up to 80% through battery load sharing and intelligent controls.
• United Rentals described an EHR Solar Battery Generator with a 5 kW PV canopy and 45 kVA propane unit.
• Atlas Copco, Cummins, and Aggreko are bundling batteries across selected generator frames to support cleaner rental configurations.
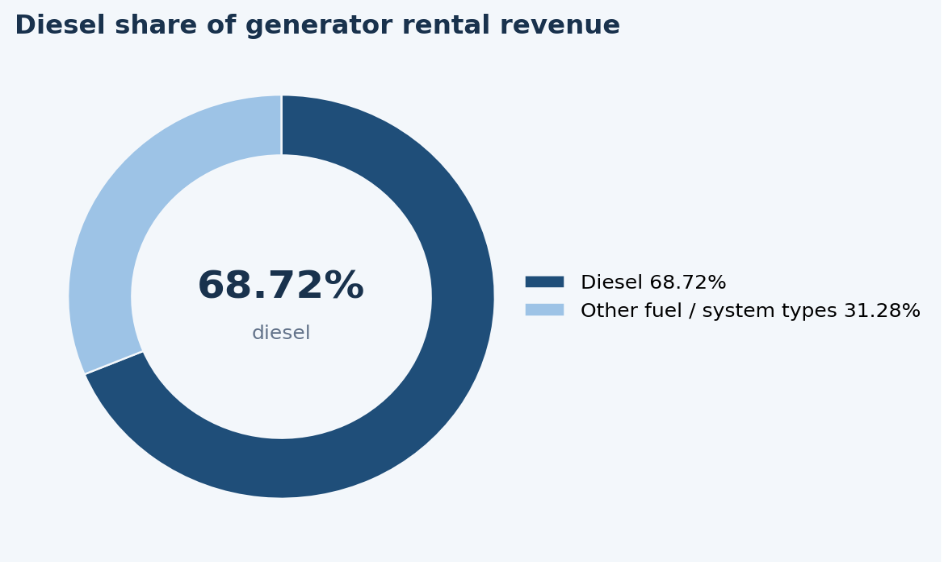
Figure 3. Diesel still accounts for more than two-thirds of generator rental revenue, even as hybrid and battery-supported systems create faster-growth niches.
Fuel-mix interpretation
Diesel remains the fleet baseline because it is available, familiar, and suited to demanding work. The growth opportunity is more selective: hybrid, gas, and battery-supported systems matter most where emissions, noise, or fuel efficiency influence project approval and customer economics. Rental companies therefore need a transition strategy rather than a one-fuel assumption.
Power Rating Statistics: From Small Site Power to Large Industrial Loads
Power rating turns generator rental from a general service into a capacity-planning decision. A telecom tower, retail outage, construction site, mine, and utility-support project do not require the same generator class. Rental companies therefore need to review demand by kVA band, not only by unit count or total revenue.
Capacity benchmarks
• The 101–500 kVA rating band accounted for 38.12% of generator rental market size in 2025.
• The 101–500 kVA band generated USD 5.06 billion in 2025.
• This rating band is forecast to grow at a 6.62% CAGR through 2031.
• A 250 kVA generator can support tower cranes, batch plants, edge data halls, and medium-duty site loads while remaining towable.
• Larger rental requirements extend toward high-capacity and multi-megawatt packages for mining, oilfield, utility, and remote industrial work.
| Power rating | Typical demand | Rental implication |
|---|---|---|
| Below 75 kVA | Lighting, telecom, small commercial loads | Short, mobile rentals |
| 75–375 kVA | Tools, pumps, HVAC and site work | Repeat construction demand |
| 375–750 kVA | Industrial support and utility work | Longer service cycles |
| Above 750 kVA | Mining, oil/gas and data-center loads | High-value engineered rentals |
Power-rating readout
The 101–500 kVA band covers the practical middle of the rental market, which explains its large share. Smaller units create mobility and volume, while larger packages carry higher revenue potential and more engineering complexity. Fleet planning should therefore track utilization and margin by capacity class, not only by total generator count.
Applications: Standby, Prime, Continuous, and Emergency Rental Power
Application data explains why the same generator can represent very different business value. A standby unit protects against interruption. A prime-power unit may run as the main electricity source at a remote location. A peak-shaving rental supports temporary demand management, while an emergency rental restores operations after a storm, equipment failure, or grid event.
Application benchmarks
• Standby and backup rentals commanded 53.65% of generator rental revenue in 2025.
• Peak-shaving rentals are forecast to advance at an 8.92% CAGR through 2031.
• Standby power rental was worth USD 9.4 billion in 2025 in an adjacent market benchmark.
• Standby power rental is predicted to grow to USD 13.7 billion by 2035.
• Standby power rental is forecast to grow at a 3.8% CAGR from 2025 to 2035.
| Application | Main use | Commercial signal |
|---|---|---|
| Standby / backup | Protects operations when grid power fails | Large reliability-driven share |
| Prime power | Main site electricity at remote locations | Longer off-grid rentals |
| Continuous power | Extended industrial or project runtime | Service-intensive demand |
| Peak shaving | Temporary support during high demand | Faster-growth planning use |
| Emergency power | Rapid response after disruption | Speed and availability matter |
Application rule
The 53.65% standby and backup share shows how strongly the market is tied to reliability. Peak shaving adds a second signal: rental is also becoming a planned grid and load-management tool. A mature fleet strategy needs both rapid-response capacity and longer-duration project capacity because the service requirements are different.
End-Use Demand: Construction, Oil and Gas, Mining, Utilities, Events, and Data Centers
End-use statistics are among the highest-value parts of a generator rental benchmark because global averages can hide why customers actually rent. Construction companies need power before permanent grid service is available. Utilities rent during maintenance and outages. Mining and oilfield operators use large units in remote locations. Events need reliable temporary electricity for short periods. Data centers connect rental directly to digital uptime.
Construction
Construction is the most visible generator rental use case because temporary sites need electricity before permanent infrastructure is ready. Contractors use rental generators for cranes, lighting, pumps, welding, tools, site offices, batch plants, HVAC, and safety systems. Because construction projects are scheduled, they can support longer rental durations and recurring demand.
• Construction led the power generator rental market with 26.74% revenue share in 2025.
• Construction sites accounted for USD 3.55 billion of generator rental market size in 2025.
• Grand View Research reported construction held over 23.0% of broader power rental revenue share in 2025.
Oil and gas
Oil and gas rental demand is tied to drilling, exploration, pipeline work, field camps, refinery maintenance, and temporary support during shutdowns. The work can be remote, high-load, and service-sensitive. A generator failure can stop site activity, which means the commercial offering must combine equipment availability with maintenance capability, fuel logistics, and technical support.
Mining
Mining demand is similar to oilfield demand because many sites are remote, harsh, and power-intensive. Rental generators support camps, dewatering, processing equipment, lighting, crushers, workshops, and temporary grid replacement. Large-capacity rentals are especially important where grid access is weak or project duration does not justify permanent assets.
Utilities
Utilities rent generators for planned maintenance, outage recovery, grid support, temporary substations, and emergency response. This customer group values speed, reliability, load matching, and service coverage. Demand can be seasonal in storm-prone regions and project-based where grid upgrades or maintenance work are underway.
Events and commercial sites
Events, festivals, sports venues, film production, exhibitions, hotels, retail facilities, and commercial buildings create a different temporary-power rhythm. Rental periods can be short, but failure may be highly visible and expensive. Noise, emissions, setup time, redundancy, and support during the event can matter more than simple daily rental price.
Telecom and data centers
Telecom and data centers connect generator rental to digital uptime. Data centers represented a USD 1.58 billion rental base in 2025 and are forecast to record a 9.66% CAGR through 2031. The segment matters because demand is linked to redundancy, maintenance windows, edge computing, testing, and backup continuity rather than only to temporary construction power.
| Industry | Generator rental need | Common demand pattern |
|---|---|---|
| Construction | Site power, cranes, pumps and offices | Planned project rentals |
| Oil and gas | Drilling, pipelines and field camps | Service-heavy remote rentals |
| Mining | Camps, dewatering and processing loads | Large-capacity rentals |
| Utilities | Outages, maintenance and peak support | Urgent or scheduled deployments |
| Events | Venues, sound, lighting and HVAC | Short scheduled rentals |
| Data centers | Backup, testing and maintenance support | High-reliability rentals |
Regional Generator Rental Intelligence
Regional generator rental data matters because temporary power is local by nature. A fleet has to be close enough to deploy, and the demand profile changes with grid reliability, construction cycles, mining activity, oil and gas investment, emissions rules, and storm exposure. The cited sources also use different scopes, so generator rental, broader power rental, and mobile power generation equipment rental figures should remain clearly labeled rather than combined.
North America
• North America generated USD 2,420.5 million in mobile power generation equipment rental revenue in 2024.
• North American mobile power generation equipment rentals are expected to grow at a 5.8% CAGR from 2025 to 2030.
• North America represented 23.05% of global power rental demand in 2025 in a separate benchmark.
• North America power rental market revenue stood at USD 3.15 billion in 2025 and is projected at USD 3.37 billion in 2026.
• North America holds approximately 38% of the mobile power generation equipment rentals market share in another source scope.
The region combines construction, oil and gas, data centers, utilities, commercial facilities, and weather-related outage demand. The United States provides the largest country-level mobile rental base in the cited dataset, while Canada shows faster percentage growth.
Europe
• Europe power rental market revenue reached USD 4.9 billion in 2025 in a broader power-rental benchmark.
• Europe power rental revenue is expected to reach USD 7.3 billion by 2034.
• The corresponding broader-market CAGR is 4.30% during 2026–2034.
• United Kingdom mobile power generation equipment rentals generated USD 234.6 million in 2024 and are expected to reach USD 427.5 million by 2030.
• Russia mobile power generation equipment rentals generated USD 125.1 million in 2024 and are expected to reach USD 187.0 million by 2030.
Europe’s demand is shaped by construction, events, utility maintenance, industrial backup, and emissions regulation. Urban projects and public events may place greater emphasis on quieter or cleaner fleets, creating a strong environment for hybrid and battery-supported rental configurations.
Asia-Pacific
• Asia-Pacific captured 32.48% of global power generator rental revenue in 2025.
• Asia-Pacific is forecast to be the fastest-growing generator rental region at a 7.55% CAGR through 2031.
• Applying the stated 32.48% share to the USD 13.26 billion global market implies approximately USD 4.31 billion of regional generator rental revenue in 2025; this is a derived value.
• China accounts for approximately 35% of Asia-Pacific mobile power generation equipment rental market share in the cited mobile-rental dataset.
• Japan contributes approximately 19% of Asia-Pacific mobile power generation equipment rental market share.
• Asia-Pacific represents approximately 28% of the mobile power generation equipment rental market in another source scope.
Asia-Pacific combines infrastructure investment, manufacturing expansion, mining, urban development, and grid-reliability needs. The fastest regional growth rate in the cited generator-rental outlook makes fleet depth and local service coverage especially important.
Middle East and Africa
Middle East and Africa demand is heavily influenced by oil and gas, mining, mega projects, remote sites, infrastructure development, and commercial expansion. The uploaded source does not provide a directly comparable regional revenue figure for this section, so the market should be discussed through its demand profile rather than by inserting an unsupported estimate. Saudi Arabia, the UAE, and South Africa are important operational markets within the broader regional story.
Latin America
• Latin America generated USD 613.9 million in mobile power generation equipment rental revenue in 2024.
• Brazil generated USD 276.2 million in mobile power generation equipment rental revenue in 2024.
• Brazil mobile power generation equipment rental revenue is expected to reach USD 467.6 million by 2030.
• Brazil is identified as one of the faster-growing country markets in the regional mobile-rental dataset.
Latin American demand is shaped by mining, construction, oil and gas, utilities, and grid reliability. The region requires country-level planning because fleet needs can vary widely with project cycles, infrastructure quality, and the distance between equipment depots and customer sites.
| Region | Main demand source | Rental implication |
|---|---|---|
| North America | Construction, outages, data centers | Emergency response plus large-unit fleet |
| Europe | Events, construction, emissions rules | Cleaner, quieter and urban-ready fleets |
| Asia-Pacific | Infrastructure, manufacturing, mining | Deep fleet and expansion capacity |
| Middle East & Africa | Oil/gas, mega projects, mining | Remote heavy-duty service coverage |
| Latin America | Mining, oil/gas, grid reliability | Local fleet availability and logistics |
Country-Level Generator Rental Statistics
Country-level statistics prevent a common planning error: assuming generator rental demand behaves the same way everywhere. A country with heavy mining demand, weak grid reliability, or strong construction activity has a different fleet profile from one where demand is driven by events, urban construction, or utility maintenance. The figures below use the mobile power generation equipment rental scope where the uploaded article provides direct country values.
Country benchmarks
• United States mobile power generation equipment rentals generated USD 1,815.4 million in 2024 and are expected to reach USD 2,436.8 million by 2030.
• Canada generated USD 363.1 million in 2024 and is expected to reach USD 580.4 million by 2030.
• United Kingdom mobile power generation equipment rentals generated USD 234.6 million in 2024 and are expected to reach USD 427.5 million by 2030.
• Russia generated USD 125.1 million in 2024 and is expected to reach USD 187.0 million by 2030.
• Brazil generated USD 276.2 million in 2024 and is expected to reach USD 467.6 million by 2030.
• Germany generated USD 203.2 million in 2024 and is expected to reach USD 318.8 million by 2030.
• Canada is identified as the fastest-growing North American market in the cited country dataset and is projected to reach USD 580.4 million by 2030.
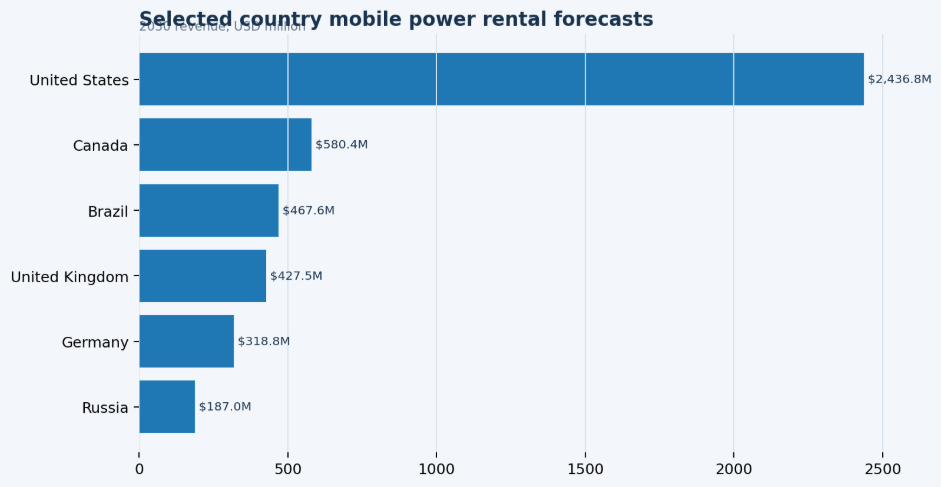
Figure 4. Country-level mobile power rental forecasts show the difference between mature high-volume markets and smaller markets with strong expansion potential.
| Country | 2024 revenue | 2030 forecast | CAGR / signal |
|---|---|---|---|
| United States | USD 1,815.4M | USD 2,436.8M | 5.1% |
| Canada | USD 363.1M | USD 580.4M | 8.2% |
| United Kingdom | USD 234.6M | USD 427.5M | 10.6% |
| Russia | USD 125.1M | USD 187.0M | 7.0% |
| Germany | USD 203.2M | USD 318.8M | 7.8% |
| Brazil | USD 276.2M | USD 467.6M | Fast-growth signal |
Country interpretation
The United States has the largest mobile-rental base in the cited country dataset, but percentage growth is stronger in several smaller markets. Large markets require availability, service density, and replacement fleet. Faster-growth markets require depot expansion, customer acquisition, and enough capacity to avoid losing new demand during peak periods.
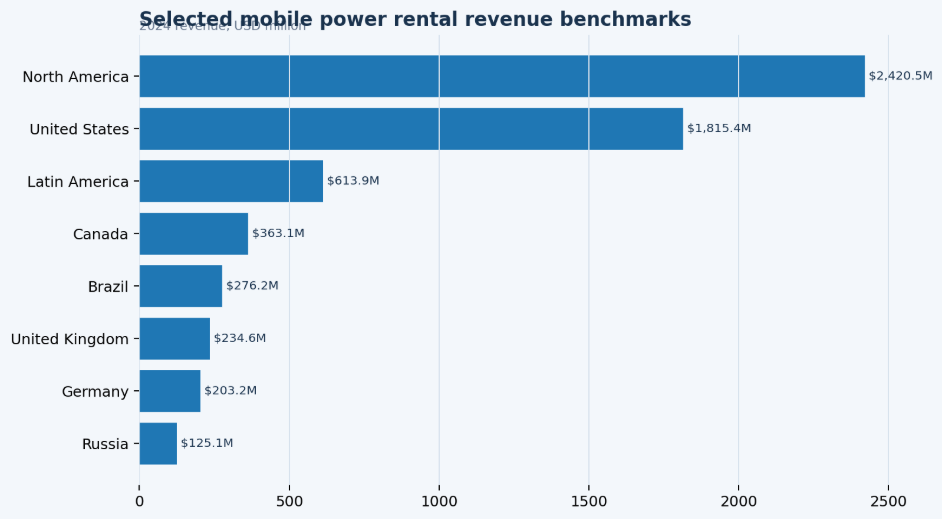
Figure 5. Selected 2024 mobile rental revenue benchmarks show the importance of local fleet depth and country-specific service coverage.
Mobile Generator Rental: Fast Deployment and Emergency Power
Mobile generator rental is important because temporary power is often a logistics problem before it is an equipment problem. Customers need units that can be moved, connected, fueled, monitored, and serviced quickly. This is especially true for storm response, emergency outages, events, construction sites, utility work, and remote industrial operations.
Mobile rental benchmarks
• North America generated USD 2,420.5 million in mobile power generation equipment rental revenue in 2024.
• Latin America generated USD 613.9 million in mobile power generation equipment rental revenue in 2024.
• Enterprise applications held over 61.0% of mobile power generation equipment rental revenue in 2024.
• The personal segment accounts for nearly 26% of mobile power generation equipment rental market size.
• Generators account for approximately 68% of the mobile power generation equipment rental market share.
• Turbines contribute nearly 32% of the mobile power generation equipment rental market size.
Mobile rental readout
Mobile rental data emphasizes the value of speed. These units are deployable uptime tools for outages, events, utilities, construction sites, and remote operations. A rental provider should therefore track dispatch readiness, towable capacity, delivery distance, connection time, and service response alongside traditional fleet utilization.
Grid Outages and Emergency Rental Demand
Emergency generator rental is a high-value signal because downtime is expensive for hospitals, telecom networks, data centers, utilities, industrial sites, and commercial facilities. When grid power fails or maintenance creates a temporary reliability gap, rental power protects continuity. The commercial test is not only whether a generator is available, but how quickly it can be delivered, connected, fueled, and supported.
| Use case | Trigger | Operational metric |
|---|---|---|
| Storm outage | Severe weather / grid damage | Dispatch time |
| Hospital backup | Grid interruption | Runtime assurance |
| Telecom continuity | Site outage | Fuel uptime |
| Data-center support | Maintenance or redundancy | Load reliability |
| Event power | Scheduled event | Setup reliability |
| Utility maintenance | Planned shutdown | Available kVA |
Emergency rental rule
Emergency demand should not be treated as the whole market. Outages reveal where response speed and grid reliability matter, while scheduled project rentals show where construction, mining, industrial work, and events are building. A balanced rental company needs both immediate-response fleet and longer-duration project fleet.
Construction and Infrastructure Rental Demand
Construction deserves separate attention because it anchors a large share of generator rental demand and creates predictable rental opportunities. Sites often need power before grid service is available, and the load profile changes as a project moves from groundworks to vertical construction, fit-out, commissioning, and handover.
A construction project may rent small units for lighting and site offices early in the build, mid-range units for pumps and tools, and larger units for cranes, batch plants, temporary HVAC, or commissioning work. Infrastructure projects such as roads, bridges, airports, rail, tunnels, water systems, and industrial parks can create long-duration temporary power requirements.
• Construction led generator rental end-use demand with 26.74% revenue share in 2025.
• Construction sites accounted for USD 3.55 billion of generator rental market size in 2025.
• Grand View Research reported construction held over 23.0% of broader power rental revenue share in 2025.
• The 101–500 kVA rating band, often relevant to site power, accounted for 38.12% of generator rental market size in 2025.
Construction interpretation
Construction rental is often primary power rather than backup power. That changes the service model: rental duration, site access, delivery timing, generator resizing, fuel logistics, maintenance visits, and noise restrictions all become part of the customer experience. Project schedules can also make construction demand more predictable than emergency rentals.
Oil, Gas, and Mining Generator Rental Demand
Oil, gas, and mining applications often require rugged, high-capacity, service-backed rental generators. These customers may operate far from dense grids and cannot always wait for permanent power connections. Rental units can support exploration, drilling, pumping, processing, temporary camps, maintenance shutdowns, equipment testing, and dewatering.
| Industry | Rental need | Why rent |
|---|---|---|
| Oil and gas | Drilling, pipelines and field camps | Flexible remote deployment |
| Mining | Camps, crushers and dewatering | Staged project demand |
| Refineries | Turnarounds and backup | Shutdown coverage |
| Remote infrastructure | Road, rail and telecom projects | Grid delay or absence |
Heavy-industry interpretation
Heavy-industry rental demand is not only about generator size. It is about uptime, fueling, technical support, safety compliance, and reliability in difficult operating conditions. Providers that package equipment with field service and monitoring can create more defensible value than providers competing only on daily rental rate.
Events, Commercial Sites, and Temporary Venue Power
Events and commercial rentals add a different rhythm to the market. The rental period may be short, but failure can be public and expensive. Concerts, festivals, exhibitions, sports venues, film production, outdoor retail, hotels, and temporary venues need power for lighting, sound, screens, broadcast, food service, cooling, heating, ticketing, security, and backup.
This demand is often planned, but it remains service-sensitive. Event operators need equipment delivered on schedule, tested before opening, and supported during the event. Noise and emissions also matter because generators may operate near crowds, neighborhoods, or regulated urban zones. That is why hybrid, battery-supported, and lower-noise configurations can be especially attractive in event markets.
Commercial sites may rent generators during planned outages, electrical upgrades, equipment replacement, seasonal peaks, or emergency interruptions. For hotels, retail centers, offices, cold storage, and healthcare-related facilities, the financial cost of an interruption can exceed the cost of rental power, making reliability and rapid setup central to buying decisions.
Competitive Landscape and Rental Fleet Strategy
The generator rental competitive landscape includes global rental companies, regional specialists, equipment dealers, manufacturer-backed rental networks, and local emergency-power providers. Customers often choose a provider based on availability, response time, service coverage, power engineering support, fuel logistics, and price. In urgent situations, the closest credible fleet can win the order.
• Major companies and rental networks cited in the uploaded article include Aggreko, United Rentals, Sunbelt Rentals, Herc Rentals, Caterpillar rental partners, Atlas Copco, Cummins, APR Energy, and Generac Mobile.
• Enterprise applications held over 61.0% of mobile power generation equipment rental revenue in 2024.
• Generators account for approximately 68% of mobile power generation equipment rental market share, while turbines contribute nearly 32%.
• North America holds approximately 38% of mobile power generation equipment rental market share in the cited mobile-rental scope.
| Company type | Core strength | Typical customer need |
|---|---|---|
| Global rental company | Fleet depth and multi-region coverage | Utilities, industrial, events |
| Regional specialist | Local speed and relationships | Construction, commercial |
| Manufacturer / dealer network | Equipment and parts expertise | Industrial, engineered projects |
| Emergency-power provider | Rapid outage response | Hospitals, telecom, utilities |
| Event power specialist | Quiet temporary site power | Venues and festivals |
Competitive interpretation
Generator rental is a service market as much as an asset market. Fleet size matters, but it creates an advantage only when the provider can deliver, install, fuel, maintain, and retrieve units efficiently. Utilization, uptime, field-service productivity, depot coverage, and response time should be reviewed together.
Emergency Rental Demand: Useful Signal, Not the Whole Market
Emergency rentals reveal where customers face high downtime risk. A storm, utility interruption, data-center maintenance window, hospital backup issue, or telecom outage can create urgent demand. But emergency activity is not the whole market. A provider that only chases outage response can miss stable, recurring, project-based opportunities.
The more useful approach is to separate emergency demand from scheduled demand. Emergency activity should be measured through response time, available units, service readiness, and customer urgency. Scheduled demand should be measured through construction starts, infrastructure projects, mining activity, event calendars, utility maintenance plans, and rental duration. Both matter, but they require different operating plans.
This is why generator rental statistics should not be read as one blended market number. Diesel share, standby share, construction share, Asia-Pacific growth, data-center CAGR, mobile rental revenue, and country growth each describe a different demand signal. A strong benchmark uses those signals together to explain where demand is growing and how the fleet should respond.
Rental Duration, Pricing, and Customer Economics
Rental duration changes the economics of temporary power. Emergency jobs may last only long enough to stabilize a facility, while construction, mining, utility maintenance, and remote infrastructure projects can keep generators on rent for weeks or months. The same generator can therefore produce very different revenue depending on how often it is dispatched, how long it remains on site, how far it travels, and how much service support the customer requires.
For rental companies, daily rate alone is an incomplete measure. A lower daily price can still produce an attractive return when a unit remains on hire for a long period with limited service intervention. A high-priced emergency rental can be less attractive if delivery distance, overtime labor, fuel logistics, and rapid retrieval consume most of the margin. This is why average rental duration, revenue per generator, revenue per kVA, and service cost per rental should be reviewed together rather than separately.
Pricing signals worth separating
• Emergency rentals usually place a premium on availability, dispatch speed, setup, and after-hours support rather than on the lowest daily rate.
• Construction and infrastructure rentals can create longer utilization periods because temporary power is often required across multiple project phases.
• Large industrial and mining packages can generate higher contract value but also require more engineering, transport, fueling, and field-service support.
• Event rentals may be short in duration but can require redundancy, low-noise configurations, standby technicians, and strict delivery schedules.
• Data-center and hospital support can justify premium service levels because the financial cost of downtime may be far higher than the rental charge.
• Fuel surcharges and transport costs can materially change rental economics when generators operate remotely or at high duty cycles.
• A useful pricing review separates equipment rate, delivery, installation, fuel, service, accessories, environmental compliance, and emergency-response premiums.
The practical implication is that market growth does not automatically create better rental economics. Providers need to know which customer groups generate long utilization, which jobs create repeat service revenue, and which emergency deployments consume disproportionate logistics cost. A disciplined rate card should therefore reflect urgency, capacity, rental duration, site complexity, fuel requirements, and support intensity.
Fleet Availability, Maintenance, and Service Response
Generator rental is asset-intensive, so the quality of fleet management determines how much market demand a provider can actually capture. A company may operate in a fast-growing region and still miss revenue if the right capacity band is unavailable, if high-use units are in maintenance, or if transport resources cannot reach the customer quickly. The market statistics therefore need to be paired with a fleet-availability scorecard.
Availability and service signals
• Fleet utilization shows whether owned generators are producing revenue or sitting idle between assignments.
• Maintenance downtime measures how much earning capacity is unavailable because units are awaiting repair, inspection, parts, or scheduled service.
• Regional availability compares local demand with the generators physically positioned close enough to deploy economically.
• Large-capacity utilization helps identify whether industrial, mining, oilfield, utility, and data-center demand is outgrowing the heavy-duty fleet.
• Emergency response time measures the provider’s ability to convert urgent demand into delivered power before a competitor can respond.
• Mobile deployment time captures the full logistics cycle from order confirmation to transport, connection, testing, and customer handover.
• Repeat rental and renewal rates show whether customers view the service as reliable enough to use again on future projects or outages.
The relationship between utilization and availability needs careful interpretation. Extremely high utilization can look efficient while leaving too little spare capacity for emergency demand. Very low utilization can protect response capacity but weaken asset returns. The most resilient fleet has enough productive use to support economics while preserving strategic spare capacity in the locations and power bands where urgent demand is most valuable.
Maintenance quality also influences customer retention. A generator that arrives on time but fails during the rental can create more damage than a late delivery because the customer may have planned critical work around the unit. Preventive maintenance, fuel quality, load testing, remote monitoring, spare-parts access, and technician coverage are therefore commercial capabilities, not only workshop functions.
For management, the best operating dashboard links external demand signals to internal fleet readiness. If data-center growth is strong but high-capacity standby units are consistently unavailable, the market statistic points to a fleet gap. If construction demand is strong but mid-range units have long idle periods, the problem may be depot location, pricing, or sales coverage rather than insufficient equipment. That is the level at which market statistics become operationally useful.
Generator Rental Revenue Diagnostic
A polished generator rental benchmark should help a team decide where to look next. Rental revenue can leak through idle fleet, slow dispatch, maintenance downtime, weak regional availability, fuel exposure, emissions restrictions, or missing capacity bands. The diagnostic below connects each problem to a small set of operating signals.
| Problem area | Core signals | Business impact |
|---|---|---|
| Low fleet utilization | Idle units, rental duration | Lower asset returns |
| Slow emergency dispatch | Response time, missed calls | Lost urgent demand |
| Maintenance downtime | Repair time, unavailable units | Lower revenue capacity |
| Fuel exposure | Diesel/gas cost and surcharges | Margin pressure |
| Weak regional availability | Demand vs depot capacity | Missed local demand |
| Emissions gaps | Hybrid/gas fleet availability | Lost regulated projects |
| Large-load shortage | High-kVA utilization | Limited industrial growth |
| Poor renewal rate | Repeat rentals, retention | Weak customer fit |
90-Day Generator Rental Benchmark Plan
Statistics become useful when they are translated into a measurement plan. A practical generator rental review can be organized into a 90-day cycle rather than treated as a vague fleet-expansion project.
| Timing | What to do | Output |
|---|---|---|
| Days 1–30 | Map demand by region, fuel, rating, end use and rental duration | Baseline demand map |
| Days 31–60 | Compare country growth, large-unit demand, fuel mix and mobile use | Fleet expansion priorities |
| Days 61–90 | Review pricing, downtime, emissions, dispatch and renewals | Repeatable growth scorecard |
Planning principle
The strongest generator rental teams do not chase every external benchmark. They compare market statistics against their own utilization, margin, service, and regional data, then prioritize opportunities with high demand, clear ownership, strong economics, and measurable service impact.
Metrics Generator Rental Companies Should Track
The final scorecard should be detailed enough to locate the opportunity without becoming a vanity dashboard. These metrics connect market demand to fleet productivity and service quality.
| Metric | Why it matters |
|---|---|
| Fleet utilization rate | Shows asset productivity |
| Revenue per generator | Measures unit performance |
| Revenue per kVA | Compares capacity classes |
| Average rental duration | Separates emergency and project demand |
| Emergency response time | Measures urgent-service strength |
| Maintenance downtime | Protects fleet availability |
| Fuel-cost exposure | Tracks margin sensitivity |
| Large-capacity utilization | Shows heavy-industry demand |
| Regional revenue mix | Identifies strongest markets |
| Contract renewal rate | Measures customer retention |
| Mobile deployment time | Tests response capability |
| Emissions-compliant fleet share | Supports regulated projects |
Power Generator Rental Market Statistics FAQ
Common questions
What is the size of the power generator rental market?
The uploaded article reports a power generator rental market value of USD 13.26 billion in 2025, an estimated USD 14.05 billion in 2026, and a forecast of USD 18.75 billion by 2031. A separate source uses a smaller market scope, so the series should not be blended.
What is driving generator rental demand?
Demand comes from construction, industrial uptime, outages, utility maintenance, mining, oil and gas activity, data centers, events, telecom reliability, and remote operations. The common requirement is flexible electricity capacity without the need to own permanent generation for every temporary load.
Which fuel type leads generator rental?
Diesel leads with 68.72% revenue share in 2025. It remains widely available, rugged, and familiar for heavy-duty rental applications. Hybrid battery-integrated systems are growing faster, with a 9.35% CAGR through 2031 in the cited forecast.
Which application is largest?
Standby and backup rentals lead with 53.65% of generator rental revenue in 2025. This shows how strongly the market is tied to uptime and continuity. Peak-shaving rentals are smaller but are forecast to grow at an 8.92% CAGR through 2031.
Which end-use industry leads generator rental demand?
Construction leads with 26.74% revenue share in 2025 and represents USD 3.55 billion of generator rental market size. Sites often require temporary electricity before permanent grid service is available, making rental primary power rather than only backup.
Why do data centers matter for generator rental?
Data centers represented a USD 1.58 billion rental base in 2025 and are forecast to grow at a 9.66% CAGR through 2031. Their demand is tied to redundancy, maintenance, testing, edge infrastructure, and strict uptime requirements.
Which region shows strong generator rental growth?
Asia-Pacific captured 32.48% of generator rental revenue in 2025 and is forecast to grow at a 7.55% CAGR through 2031. The region combines infrastructure development, manufacturing, mining, urban growth, and grid-reliability requirements.
What role do mobile generators play?
Mobile generators support fast deployment for outages, events, construction, utilities, remote sites, and emergency backup. The business value comes from logistics as much as equipment: delivery time, connection speed, fuelling, service coverage, and available capacity all affect the customer outcome.
Are hybrid generator rentals growing?
Yes. Hybrid battery-integrated rental generator sets are forecast to grow at a 9.35% CAGR through 2031. The cited article also notes that battery load sharing and intelligent controls can reduce diesel consumption substantially in suitable applications.
What metrics should generator rental companies track?
Useful metrics include fleet utilization, revenue per generator, revenue per kVA, rental duration, emergency response time, maintenance downtime, fuel-cost exposure, high-capacity utilization, regional revenue mix, renewal rate, deployment time, and emissions-compliant fleet share.
Final Takeaway
Power generator rental demand is growing because organizations need reliable electricity without always owning permanent generation equipment. Construction sites, mines, oilfields, utilities, events, hospitals, telecom networks, data centers, and commercial facilities use rental power for different reasons, but the shared requirement is uptime, flexibility, and fast deployment. The market was estimated at USD 13.26 billion in 2025 and is projected to reach USD 18.75 billion by 2031, while diesel retains 68.72% share and standby/backup applications account for 53.65%.
The next layer of growth is more selective. Asia-Pacific is forecast to expand at 7.55% CAGR, peak shaving at 8.92%, hybrid battery-integrated systems at 9.35%, and data-center rentals at 9.66%. Those figures show that the market is not simply adding more conventional diesel units. It is also developing around cleaner configurations, planned load support, digital-infrastructure uptime, and faster-growing regional demand.
The strongest rental companies will treat the market as a reliability service rather than an equipment inventory. Fleet availability, regional coverage, power-rating mix, fuel strategy, maintenance uptime, dispatch speed, emissions compliance, service support, and customer renewal all affect revenue. A mature benchmark therefore connects external market statistics to internal fleet data, then prioritizes the segments where demand, service capability, and asset productivity overlap.


