Agriculture in Oman is not only about farm output. It is part of a national food-security system shaped by desert climate, groundwater pressure, limited arable land, protected farming, dates, vegetables, livestock, fisheries, and food-import exposure. That makes the sector a practical benchmark topic rather than a simple production overview.
The strongest statistics show why Oman needs its own agriculture scorecard. Agriculture, forestry and fishing value added reached 2.6029% of GDP in 2024, equal to about USD 2.78 billion. Overall food self-sufficiency reached 65.8%, agricultural products self-sufficiency stood at 49.4%, animal products reached 87.3%, and fish self-sufficiency reached 144.5%. At the same time, arable land represented only 0.28152% of land area, which explains why water productivity and protected cultivation matter as much as production growth.
Executive Agriculture in Oman Benchmarks
These statistics frame the article. They show Oman’s agriculture and fisheries base, market growth, food-security profile, and water/land limits.
The numbers that define Oman’s agriculture market
• Oman’s GDP was USD 99.6 billion in 2024, while inflation was 1%, giving the agriculture and food-security discussion a stable macroeconomic backdrop.
• Agriculture, forestry and fishing value added reached 2.6029% of GDP in 2024, compared with 2.3% to 2.42% in 2023.
• Agriculture, forestry and fishing value added was reported at USD 2.78 billion in 2024, up from about USD 2.5 billion in 2023.
• The agriculture and fishing sector recorded 6.6% real growth in 2024, showing that the sector is still expanding within Oman’s diversification agenda.
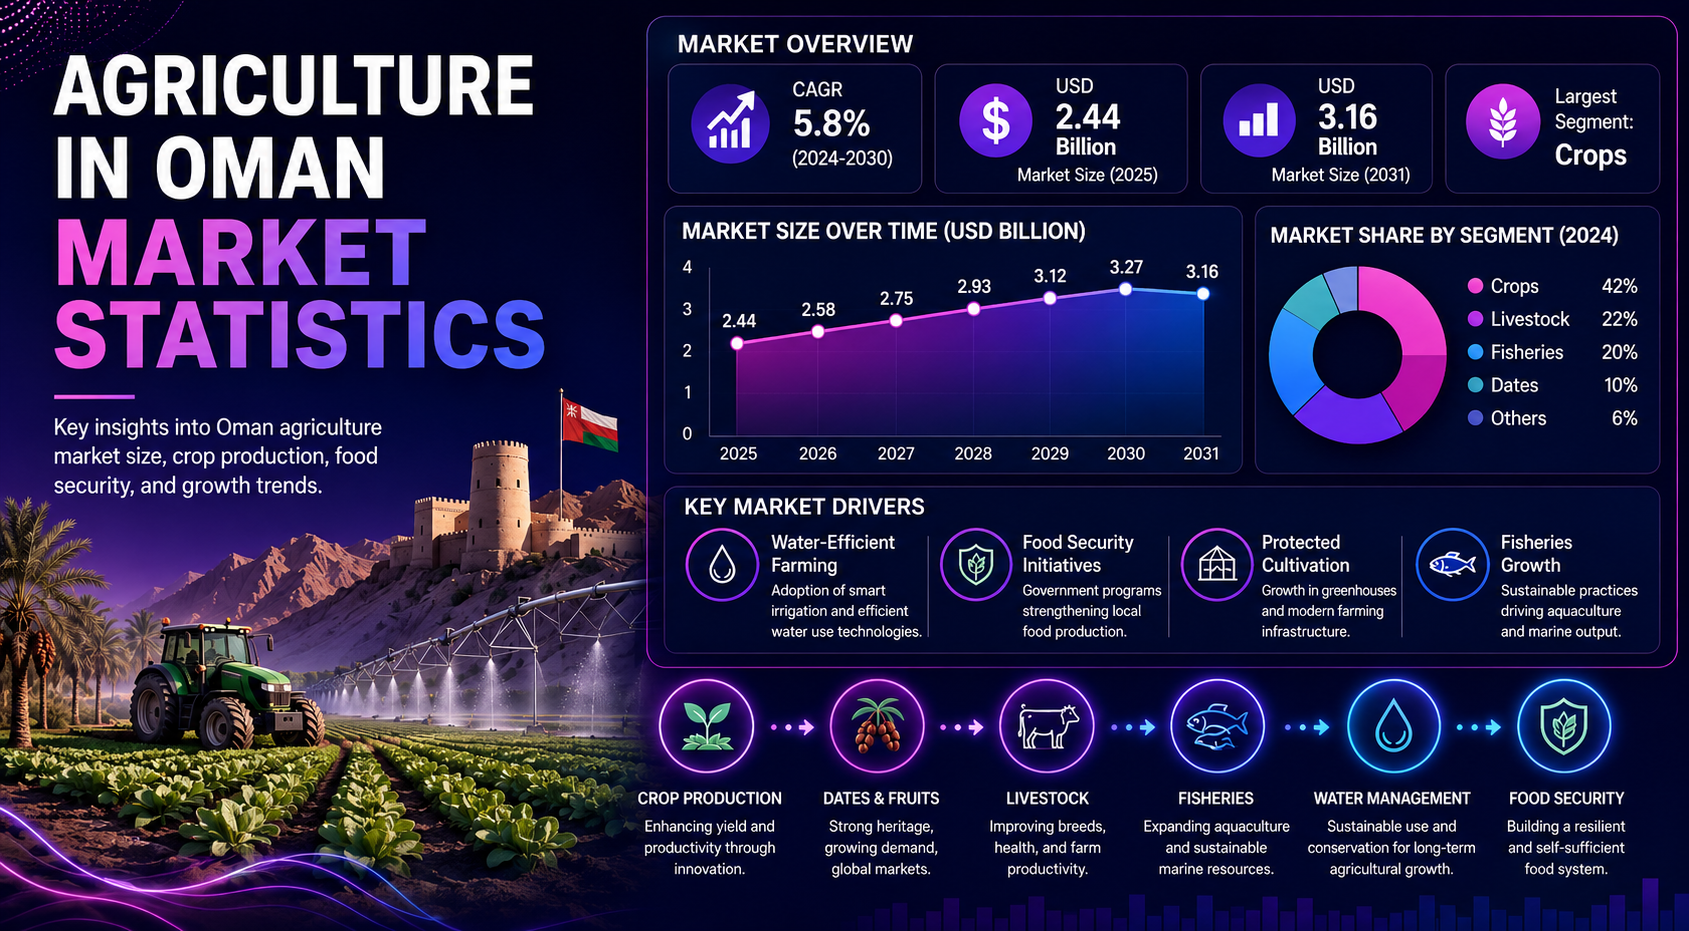
• Oman’s agriculture market is projected at USD 2.44 billion in 2025 and forecast to reach USD 3.16 billion by 2031.
• The forecast implies a 4.14% CAGR between 2026 and 2031, which makes agriculture a moderate-growth resilience market rather than a high-volume export sector.
• Overall food production self-sufficiency reached 65.8% in 2024, while the gap to full self-sufficiency remained 34.2 percentage points.
• Agricultural products self-sufficiency stood at 49.4% in 2024, showing why fresh produce and crop productivity remain central policy priorities.
• Animal products self-sufficiency reached 87.3% in 2024, leaving a smaller 12.7 percentage-point gap to full supply coverage.
• Fish self-sufficiency reached 144.5% in 2024, meaning fish production exceeded domestic self-sufficiency by 44.5 percentage points.
• Dates production reached 400,655 tone in 2024 after 1.45% annual growth, and Oman ranked 8th among 36 countries in the workbook’s historical date-production comparison.
• Vegetable crop production reached 1,235,481 tone in 2024, up from 1,115,107 tone in 2023 and equal to 10.79% annual growth.
• Cucumber self-sufficiency reached 100% in 2023, while tomato self-sufficiency reached 83% and pepper self-sufficiency reached 95%.
• Agricultural land area was recorded at 209,636 acres, while arable land represented only 0.28152% of Oman’s land area in 2023.
• Employment in agriculture was 6.1333% of total employment in 2023 and 5.95% in 2025, far below the global agriculture employment share of 25.78%.
• Oman had 56 fruit and vegetable markets and 50 livestock markets in the governorate baseline used for this article.
• The governorate baseline counted 3.434 million livestock heads, with Al Dakhiliyah holding 686 thousand heads and Al Batinah North holding 579 thousand heads.
• Fresh produce trade still shows dependency: fruit and vegetable imports reached USD 286.2 million from January to May 2024, while exports reached USD 35.2 million.
Agriculture in Oman readout
The headline data shows that Oman’s agriculture market is shaped by five connected systems: water availability, local food production, crop specialization, livestock and fisheries supply, and import resilience. Oman cannot be measured only by farm output because food security depends on how much domestic production can reduce import exposure while using land and water efficiently.
Why Oman Agriculture Carries Food-Security and Market Stakes
Oman agriculture has to be judged differently from large agricultural exporters. The country’s market stakes are tied to resilience: producing the right local foods, reducing import exposure where practical, preserving water resources, and using fisheries and protected farming as strategic advantages.
Market-size and food-security benchmarks
• Oman’s land area is 309,500 sq km, but the country’s arable land share was only 0.28152% of land area in 2023.
• The world average arable land share was 14.3% in 2023, which means the world arable share was about 47.7 times Oman’s share.
• Oman’s population was reported at 4,607,443 people in 2026, including 2,490,797 Omani nationals and 2,116,443 expatriates.
• Population density was recorded at 6.5 people per sq km, but food demand is concentrated through cities, logistics corridors, and coastal markets rather than evenly across land area.
• The Ministry of Agriculture, Fisheries and Water Resources is responsible for food and water security and covers agricultural, fisheries, and water resources.
• Oman’s food-system programmed priorities include reducing import dependency, promoting healthier diets, linking production with market demand, and upgrading food value-chain infrastructure.
• Overall food self-sufficiency was 65.8% in 2024, while food and beverage industries self-sufficiency reached 66.4%.
• Agricultural products self-sufficiency was lower at 49.4%, confirming that crop output is the main domestic supply gap.
• Fish self-sufficiency was 144.5%, making fisheries the strongest food-system surplus category.
• Agriculture market size is expected to rise from USD 2.44 billion in 2025 to USD 3.16 billion in 2031.
• Vision 2040 capital deployment, greenhouse clusters in Batinah and Najd, drip-irrigation mandates, and water productivity were listed as growth drivers.
• Average annual rainfall was documented at 100 mm in the available land and water baseline, showing why rainfall farming cannot be the central growth model.
• The cultivated-area baseline was 73,415 hectares in 2001, and 60% of cultivated area was in coastal areas.
• Oman’s agricultural employment was 5.95% in 2025, compared with a global share of 25.78%.
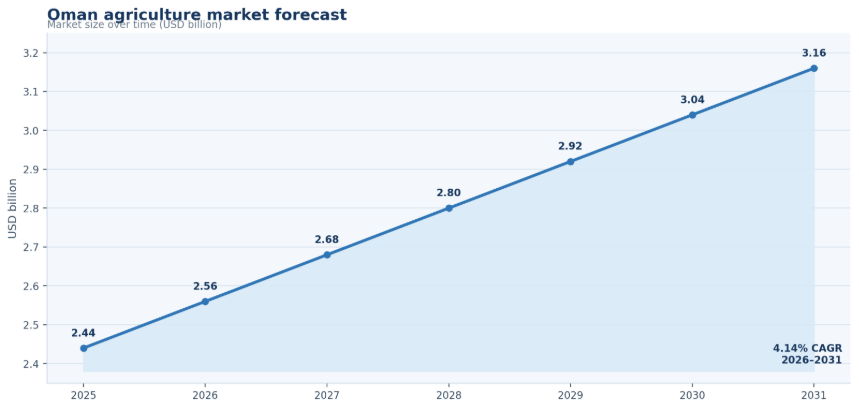
Figure 1. Market growth depends on sustainable food production, not only projected spending.
Market-stakes readout
Oman’s challenge is not simply to produce more. The more useful goal is strategic production: more local vegetables, better water productivity, stronger livestock and fisheries supply, better storage, and lower vulnerability to external food-market shocks.
Oman Agriculture Production: Where the Market Stands
Production statistics show the practical size of Oman’s food system. They also show why the article separates dates, vegetables, livestock, and fisheries rather than treating agriculture as one blended figure.
Production-volume benchmarks
• Dates production reached 400,655 tone in 2024, up 1.45% year over year.
• Oman’s dates production was far above its historical low of 40,000 tone in 1961.
• Vegetable crop production reached 1,235,481 tone in 2024, compared with 1,115,107 tone in 2023.
• Vegetable production increased by 10.79% in 2024, continuing a 3-year growth streak from 2022 to 2024.
• Vegetable output was 61.77 times higher than the 1961 historical low of 20,000 tones.
• Tomato production reached 225,488 tone in 2023, with North Al Batinah accounting for 159,277 tones.
• Pepper production reached 166,943 tone in 2023, with North Al Batinah accounting for 163,647 tones.
• Cucumber production reached 103,200 tone in 2023, supported by 473 acres of harvested area.
• North Al Batinah produced 40,119 tone of cucumbers, equal to 38.9% of national cucumber production.
• North Al Batinah accounted for 98% of pepper production and 70.6% of tomato production in the 2023 crop benchmark.
• The governorate baseline recorded 1,854.4 thousand tone of fruit and vegetable production when major governorates were aggregated.
• Al Batinah North produced 690.1 thousand tone of fruit and vegetables in the governorate baseline, equal to 37% of the total.
• Al Batinah South produced 359.6 thousand tone and represented 19% of the fruit and vegetable baseline.
• Al Dakhiliyah produced 212.2 thousand tone and represented 11% of the baseline.
• Oman’s fruit exports reached 678,033 tone in 2024, up from 577,666 tone in 2023.
• Fruit exports increased by 17.37% in 2024, showing that selected crop categories have trade momentum.
Oman Agriculture Production Snapshot
| Metric | Latest benchmark | Why it matters |
|---|---|---|
| Agriculture value added | USD 2.78 billion in 2024 | Economic contribution and diversification relevance |
| Agriculture GDP share | 2.6029% in 2024 | Sector’s weight in the national economy |
| Dates production | 400,655 tones in 2024 | Flagship crop scale |
| Vegetable production | 1,235,481 tones in 2024 | Fresh-food production capacity |
| Fruit exports | 678,033 tones in 2024 | External market activity |
| Fish self-sufficiency | 144.5% in 2024 | Food-security surplus potential |
Production readout
Oman’s production statistics should be separated by food-system role. Dates represent heritage and export potential, vegetables support domestic fresh-food supply, livestock supports protein availability, and fisheries strengthen food security beyond land-based agriculture.
Crop Market Statistics in Oman
Crop data in Oman is most useful when separated into flagship crops, fresh produce, forage, and water-sensitive categories. Dates show long-term crop identity. Vegetables show domestic food-security potential. Greenhouse crops show how the sector can grow without relying only on land expansion.
Crop-production benchmarks
• Dates are listed as an Oman fruit crop and remain the crop most closely tied to heritage, rural income, and value-added processing.
• Tomatoes, cucumbers, potatoes, watermelon, okra, pepper, eggplant, onions, cabbage, cauliflower, cantaloupe, radish, garlic, carrots, and squash are listed as Oman vegetable crops in the commodity segmentation sheet.
• Coconut, lemon, mango, banana, and papaya are listed as fruit crop categories relevant to Oman’s crop mix.
• Cereals, alfalfa, Rhodes grass, barley, sorghum, and wheat are listed as field or forage crop segments.
• Vegetable production reached 1.235 million tone in 2024, making it the largest crop benchmark in the workbook.
• Dates production reached 400,655 tone in 2024, making it the second major benchmark crop after vegetables in the article-ready set.
• Tomato self-sufficiency reached 83% in 2023 despite 54,975 tone of tomato imports and 8,850 tone of exports.
• Pepper self-sufficiency reached 95% in 2023, with 15,034 tone of imports and 6,650 tone of exports.
• Cucumber self-sufficiency reached 100% in 2023, with 550 tone of imports and 495 tone of exports.
• Cucumber re-exports were 8 tone in 2023, while pepper re-exports were 253 tones.
• North Al Batinah’s 98% share of pepper output shows how specialized production can concentrate geographically.
• North Al Batinah’s 70.6% share of tomato output shows why governorate-level crop data matters for market planning.
• Oman’s crop list also includes mint, coriander, parsley, basil, dill, fenugreek, celery, and black-eyed peas, showing diversity beyond headline crops.
• The workbook identifies grape, pomegranate, guava, fig, and apple as additional fruit categories that can support niche horticulture analysis.
• Vegetable output has grown from 20,000 tone in 1961 to 1,235,481 tone in 2024, showing how domestic fresh produce has expanded over the long term.
• The article should treat crop growth as a water-efficiency question because high production is only useful if it does not worsen groundwater pressure.
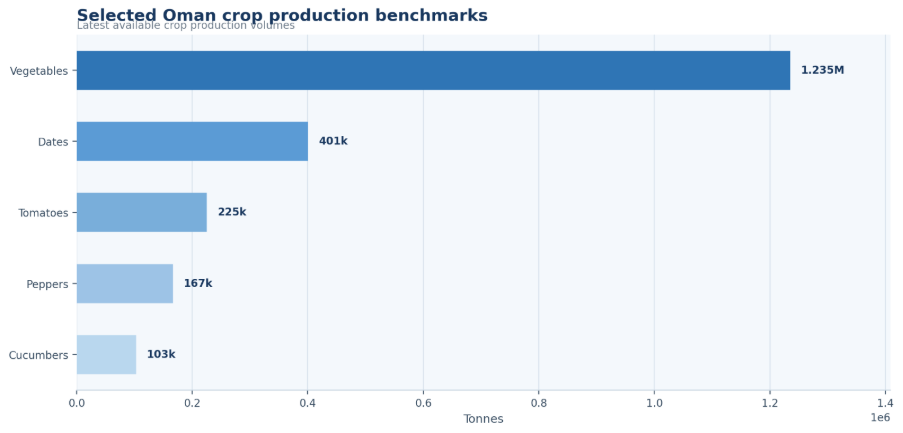
Figure 2. Crop production is led by vegetables, dates, tomatoes, peppers, and cucumbers.
Crop interpretation
Crop data in Oman should not be read only as production volume. A high-volume crop may use significant water, while a protected-cultivation crop may provide higher value from less land. The strongest agriculture strategy is about which crops support food security without increasing water stress.
Dates Market Statistics in Oman
Dates deserve their own section because they are more than a crop. They connect heritage, rural livelihoods, domestic food supply, processing, packaging, and export potential. For Oman, the question is not only how many dates are harvested but how much value can be captured after harvest.
Date production benchmarks
• Dates production reached 400,655 tone in 2024.
• Date output increased by 1.45% in 2024.
• Oman ranked 8th among 36 countries in the historical date-production ranking captured in the workbook.
• Dates production has increased sharply compared with the 1961 historical low of 40,000 tones.
• Dates are identified as a key fruit crop in Oman’s crop list and commodity segmentation sheets.
• Date value chains can be improved through grading, packaging, cold storage, processing, branding, and export positioning.
• Date processing is listed as a technology and value-addition pathway in the agriculture technology map.
• Date exports appear in the trade diagnostic as a value-added crop opportunity rather than only a raw production measure.
• Governorates with oasis and traditional agriculture should be read differently from coastal fresh-produce zones because their crop identity often depends on date palms and mixed farms.
• The market issue for dates is productivity and value capture, not only planted area or harvest volume.
Oman Dates Market Diagnostic
| Signal | What it shows | Why it matters |
|---|---|---|
| Date production | 400,655 tonnes in 2024 | Flagship crop scale |
| Annual growth | 1.45% in 2024 | Production movement |
| Historical position | 8th among 36 countries | Regional and global relevance |
| 1961 benchmark | 40,000 tonnes | Long-term expansion |
| Processing pathway | Packaging and value-added products | Income potential beyond raw output |
Dates readout
Dates are a heritage crop, rural-income source, food-security product, and export opportunity. The key market question is whether Oman can improve quality, processing, packaging, storage, and export positioning while protecting water resources.
Vegetables, Protected Farming, and Fresh Produce Statistics
Fresh produce is one of Oman’s most important growth areas because it directly affects import exposure and household food availability. The best reading separates open-field vegetables from controlled and protected farming, because water efficiency and year-round supply are central to the market case.
Vegetable and protected-cultivation benchmarks
• Vegetable production reached 1,235,481 tone in 2024.
• Vegetable production grew by 10.79% from 2023 to 2024.
• Tomato output reached 225,488 tone in 2023, while tomato imports reached 54,975 tones.
• Cucumber output reached 103,200 tone in 2023, while cucumber self-sufficiency reached 100%.
• Pepper output reached 166,943 tone in 2023, while pepper self-sufficiency reached 95%.
• Cucumber harvested area was 473 acres in 2023, showing how concentrated production can generate high output.
• North Al Batinah produced 159,277 tone of tomatoes, 163,647 tone of peppers, and 40,119 tone of cucumbers in 2023.
• Fruit and vegetable imports reached USD 286.2 million in January-May 2024, compared with USD 256.3 million in January-May 2023.
• Fruit and vegetable imports grew by 11.6% year over year in the January-May comparison.
• Fruit and vegetable exports reached USD 35.2 million in January-May 2024, leaving a fresh-produce import-export gap of about USD 251 million.
• Imports were 8.1 times exports in the January-May 2024 fresh-produce comparison.
• Greenhouse clusters in Batinah and Najd are identified as market drivers in the forecast section.
• Drip-irrigation mandates and water productivity are listed as key market drivers for 2025–2031.
• Hydroponics and controlled environment agriculture are identified as response pathways for low water productivity.
Oman Fresh Produce Market Comparison
| Crop / segment | Key metric | Market role |
|---|---|---|
| Tomatoes | 225,488 tones in 2023; 83% self-sufficiency | Core fresh vegetable with import-reduction opportunity |
| Cucumbers | 103,200 tones in 2023; 100% self-sufficiency | Proof point for domestic supply potential |
| Peppers | 166,943 tones in 2023; 95% self-sufficiency | High-output vegetable concentrated in North Al Batinah |
| Fresh produce imports | USD 286.2 million in Jan-May 2024 | Shows external supply exposure |
| Greenhouses / hydroponics | Identified modernization pathway | Supports water-efficient production |
Fresh produce readout
Fresh produce can reduce import dependence and improve local food availability. Protected farming matters because it allows better control over water, temperature, yield, and seasonal supply, which makes it especially relevant in Oman’s climate.
Livestock, Dairy, Poultry, and Animal Product Statistics
Livestock statistics show Oman’s protein base and rural livelihood structure. The sector should be read through animal numbers, market access, feed needs, veterinary systems, meat and milk output, and the gap between domestic supply and import reliance.
Livestock and animal-product benchmarks
• Animal products self-sufficiency reached 87.3% in 2024.
• The gap to full self-sufficiency for animal products was 12.7 percentage points in 2024.
• The governorate baseline counted 3.434 million livestock heads across the national table.
• Al Dakhiliyah had 686 thousand livestock heads, equal to 20% of the baseline total.
• Al Batinah North had 579 thousand livestock heads, equal to 17% of the baseline total.
• A ‘Sharqiyah North had 428 thousand livestock heads and represented 13% of the baseline total.
• Al Buraimi had 365 thousand livestock heads, equal to 11% of the baseline total.
• A ‘Sharqiyah South had 323 thousand livestock heads, equal to 10% of the baseline total.
• Musandam had 250 thousand livestock heads, while Al Batinah South had 246 thousand heads.
• Muscat had 108 thousand livestock heads, showing that demand centers do not necessarily align with livestock production centers.
• The governorate baseline recorded 50 livestock markets across Oman.
• A ‘Sharqiyah South had 9 livestock markets, while Al Batinah North and Al Batinah South each had 7 markets.
• Livestock market planning should include goats, sheep, cattle, camels, poultry, dairy, meat, and eggs because each category has different feed and water requirements.
• Efficient feed systems, veterinary services, cold chain, and market information are needed to convert livestock numbers into resilient animal-product supply.
Oman Livestock Market Comparison
| Segment | Key metric | Market role |
|---|---|---|
| Goats and sheep | Traditional livestock base | Supports rural livelihoods and meat supply |
| Cattle and dairy | Part of animal-product self-sufficiency | Supports milk and dairy supply |
| Camels | Heritage livestock category | Links culture, meat, and milk |
| Poultry and eggs | Fast protein category | Supports affordable domestic protein |
| Livestock markets | 50 markets in baseline | Shows market-channel infrastructure |
Livestock readout
Livestock statistics should be read with feed, water, veterinary services, cold chain, and import reliance. Oman’s livestock market can support food security, but it also needs efficient feed systems, disease-control capacity, and reliable supply chains.
Fisheries and Aquaculture in Oman’s Food System
Fisheries deserve a separate market lens because Oman has a coastal food-security asset that many arid agriculture markets do not have. Fish output, processing, exports, cold chain, and aquaculture can strengthen the food system even when land farming is constrained.
Fisheries and aquaculture benchmarks
• Fish self-sufficiency reached 144.5% in 2024.
• Fish self-sufficiency exceeded full coverage by 44.5 percentage points in 2024.
• Artisanal fishery landings increased from 81,525 MT in 1985 to 869,968 MT in 2021.
• Artisanal fishery landings increased by 744% between 1985 and 2021.
• Artisanal fishery landings declined by 20.9% from 2021 to 688,024 MT in 2022.
• Batinah fishery output increased from 19,331 MT in 1985 to 76,312 MT in 2022.
• Muscat fishery output reached 37,305 MT in 2022.
• Musandam fishery output reached 37,177 MT in 2022.
• The 2023 Fish Statistics Book covers production and foreign trade, showing the sector’s importance for both domestic supply and exports.
• Aquaculture is listed as a technology area because farmed fish output can add resilience to capture fisheries.
• Fish exports and processing should be tracked alongside land agriculture because seafood is part of Oman’s national food system.
• Cold chain and processing capacity determine how much seafood value is retained after landing.
Fisheries and Aquaculture Market Role
| Area | What to measure | Why it matters |
|---|---|---|
| Capture fisheries | Fish landing volume | Seafood supply scale |
| Aquaculture | Farmed fish output | Future protein growth potential |
| Fish exports | Export value and volume | Trade opportunity |
| Processing | Value-added capacity | Income and job creation potential |
| Cold chain | Storage and logistics | Supply reliability and loss control |
Fisheries readout
Fisheries matter because Oman’s food system is not limited to land agriculture. Seafood gives Oman a natural advantage that can support domestic food supply, exports, processing jobs, and coastal economic development.
Agricultural Land, Water, and Irrigation Constraints
Land and water are the real boundary conditions for Oman agriculture. The country can grow its food system, but the most useful benchmark is not simply cultivated area. It is output per unit of land and water, plus the ability to manage groundwater, salinity, heat, and low rainfall.
Land and water benchmarks
• Oman’s agricultural land area was recorded at 209,636 acres.
• Cultivated area was 73,415 hectares in the available 2001 baseline.
• About 60% of cultivated area was in coastal areas in the 2001 baseline.
• Average annual rainfall was recorded at 100 mm in the land and water baseline.
• Arable land represented 0.28152% of Oman’s land area in 2023.
• Oman’s rounded arable land share was 0.3% of land area in 2023.
• Oman’s arable land share has averaged 0.1% since 1961.
• Oman’s recorded arable land minimum was 0.1% in 1961, while the maximum was 0.3% in 2020.
• The world average arable land share was 14.3% in 2023, creating a 14 percentage-point gap compared with Oman.
• The world arable land share was 47.7 times Oman’s arable land share in 2023.
• Employment in agriculture was 6.05% in 2024 and 5.95% in 2025.
• The world agriculture employment share was 25.78% in 2025, about 4.3 times Oman’s share.
• Identified risks include declining groundwater resources, scanty rainfall, salinity affecting soil and water, and low productivity of water use.
• Drip irrigation, hydroponics, controlled environment agriculture, and crop variety selection are listed as response pathways to water scarcity and salinity.
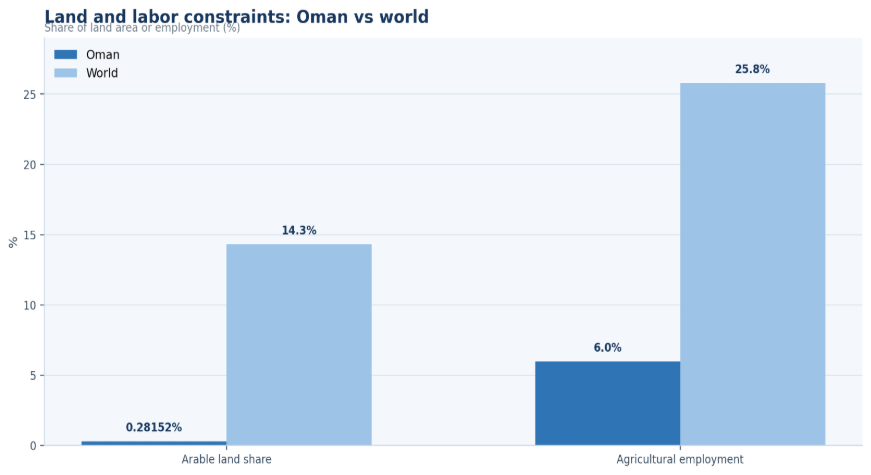
Figure 3. Land and labor constraints make productivity and water efficiency the key benchmark.
Oman Land and Water Diagnostic
| Signal | What it measures | Why it matters |
|---|---|---|
| Agricultural land | 209,636 acres | Farming and grazing base |
| Arable land share | 0.28152% of land area | Crop expansion limits |
| World arable benchmark | 14.3% of land area | The scale of Oman’s land constraint |
| Average rainfall | 100 mm baseline | Climate constraint |
| Coastal cultivated area | 60% of cultivated area | Geography of production |
| Water productivity | Listed market driver | Why irrigation efficiency matters |
Land and water readout
In Oman, land and water are the market boundary. Agriculture growth depends less on expanding farmland and more on raising output per unit of land and water. That makes irrigation efficiency, protected cultivation, crop selection, and water governance central to the market.
Governorate-Level Agriculture Intelligence
Oman’s agriculture market should not be analyzed only at the national level. Governorate-level data shows where fruit and vegetable output, livestock populations, and market infrastructure are concentrated, which is critical for storage, cold chain, logistics, investment, and extension services.
Regional production benchmarks inside Oman
• Al Batinah North had 9 fruit and vegetable markets and 690.1 thousand tone of fruit and vegetable production.
• Al Batinah North represented 37% of the fruit and vegetable production baseline and 16% of fruit and vegetable markets.
• Al Batinah South had 8 fruit and vegetable markets and 359.6 thousand tone of production, equal to 19% of the baseline.
• Al Dakhiliyah produced 212.2 thousand tone of fruit and vegetables and held 686 thousand livestock heads.
• Al Dakhiliyah represented 20% of the livestock population baseline, the largest livestock share in the table.
• A ‘Sharqiyah South had 9 fruit and vegetable markets, 9 livestock markets, and 323 thousand livestock heads.
• A ‘Sharqiyah North produced 83.1 thousand tone of fruit and vegetables and had 428 thousand livestock heads.
• Al Buraimi produced 128.9 thousand tone of fruit and vegetables and had 365 thousand livestock heads.
• Musandam produced 101.3 thousand tone of fruit and vegetables and had 250 thousand livestock heads.
• Al Wusta produced 67.4 thousand tone of fruit and vegetables and had 140 thousand livestock heads.
• Muscat had 5 fruit and vegetable markets, 4 livestock markets, 40.2 thousand tone of fruit and vegetable output, and 108 thousand livestock heads.
• Dhofar had 5 fruit and vegetable markets, 3 livestock markets, 12.7 thousand tone of fruit and vegetable production, and 148 thousand livestock heads.
• Adhara had 2.1 thousand tone of fruit and vegetable output and 151 thousand livestock heads.
• Oman’s governorate baseline counted 56 fruit and vegetable markets and 50 livestock markets.
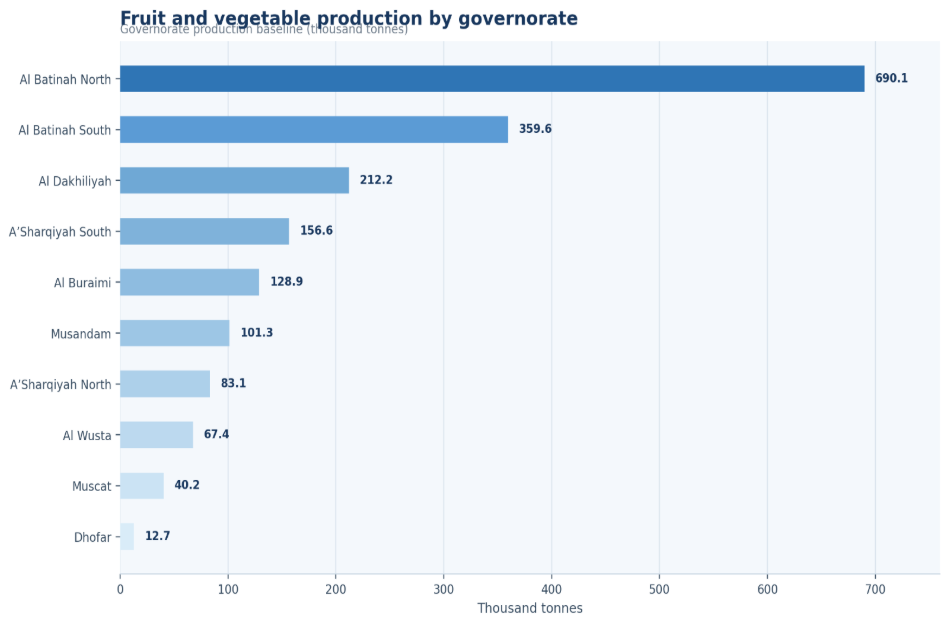
Figure 4. Governorate production shows Oman’s agriculture base is concentrated in a few high-output regions.
Oman Governorate Agriculture Snapshot
| Governorate | Agriculture pattern | Article interpretation |
|---|---|---|
| Al Batinah North/South | High crop and market concentration | Core fresh-produce belt |
| Al Dakhil Iyah | High livestock and traditional agriculture | Livestock and heritage crop base |
| Dhofar | Distinct seasonal climate and livestock role | Separate agro-climatic zone |
| A’Sharqiyah North/South | Mixed farming, livestock and markets | Regional supply and market role |
| Muscat | Demand and market access center | Important for distribution more than production |
| Al Wust / Musandam | Lower crop density but food-system relevance | Livestock, fisheries and coastal role |
Governorate readout
Oman’s agriculture market is not evenly distributed. Regional differences matter because water, soil, temperature, farm structure, and proximity to markets affect which crops can be grown profitably and sustainably.
Food Imports, Exports, and Self-Sufficiency Statistics
Trade data shows the difference between production strength and food-system exposure. Oman does not need to produce every food domestically, but the right local production categories can reduce vulnerability to price shocks, logistics disruption, and seasonal import gaps.
Trade and self-sufficiency benchmarks
• Overall food production self-sufficiency reached 65.8% in 2024.
• Agricultural products self-sufficiency stood at 49.4% in 2024, leaving a 50.6 percentage-point gap to full self-sufficiency.
• Animal products self-sufficiency stood at 87.3% in 2024, leaving a 12.7 percentage-point gap.
• Fish self-sufficiency reached 144.5% in 2024, creating a 44.5 percentage-point surplus over 100%.
• Food and beverage industries self-sufficiency reached 66.4% in 2024.
• Fruit exports reached 678,033 tone in 2024, up from 577,666 tone in 2023.
• Fruit export growth reached 17.37% in 2024.
• Fruit and vegetable imports reached USD 286.2 million from January to May 2024.
• Fruit and vegetable imports were USD 256.3 million from January to May 2023.
• Fruit and vegetable import growth was 11.6% in the January-May 2024 comparison.
• Fruit and vegetable exports reached USD 35.2 million from January to May 2024.
• The fresh-produce import-export gap reached about USD 251 million from January to May 2024.
• Fresh-produce imports were 8.1 times exports during January-May 2024.
• Tomato imports reached 54,975 tone in 2023, while cucumber imports were 550 tone and pepper imports were 15,034 tones.
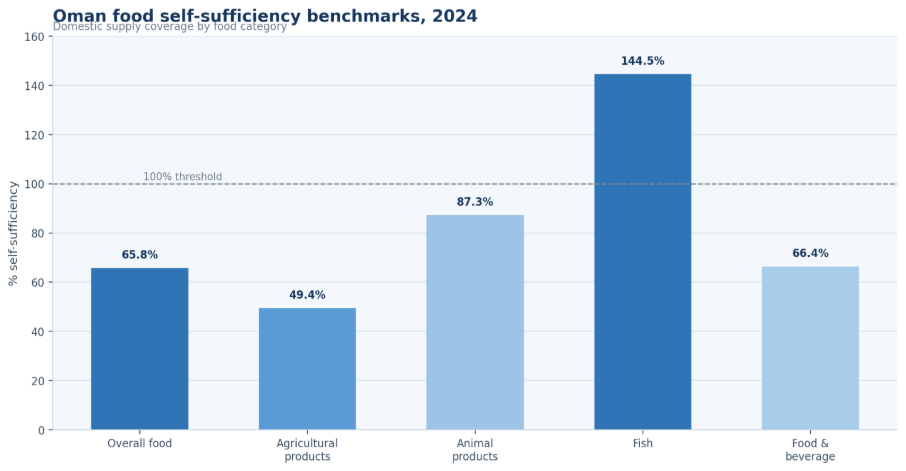
Figure 5. Fisheries are a strength, while crop categories remain the main import-reduction opportunity.
Oman Food Trade Diagnostic
| Trade signal | What to compare | Why it matters |
|---|---|---|
| Food imports | Imported value and volume by category | Exposure to external markets |
| Local crop output | Domestic supply by crop | Self-sufficiency potential |
| Fish self-sufficiency | 144.5% in 2024 | Seafood surplus strength |
| Fresh produce gap | USD 251 million in Jan-May 2024 | Import-reduction opportunity |
| Fruit exports | 678,033 tonnes in 2024 | Export momentum |
| Cereal and staple imports | Import dependence by category | Staple-food vulnerability |
Trade readout
Food trade statistics show Oman’s agriculture opportunity and vulnerability at the same time. Imports are necessary for many categories, but domestic production can reduce risk in selected foods such as vegetables, dates, dairy, poultry, and fish.
Regional and GCC Agriculture Comparison
Oman should be compared with other GCC and arid-region markets because the shared constraints are climate, land, water, import reliance, and the need for controlled-environment agriculture. The comparison also shows where Oman has differentiated strengths, especially fisheries and dates.
GCC and regional benchmarks
• Oman’s agriculture, forestry and fishing value added share was 2.6029% of GDP in 2024.
• The United Arab Emirates had an agriculture, forestry and fishing value added share of 0.77% in 2024 and 0.70121% in 2023.
• Qatar’s agriculture, forestry and fishing value added share was 0.28886% in 2024.
• Kuwait’s agriculture, forestry and fishing value added share was 0.49298% in 2024.
• The world agriculture, forestry and fishing value added share was 4% of GDP in 2023.
• United Arab Emirates agriculture employment was 1% of the workforce in 2023.
• Oman agriculture employment was 5.95% in 2025, compared with 25.78% globally.
• Saudi Arabia is relevant as a regional benchmark for food-security diversification and controlled-environment farming in arid conditions.
• The UAE is relevant for Agri-tech, vertical farming, food logistics, and import-management models.
• Qatar is relevant for greenhouse production and self-sufficiency planning.
• Kuwait and Bahrain highlight constraints faced by import-heavy, land-limited food systems.
• Yemen shows a contrasting regional agriculture model that is more livelihood-intensive and climate-vulnerable than the Gulf monarchies.
GCC Agriculture Market Comparison
| Country | Agriculture pattern | Why it matters for Oman |
|---|---|---|
| Oman | Dates, fisheries, vegetables, livestock | Balanced food-security and coastal-food system |
| Saudi Arabia | Food-security diversification and controlled farming | Regional benchmark for scale and investment |
| United Arab Emirates | Agri-tech, vertical farming and logistics | Benchmark for technology and import management |
| Qatar | Greenhouse production and self-sufficiency planning | Shows strategic resilience planning |
| Kuwait | Import-heavy food system | Highlights food-import exposure |
| Bahrain | Limited land and import dependence | Shows constraints similar to smaller GCC markets |
Regional readout
Oman should be compared with the GCC, not only global agriculture markets. The shared regional challenges are arid climate, limited arable land, water scarcity, import dependence, and the need for controlled-environment agriculture. Oman’s advantage is its mix of agriculture, fisheries, coastal resources, and date production.
Agriculture Technology, Protected Cultivation, and Modern Farming
Technology is important in Oman because the market cannot rely on large arable-land expansion. The best modernization indicators are protected cultivation, drip irrigation, cold chain, aquaculture, date processing, seed systems, and value-chain upgrading.
Technology and modernization benchmarks
• Vision 2040 capital deployment is identified as a growth driver for Oman agriculture.
• Greenhouse clusters in Batinah and Najd are identified as growth drivers.
• Drip-irrigation mandates are identified as a growth driver in the market forecast sheet.
• Water productivity is listed as a growth driver through yields per cubic meter of water.
• Protected farming and greenhouse systems are listed as a response pathway to high temperature.
• Hydroponics and controlled environment agriculture are listed as response pathways for low water productivity.
• Drip irrigation and water-use efficiency are listed as response pathways for water scarcity.
• Storage and distribution infrastructure are listed as the response pathway to post-harvest losses.
• Price monitoring and market information systems are listed as the response pathway to price volatility.
• Mechanization and improved seed systems are listed as response pathways to low land productivity.
• Crop variety selection and soil-water management are listed as response pathways to salinity.
• Training, extension, and value-chain upgrading are listed as response pathways for smallholder capacity.
• Date processing technology can raise value capture from Oman’s 400,655-tonne date output.
• Aquaculture systems can strengthen seafood supply beyond capture fisheries.
Oman Agriculture Technology Map
| Technology area | What it improves | Market impact |
|---|---|---|
| Greenhouses | Climate control | Better yields and seasonal supply |
| Hydroponics | Water efficiency | Less land and groundwater pressure |
| Drip irrigation | Water productivity | Lower water waste |
| Cold chain | Storage and logistics | Lower post-harvest losses |
| Date processing | Value addition | Better export and farmer margins |
| Aquaculture | Fish supply | Protein and export growth |
Technology readout
Modern agriculture in Oman should focus less on simply increasing acreage and more on productivity. Greenhouses, drip irrigation, hydroponics, cold chain, improved seeds, and aquaculture can raise output while reducing pressure on land and groundwater.
Food Security, Price Pressure, and Agricultural Resilience
Food security in Oman is a portfolio problem. Local production, reliable imports, fisheries, storage, food-processing capacity, and price monitoring all matter. The strongest data reading separates domestic output from actual household affordability and supply-chain resilience.
Food-security benchmarks
• Oman’s food-system programmer focus includes sustainable food systems.
• The policy goal includes reducing import dependency.
• The policy goal also includes promoting healthier diets.
• Value-chain actions include linking food production with market demand.
• Value-chain actions include capacity building for smallholder farmers.
• Value-chain actions include upgrading national food value-chain infrastructure.
• Overall food self-sufficiency reached 65.8% in 2024.
• Agricultural products self-sufficiency was 49.4% in 2024, making crop production the central supply gap.
• Animal products self-sufficiency reached 87.3% in 2024.
• Fish self-sufficiency reached 144.5% in 2024, making fisheries the strongest resilience category.
• Food and beverage industries self-sufficiency reached 66.4% in 2024.
• Food import dependence remains visible in the January-May 2024 fruit and vegetable import total of USD 286.2 million.
• Post-harvest losses, price volatility, import dependency, and climate shock exposure are listed as market risks.
• Strategic reserves, cold chain, local production projects, and market information systems should be tracked alongside production.
Oman Food-Security Diagnostic
| Food-security signal | What it shows | Why it matters |
|---|---|---|
| Self-sufficiency rate | Domestic supply strength | Reduced import risk |
| Import dependence | External exposure | Trade vulnerability |
| Domestic vegetable output | Fresh food availability | Local supply progress |
| Fisheries production | Protein supply | Natural food-security asset |
| Storage and reserves | Shock buffer | Resilience |
| Price pressure | Consumer affordability risk | Household exposure |
Food-security readout
Food security in Oman is not about producing every food domestically. It is about producing the right foods locally, maintaining reliable imports, improving storage, developing fisheries, using water efficiently, and building resilience against global food-market disruption.
Agriculture Market Challenges and Production Risks
Oman agriculture risks are connected. Water scarcity affects crop choice. Heat stress affects yield. Import dependence affects food-price exposure. Cold-chain gaps waste output after production. The diagnostic value comes from separating these risks and assigning each one to a measurable signal.
Agriculture risks worth separating
• High temperature is listed as an identified agriculture risk.
• Desertification of soil is listed as an identified agriculture risk.
• Declining groundwater resources are listed as an identified agriculture risk.
• Scanty rainfall is listed as an identified agriculture risk.
• Salinity affecting soil and water is listed as an identified agriculture risk.
• Low productivity of land use is listed as an identified agriculture risk.
• Low productivity of water use is listed as an identified agriculture risk.
• High post-harvest losses are listed as an identified agriculture risk.
• Price volatility is listed as an identified agriculture risk.
• Water scarcity is listed as an identified agriculture risk.
• Import dependency is listed as an identified agriculture risk.
• Climate shock exposure is listed as an identified agriculture risk.
• Groundwater decline should be monitored through water-resource management and irrigation efficiency.
• Market mismatch should be addressed by linking food production with market demand.
• Smallholder capacity should be improved through training, extension, and value-chain upgrading.
Oman Agriculture Risk Diagnostic
| Risk area | Core metric | Likely owner |
|---|---|---|
| Water scarcity | Irrigation demand and groundwater use | Water authorities and farmers |
| Limited arable land | Arable land share | Policymakers and farm planners |
| Heat stress | Temperature and yield pressure | Farmers and researchers |
| Import dependence | Food import share | Trade and food-security agencies |
| Input costs | Fertilizer, feed and energy prices | Farmers and suppliers |
| Cold-chain limits | Post-harvest loss | Logistics and agribusinesses |
Risk interpretation
Oman’s agriculture risks are connected. Water scarcity can limit crop choice, heat stress can reduce yield, import dependence can raise food-price exposure, and cold-chain gaps can waste local production. The strongest strategy is to manage these risks together rather than treating them as separate problems.
Agriculture in Oman Market Diagnostic Framework
A useful Oman agriculture scorecard should convert statistics into a practical diagnosis. The question is not only whether a number is high or low, but whether it helps explain production, import reliance, regional concentration, water pressure, or food-system resilience.
| Problem area | Core signals to measure | Useful benchmark type |
|---|---|---|
| Market scale | Agriculture value, crop output, livestock, fisheries | National market-size data |
| Food security | Self-sufficiency, imports, reserves | Food resilience data |
| Crop productivity | Yield, crop area, protected farming | Crop-level data |
| Water efficiency | Irrigation, groundwater, protected systems | Water-use data |
| Livestock strength | Meat, milk, poultry, eggs | Animal-product data |
| Fisheries strength | Fish production, exports, aquaculture | Seafood data |
| Regional concentration | Governorate production | Oman internal geography |
| Trade exposure | Imports and exports by category | Food trade data |
Diagnostic interpretation
This framework keeps the article from becoming a stat dump. Each statistic should answer one of four questions: what does Oman produce, where does it produce it, which foods still depend on imports, and which constraints could limit future supply?
90-Day Oman Agriculture Benchmark Plan
Statistics become useful when they are translated into a measurement cycle. A practical Oman agriculture review can be organized into 90 days so that production, water, trade, and food-security indicators are reviewed together.
| Timing | What to do | Output |
|---|---|---|
| Days 1-30 | Build baseline by crops, livestock, fisheries, imports, land, water, and governorate | Oman agriculture market-size map |
| Days 31-60 | Compare food-security gaps, water productivity, crop yields, and import exposure | Opportunity and risk scorecard |
| Days 61-90 | Review protected farming, cold chain, storage, aquaculture, and local production investments | Agriculture resilience and growth plan |
Planning principle
The best Oman agriculture market review should not chase every available statistic. It should compare domestic production, import reliance, water efficiency, regional concentration, and food-security goals to identify where local agriculture can grow sustainably.
Metrics Oman Agriculture Leaders Should Track
The final scorecard should be detailed enough to locate the constraint without becoming a vanity dashboard. These metrics help policymakers, farmers, investors, and agribusiness teams separate production scale from resilience, water efficiency, trade exposure, and market access.
Oman Agriculture Market Metrics Scorecard
| Metric | Why it matters |
|---|---|
| Agriculture value added | Economic contribution |
| Agriculture share of GDP | Sector weight |
| Crop production | Local food-output scale |
| Dates production | Flagship crop strength |
| Vegetable production | Fresh-food self-sufficiency potential |
| Livestock population | Animal-product base |
| Milk and poultry production | Protein-supply capacity |
| Fisheries output | Seafood supply strength |
| Agricultural land | Production base |
| Arable land | Expansion limits |
| Irrigated land | Water-supported production |
| Food imports | Import exposure |
| Food self-sufficiency | Shows resilience |
| Protected cultivation | Modernization progress |
| Water productivity | Shows sustainability |
Agriculture in Oman Market Statistics FAQ
Common questions
• What is the size of Oman’s agriculture market?
Oman’s agriculture market is projected at USD 2.44 billion in 2025 and forecast to reach USD 3.16 billion by 2031. Agriculture, forestry and fishing value added was about USD 2.78 billion in 2024.
• What are the main crops grown in Oman?
The main crop categories covered in this article include dates, tomatoes, cucumbers, peppers, onions, watermelons, potatoes, citrus, bananas, mangoes, forage crops, and cereals.
• Why are dates important in Oman agriculture?
Dates reached 400,655 tone of production in 2024 and are a heritage crop, food-security product, rural-income source, and export/value-added opportunity.
• How important is protected farming in Oman?
Protected farming is important because Oman has very limited arable land and low rainfall. Greenhouses, drip irrigation, and hydroponics can raise output while reducing land and groundwater pressure.
• Which governorates are important for Oman agriculture?
Al Batinah North and South are key fresh-produce areas, Al Dakhil Iyah is important for livestock and traditional agriculture, and Dhofar, Sharqiyah, Musandam, and Al Wasta have distinct crop, livestock, and coastal roles.
• How does water scarcity affect Oman agriculture?
Water scarcity shapes crop choice, irrigation strategy, productivity, and long-term sustainability. Oman’s arable land share was only 0.28152% of land area in 2023, and average rainfall was recorded at 100 mm in the land-water baseline.
• Does Oman rely on food imports?
Yes. Imports remain important, especially in fresh produce and staple categories. Fruit and vegetable imports reached USD 286.2 million from January to May 2024, while exports were USD 35.2 million.
• Why do fisheries matter in Oman’s food system?
Fisheries are a major food-security strength. Fish self-sufficiency reached 144.5% in 2024, meaning fish output exceeded domestic self-sufficiency needs.
• Which metrics matter most for Oman agriculture analysis?
The most useful scorecard combines agriculture value added, crop output, dates, vegetables, livestock, fisheries, imports, self-sufficiency, arable land, protected cultivation, water productivity, and governorate-level production.
Final Takeaway
Agriculture in Oman statistics point to one conclusion: the market is not large by global standards, but it is strategically important. Oman’s food system depends on crop output, dates, vegetables, livestock, fisheries, imports, water efficiency, and governorate-level production working together.
The strongest strategy is not to produce more of everything. It is to grow the right foods in the right places, improve water productivity, expand protected farming, strengthen fisheries, protect date value chains, reduce post-harvest losses, and use domestic production to make the food system more resilient.