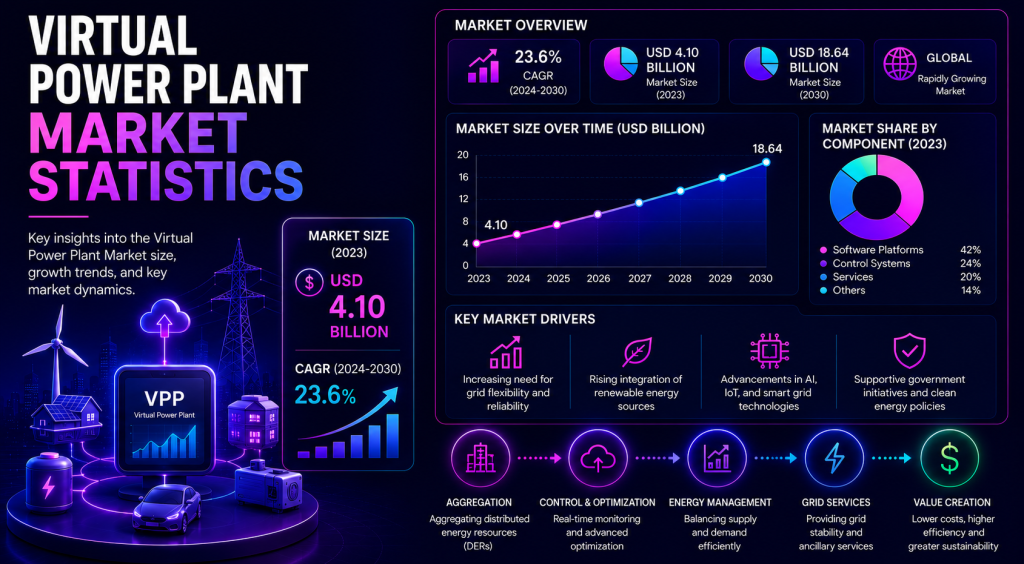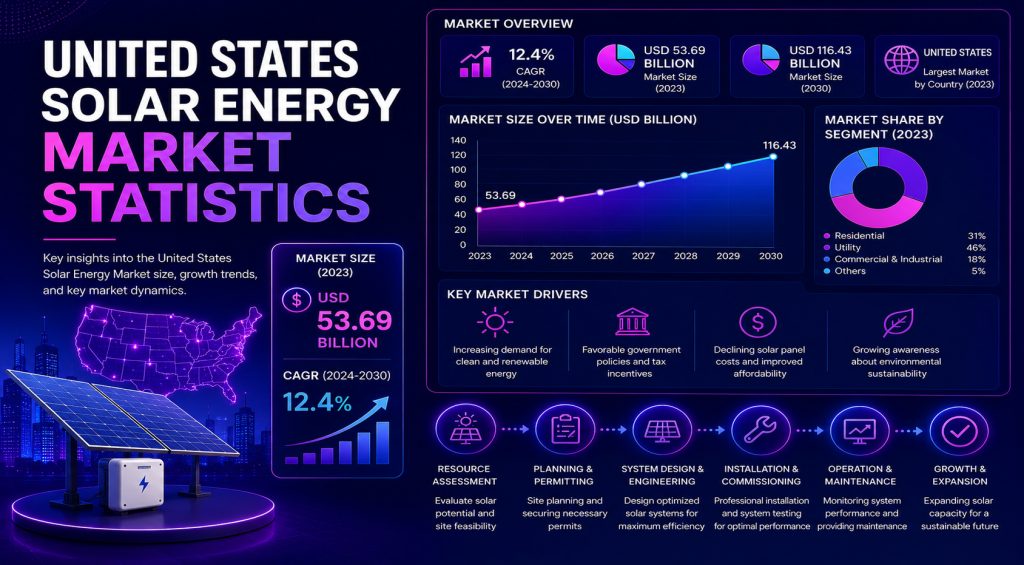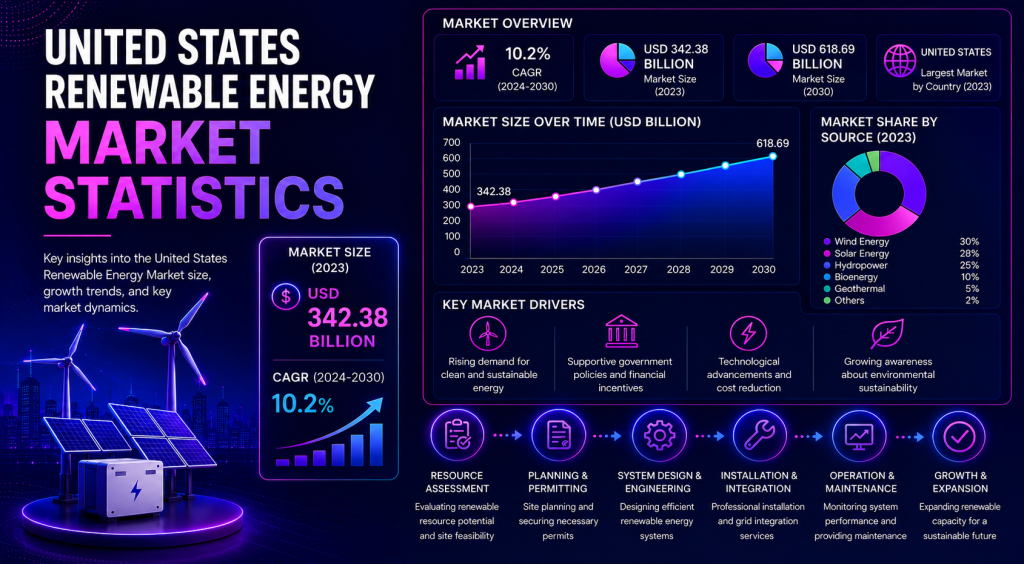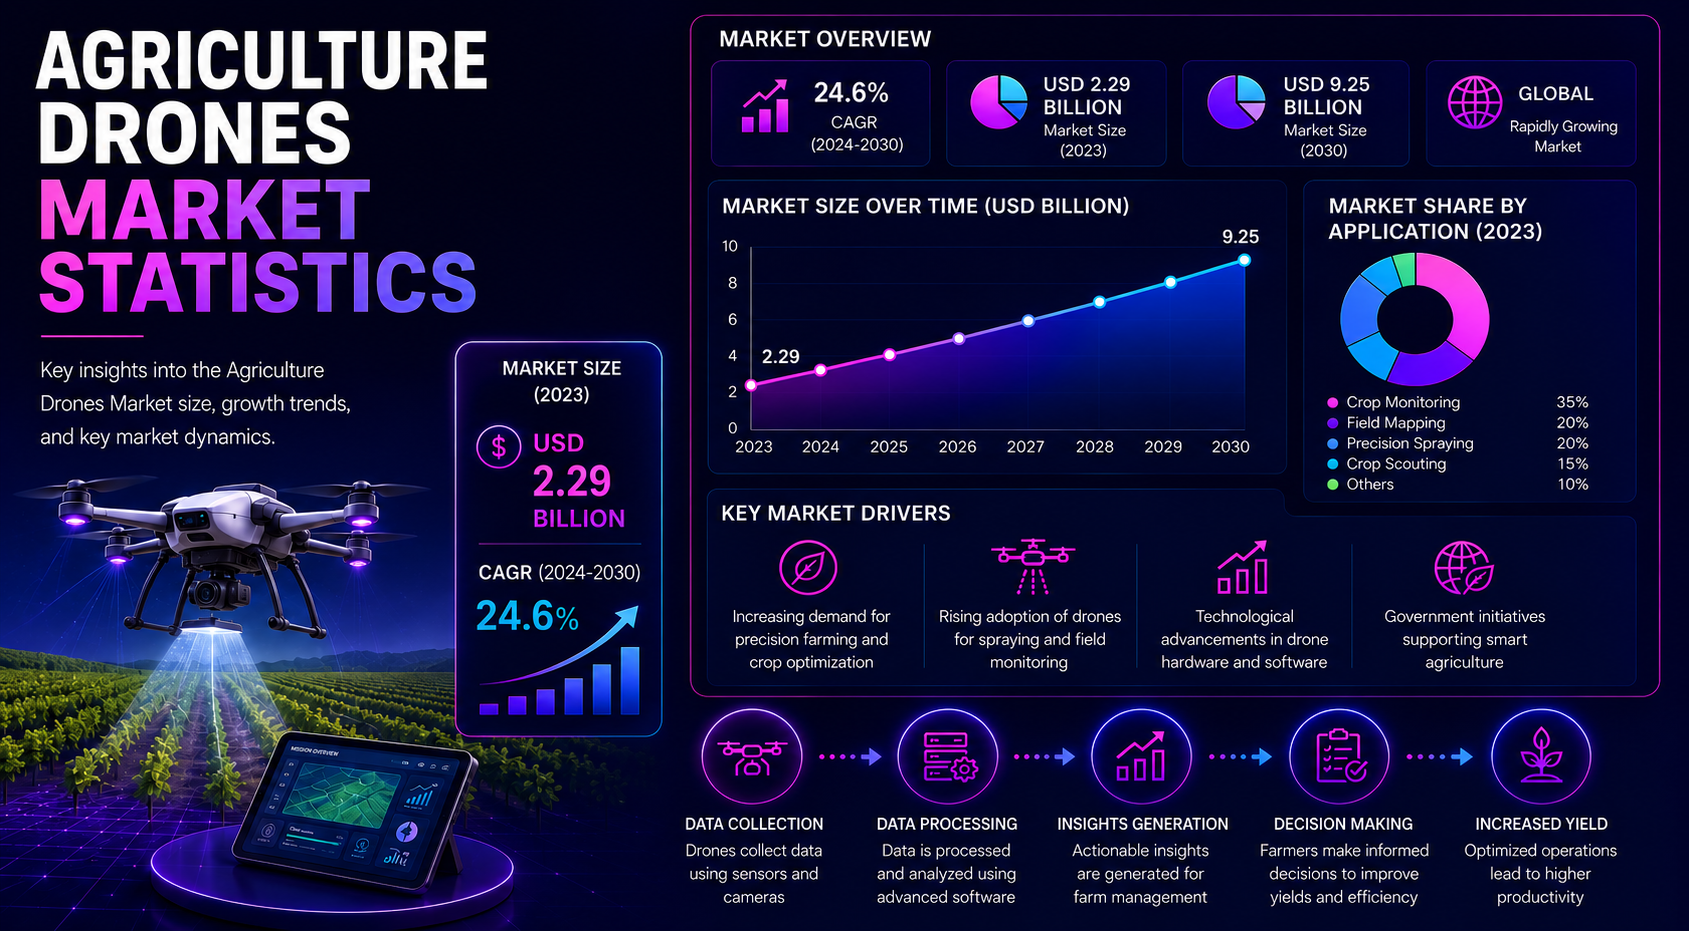
Agriculture drones are where farm productivity, labour pressure, input efficiency, and precision agriculture meet. The technology is moving from experimental field imaging into a practical farming tool used for crop monitoring, spraying, mapping, irrigation planning, livestock observation, and farm analytics.
The strongest statistics show why the category now deserves its own market scorecard. Markets and Markets places the global agriculture drones market at USD 2.63 billion in 2025 and projects USD 10.76 billion by 2030 at 32.6% CAGR. Grand View Research places the market at USD 3.4 billion in 2025 and USD 13.2 billion by 2033, while Fortune Business Insights reports a broader path from USD 6.10 billion in 2024 to USD 23.78 billion by 2032.
Executive Agriculture Drone Benchmarks
These are the headline statistics that frame the article. They show the size of the opportunity, the speed of growth, the operational reason farms are using drones, and the difference between a drone sale and a repeatable farm workflow.
The numbers that define the agriculture drone shift
- MarketsandMarkets places the agriculture drones market at USD 2.63 billion in 2025 and USD 10.76 billion by 2030.
- The same path implies a 32.6% CAGR between 2025 and 2030, making agriculture drones one of the faster-growing precision-farming categories.
- Grand View Research estimates USD 3.4 billion in 2025 and projects USD 13.2 billion by 2033 at 18.8% CAGR.
- Fortune Business Insights reports USD 6.10 billion in 2024 and forecasts USD 23.78 billion by 2032 at 18.5% CAGR.
- Allied Market Research places the older baseline at USD 0.88 billion in 2020 and USD 5.89 billion by 2030, showing how the market has moved from early adoption into scale planning.
- Global agricultural land exceeds 4.7 billion hectares, and global cropland is about 1.57 billion hectares, creating a large base for monitoring, mapping, spraying, and analytics.
- Drone spraying benchmarks show coverage of 5–10 acres per hour, while daily planning scenarios can reach 50–100 acres per day depending on coverage rate and operating hours.
- Selected spraying benchmarks show 30–40% lower pesticide consumption and up to 90% less carrier-water use in cited use cases.
- Rotary-wing drones led the product category with about 62% share in a collected segment benchmark, reflecting their practical fit for spraying, scouting, and close-field work.
- North America held over 33.5% of the global market in one 2025 estimate, while Asia-Pacific shows strong growth because China and India combine manufacturing scale, farm demand, and public adoption programs.
| Metric | Latest value | Market meaning |
|---|---|---|
| 2025 market size | USD 2.63B to USD 3.4B | Market is already measured in billions before full service revenue is counted. |
| 2030 forecast | USD 10.76B | Growth depends on hardware, spraying services, analytics, and farm software. |
| CAGR range | 18.5% to 32.6%+ | Forecasts differ by scope, but all show strong double-digit expansion. |
| Global agricultural land | 4.7B+ hectares | The addressable base for monitoring and field intelligence is very large. |
| Spraying productivity | 5-10 acres/hour | Drones can become practical for targeted spraying and smaller-field operations. |
| Input savings | 30-40% pesticide; up to 90% water | Efficiency is a core business case, not just a sustainability claim. |
| Leading platform signal | Rotary-wing around 62% | Multi-rotor drones fit spraying, scouting, and flexible field access. |
| Regional signal | North America above 33.5% share | Mature precision-farming markets remain important demand centers. |
Editorial readout
Agriculture drones are not only a hardware market. They are a farm-efficiency, crop-intelligence, input-optimization, labor-support, and data-services market. The strongest analysis separates adoption by application, farm size, crop type, region, regulation, and service availability.
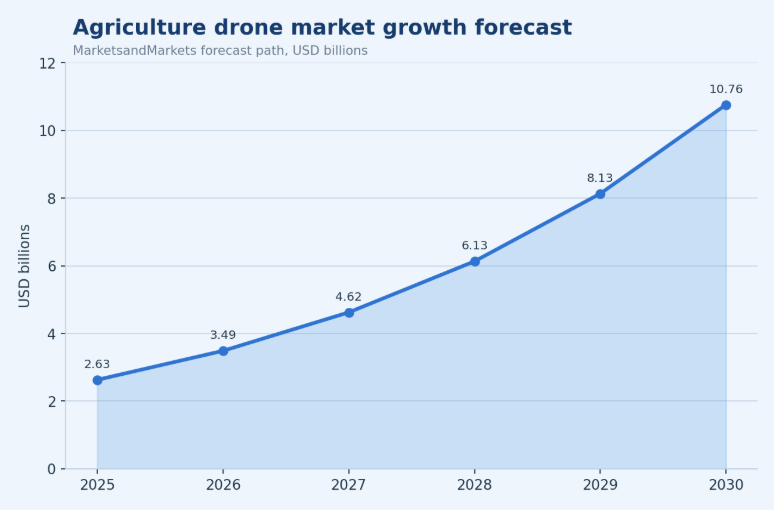
Figure 1. Agriculture drone market growth should be reviewed with precision-farming adoption, labor pressure, and input-efficiency demand because the market depends on both drone hardware and farm-service workflows.
Agriculture Drones Market Size and Forecast
The market should be read as a forecast range, not a single fixed number. Agriculture drone estimates vary because some reports focus on aircraft and payloads, while others include software, analytics, spraying services, sensors, training, maintenance, and drone-as-a-service models.
That spread is useful. A narrow hardware-only estimate shows equipment demand, while a broader estimate shows how drones become part of precision agriculture, crop consulting, and field-service economics. The practical question is not only how many drones are sold; it is how often those drones are used to make farm decisions.
Market-size and growth benchmarks
- MarketsandMarkets provides a mid-range commercial path from USD 2.63 billion in 2025 to USD 10.76 billion by 2030.
- Grand View Research reports USD 3.4 billion in 2025 and USD 13.2 billion by 2033, with North America holding more than 33.5% share in 2025.
- Fortune Business Insights places the broader agriculture drone market at USD 6.10 billion in 2024 and USD 23.78 billion by 2032.
- Allied Market Research uses an earlier baseline of USD 0.88 billion in 2020 and USD 5.89 billion by 2030.
- Market Research Future and Maximize Market Research provide more aggressive long-range scenarios, which are useful for stress-testing what happens if drone services, autonomy, and software adoption expand together.
| Forecast path | Base value | Target value | CAGR / signal |
|---|---|---|---|
| MarketsandMarkets | USD 2.63B in 2025 | USD 10.76B by 2030 | 32.6% CAGR |
| Grand View Research | USD 3.4B in 2025 | USD 13.2B by 2033 | 18.8% CAGR |
| Fortune Business Insights | USD 6.10B in 2024 | USD 23.78B by 2032 | 18.5% CAGR |
| Allied Market Research | USD 0.88B in 2020 | USD 5.89B by 2030 | 22.4% CAGR |
| High-growth scenario | USD 7.86B in 2025 | USD 51.18B by 2032 | 30.7% CAGR signal |
Market sizing readout
Forecast spread matters because agriculture drones are moving from equipment sales into integrated farming workflows. The market becomes larger when spraying services, software, sensors, analytics, training, maintenance, and drone-as-a-service models are included.
Forecast Scenario Interpretation
Agriculture drone forecasts should be read as scenarios because the category is expanding through several channels at once. Hardware demand, spraying services, farm analytics, sensors, training, and drone-as-a-service can each change the measured market size. A smaller forecast may still be useful if it focuses on equipment revenue, while a larger forecast may include the broader operating ecosystem around drones.
The most reliable strategy is to compare conservative, mid-range, and high-growth paths instead of forcing one headline number. The mid-range path is useful for article planning because it connects visible market growth with practical adoption in monitoring, spraying, mapping, and farm-service models.
Scenario signals to compare
- A conservative scenario treats drones as useful but still concentrated in scouting, mapping, and selected spraying services.
- A mid-range scenario assumes wider use across crop monitoring, spraying, irrigation planning, and farm analytics.
- A high-growth scenario assumes faster service-provider adoption, supportive regulation, and stronger software integration.
- A services-led scenario becomes more likely when smaller farms use contractors instead of purchasing drones directly.
- A regional-growth scenario depends on China, India, the United States, Brazil, Australia, and Europe converting pilots into repeat field operations.
Scenario readout
The best forecast interpretation is not one revenue number. Agriculture drone growth should be measured through adoption depth: how often drones are used, how many acres they influence, whether spraying and scouting repeat each season, and whether drone data changes farm decisions.
Why Agriculture Drones Now Carry Farm-Efficiency Stakes
Agriculture drones matter because the farm decision cycle is getting tighter. Farmers need faster field visibility, lower input waste, better crop-risk detection, and more efficient labor use. Drones help when they reduce the time between seeing a field problem and acting on it.
The business case is strongest where farm scale, crop value, labor pressure, and precision-agriculture readiness overlap. A drone can help a large farm cover acreage faster, but it can also help smaller farms when service providers make spraying, mapping, and scouting available without a large upfront equipment purchase.
Farm pressures behind drone adoption
- Labor pressure increases the value of remote scouting, semi-automated spraying, and drone-as-a-service crews.
- Rising input costs make targeted pesticide, fertilizer, and water decisions more important.
- Water stress increases the value of irrigation monitoring, plant-stress detection, and field-level moisture intelligence.
- Climate variability raises demand for faster crop-loss detection after drought, heat, flood, wind, or pest events.
- Government programs in several countries support drone use through subsidies, pilots, training, or rural digitization policies.
- The larger precision-agriculture market creates demand for drone data that can plug into field records, variable-rate planning, and agronomy platforms.
| Market driver | Drone signal | Why it matters |
|---|---|---|
| Labor pressure | Remote scouting and spraying crews | Supports farms when skilled field labor is limited or expensive. |
| Input cost inflation | Targeted application and spot spraying | Reduces waste when chemicals, fertilizer, and water are costly. |
| Water stress | Irrigation and crop-stress monitoring | Helps prioritize field interventions before visible damage spreads. |
| Crop-loss risk | Faster field imaging and damage documentation | Improves response time and insurance evidence. |
| Farm digitization | Drone data integrated into software | Turns flights into repeatable crop-management workflows. |
| Service models | Drone-as-a-service expansion | Makes adoption easier for growers who cannot buy or staff their own fleet. |
Priority readout
Agriculture drones gain value when they shorten the distance between field conditions and farm decisions. The strongest use cases help farmers act earlier, apply inputs more precisely, and reduce field uncertainty.
Application Statistics: Monitoring, Spraying, Mapping, Irrigation, and Livestock
Applications explain why the market is growing. A farm drone is not one product with one use. It can scout crops, capture field maps, guide spraying, support irrigation decisions, monitor livestock, document storm damage, or feed data into farm-management software.
The most useful application view separates task frequency from task value. Crop scouting may happen often, spraying may produce clearer operational savings, mapping may support longer-term planning, and insurance documentation may be valuable only during specific loss events.
Application benchmarks worth separating
- Crop monitoring and scouting receives a 28% planning share in the application mix used for this article.
- Spraying and variable-rate application receives a 24% planning share, reflecting strong interest in input efficiency.
- Mapping and surveying receives a 17% planning share because drones can produce high-resolution field maps more quickly than manual survey workflows.
- Irrigation monitoring receives a 10% planning share, especially where water stress, uneven field conditions, or high-value crops make early detection valuable.
- Soil and field analysis receives an 8% planning share, while livestock monitoring, seeding support, and other farm operations complete the mix.
- Drone images become more valuable when they connect to NDVI, thermal, multispectral, disease detection, and farm-management analytics.
| Application | Key statistic | Farm impact |
|---|---|---|
| Crop monitoring | 28% planning share | Supports scouting, stress detection, and field prioritization. |
| Drone spraying | 24% planning share | Targets chemicals and fertilizer where field conditions justify application. |
| Field mapping | 17% planning share | Improves field records, drainage plans, and crop-condition visibility. |
| Irrigation monitoring | 10% planning share | Helps identify water stress and uneven irrigation patterns. |
| Soil and field analysis | 8% planning share | Adds context for input planning and field variability. |
| Livestock monitoring | 5% planning share | Supports rangeland checks and animal-location awareness. |
| Seeding support | 4% planning share | Useful for selected crops, cover crops, and restoration tasks. |
Application readout
The strongest agriculture drone opportunity is not one task. It is the combination of scouting, spraying, mapping, irrigation decisions, and analytics inside one repeatable farm workflow.
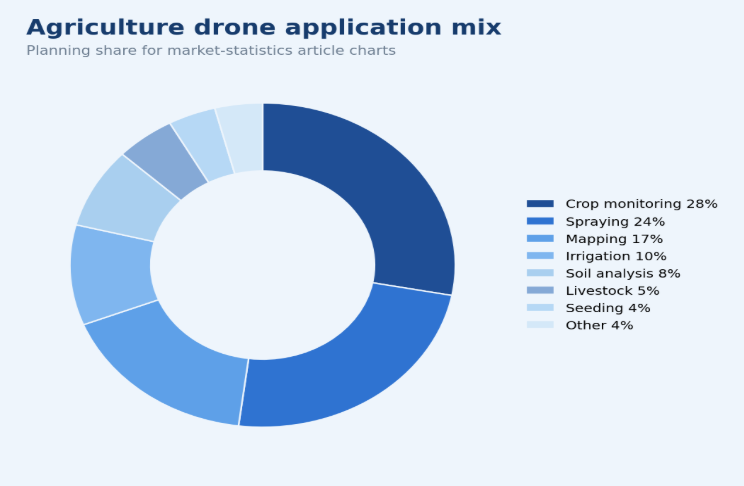
Figure 2. Agriculture drone adoption is strongest when monitoring, spraying, mapping, and analytics are treated as connected workflows rather than separate technology purchases.
Drone Platform and Technology Statistics
Drone platform choice matters because spraying, mapping, scouting, livestock monitoring, and remote sensing do not require the same aircraft design. The same farm may use rotary drones for spraying and fixed-wing or hybrid aircraft for larger-area mapping.
Rotary-wing drones are practical where hovering, vertical takeoff, accurate positioning, and payload control matter. Fixed-wing drones are useful for larger-area mapping because they can cover more ground per flight. Hybrid VTOL systems try to combine fixed-wing range with vertical takeoff flexibility.
Platform and sensor benchmarks
- Rotary-wing drones led agriculture drone product category benchmarks with about 62% market share in 2025.
- Hybrid drone designs are projected to expand at about 18.9% CAGR through 2031 in one collected segment outlook.
- Hardware accounted for about 55% of agriculture drones market size in one 2025 component benchmark and 63.4% revenue share in another 2025 estimate.
- Software is projected to grow at 25.5% CAGR in one collected source, showing that analytics and farm integration are becoming more important.
- Services are projected to advance at 17.8% CAGR to 2031 in a collected benchmark, supporting drone-as-a-service and specialist operator models.
- Agricultural drone flight autonomy can range from about 20 minutes to several hours depending on platform, payload, battery, and mission type.
| Drone type | Best use | Market meaning |
|---|---|---|
| Rotary-wing | Spraying, scouting, close-field inspection | Flexible and practical for many farm tasks. |
| Fixed-wing | Large-area mapping | Covers acreage efficiently where payload needs are lighter. |
| Hybrid VTOL | Longer-range mapping with vertical takeoff | Useful where fields are large but runway access is limited. |
| Spraying drone | Pesticide and fertilizer application | Driven by input savings and labor efficiency. |
| Mapping drone | Ortho mosaics, field maps, damage evidence | Converts field visibility into planning and documentation. |
| Sensor-heavy drone | NDVI, thermal, multispectral, LiDAR | Creates higher-value analytics for crop decisions. |
Technology readout
Drone type should be selected by field size, application, payload, flight time, and required data quality. A spraying drone, mapping drone, and livestock-monitoring drone solve different farm problems.
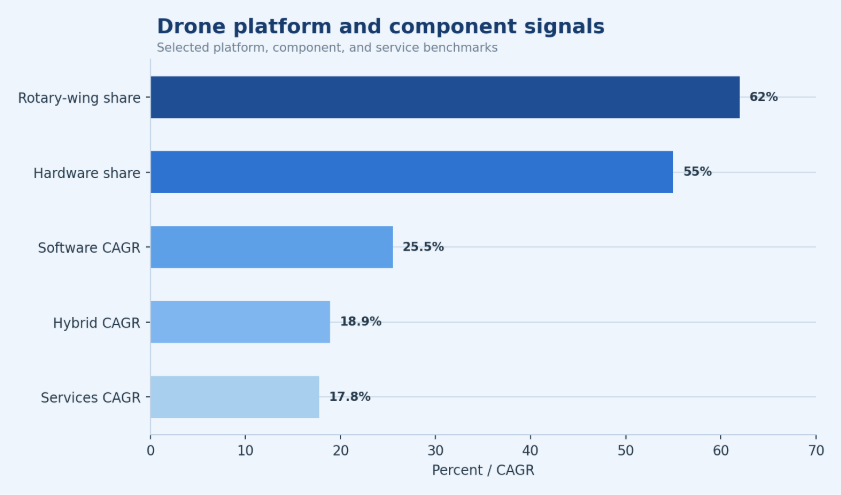
Figure 3. Agriculture drone platforms should be compared by field size, payload, endurance, and application because spraying, mapping, and scouting do not require the same configuration.
Drone Spraying Economics: Labor, Inputs, and Field Productivity
Drone spraying should be treated as an operating-economics section, not only a technology section. The most useful benchmarks compare acres covered, input savings, labor requirements, refill time, field shape, crop height, weather limits, and local operating rules.
Spraying drones are attractive because they can operate in conditions where large ground equipment may be inefficient, risky, or unavailable. They can also make targeted spraying easier in smaller fields, wet fields, hilly terrain, specialty crops, and plots where spot treatment matters more than broadcast coverage.
Spraying and input-efficiency benchmarks
- GPS-guided spray drones commonly fly 7–10 feet above the crop canopy in cited spraying benchmarks.
- Spray drones can cover about 5–10 acres per hour, depending on payload, refill time, battery swaps, and field conditions.
- Some benchmarks show agricultural spray drones can cover 2–5 times more area faster than traditional machinery in selected conditions.
- A collected benchmark shows agricultural spray drones can process fields at rates up to 50 acres per day.
- Drone spraying can reach application accuracy of up to 95% in a cited precision-agriculture review benchmark.
- Selected benchmarks show up to 70% lower labor needs and about 50% lower off-target contamination with spray-drone use.
- Spray drone tank capacity is often around 10–15 litters, while battery flight time can be about 10–20 minutes per cycle in cited benchmarks.
- An Australia spot-spraying case study showed 35% average herbicide reduction and up to 65% reduction in low-weed-pressure strips.
| Metric | Benchmark | What it means for farms |
|---|---|---|
| Coverage rate | 5-10 acres/hour | Useful for targeted spraying and time-sensitive applications. |
| Daily coverage | 50 acres/day signal | Workflow depends on hours, refill speed, batteries, and field layout. |
| Pesticide reduction | 30-40% | Shows input-efficiency potential in selected use cases. |
| Carrier-water reduction | Up to 90% | Reduces water handling and refill burden. |
| Application accuracy | Up to 95% | Supports targeted application and field consistency. |
| Labor reduction | Up to 70% | Helps when field labor is scarce or costly. |
| Tank capacity | 10-15 litres | Payload limits affect mission planning and refill frequency. |
| Flight time | 10-20 minutes | Battery logistics are central to practical field economics. |
Cost interpretation
Drone spraying should be measured by the full field workflow, not flight time alone. Battery changes, refill time, weather, payload, crop height, field shape, and operator skill all affect the true cost per acre.
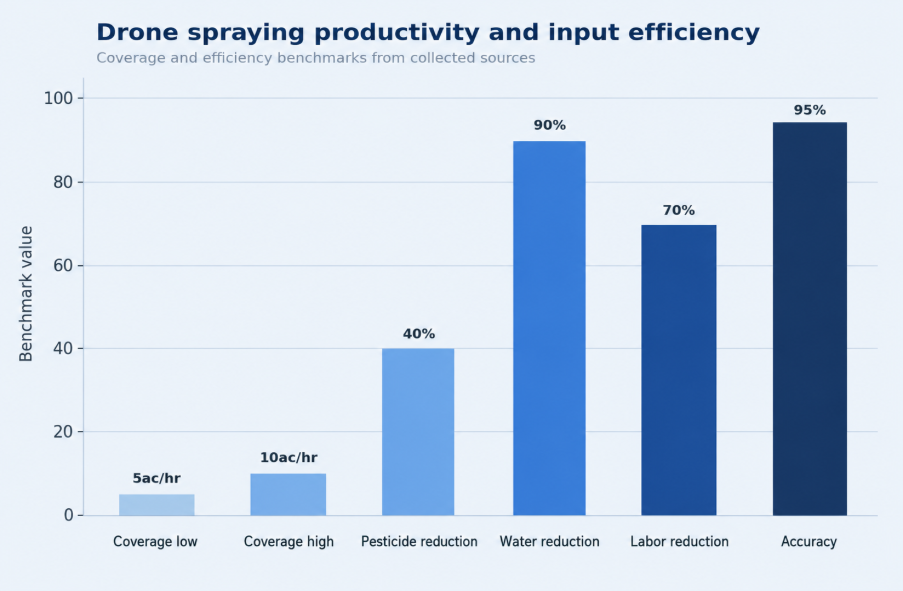
Figure 4. Drone spraying economics should be evaluated through acres covered, input savings, labor needs, refill time, and regulatory limits rather than purchase price alone.
Precision Agriculture and Farm Productivity Statistics
Agriculture drones become more valuable when they are part of a precision-farming stack. The drone captures field data, but the value comes from turning that data into decisions about scouting, irrigation, disease control, fertilizer timing, replanting, and harvest planning.
A drone image alone may confirm that a field has variation. A drone image connected to vegetation indexes, crop modeling, weather data, scouting records, and variable-rate equipment can change how the farm allocates inputs. That is where the statistics become operational rather than descriptive.
- Drones provide real-time and high-resolution data collection for farm decisions, supporting faster field visibility than manual scouting alone.
- Remote sensing, NDVI, multispectral imaging, and thermal imaging support plant-stress detection before some problems are visible from the ground.
- Drone mapping supports field surveys, drainage planning, plant counts, damage assessment, and insurance documentation.
- Variable-rate input planning becomes stronger when field imagery is connected to agronomy recommendations and farm records.
- Autonomous route planning and AI analytics can reduce the effort needed to repeat scouting or spraying missions across the season.
- Farm productivity gains should be measured through decision quality, input savings, labor hours saved, and crop-loss prevention rather than image count alone.
| Precision agriculture layer | Drone role | Business impact |
|---|---|---|
| Field scouting | High-resolution imagery | Finds crop stress faster than manual-only checks. |
| Vegetation indexing | NDVI and multispectral maps | Shows variability across fields and crop stages. |
| Input planning | Target zones for treatment | Supports variable-rate decisions and targeted spraying. |
| Irrigation decisions | Water-stress detection | Helps prioritize irrigation or drainage interventions. |
| Disease detection | Early visual and spectral signals | Improves response time before damage spreads. |
| Yield prediction | Field condition and stand data | Supports planning, insurance, and harvest expectations. |
| Sustainability reporting | Documented field records | Supports input reduction and compliance claims. |
Precision agriculture interpretation
Drone images create more value when they connect to agronomy decisions. A field image alone is useful, but a field image tied to crop modeling, input planning, irrigation decisions, and farm records becomes a stronger business tool.
Regional Agriculture Drone Market Statistics
Regional drone adoption should be explained through farm size, regulation, crop economics, labor availability, and technology readiness. Global averages are useful, but they can hide very different adoption patterns between China, the United States, India, Brazil, Europe, Australia, and Africa.
Regional adoption benchmarks
- North America held more than 33.5% of global agriculture drones market share in one 2025 estimate.
- The United States market was estimated at USD 506.3 million in 2024 and projected to grow at 23.5% CAGR from 2025 to 2030 in a collected source.
- Southern Asia had about 238 million hectares of cropland in 2022, while Eastern Europe had 197 million hectares and Northern America had 193 million hectares.
- Asia-Pacific combines large cropland, drone manufacturing strength, government programs, and farm-service potential.
- Latin America adds opportunity through Brazil, Argentina, Mexico, Chile, Colombia, and large crop systems such as soybeans, corn, sugarcane, coffee, and fruit.
- Middle East and Africa markets are shaped by food security, water stress, large projects, and the need to improve farm visibility where extension resources may be limited.
| Region | Key adoption signal | Market interpretation |
|---|---|---|
| North America | Above 33.5% share in one 2025 estimate | Precision-farming maturity and large farms support demand. |
| Asia-Pacific | Large cropland and manufacturing strength | China and India can shape both supply and adoption. |
| Europe | Input reduction and sustainability pressure | Drones support compliance, mapping, and precision application. |
| Latin America | Large crop operations and export agriculture | Strong opportunity in soy, corn, sugarcane, coffee, and fruit. |
| Middle East & Africa | Food security and water stress | Drones can support irrigation intelligence and crop monitoring. |
| Oceania | Broadacre farming and remote operations | Australia is a practical market for mapping and livestock monitoring. |
Regional readout
Asia-Pacific can lead through manufacturing scale and government-supported adoption. North America and Europe can lead through precision-agriculture maturity, high-value crops, and service ecosystems. Latin America, Africa, and the Middle East add long-term opportunity through farm scale, food-security pressure, and water-stress management.
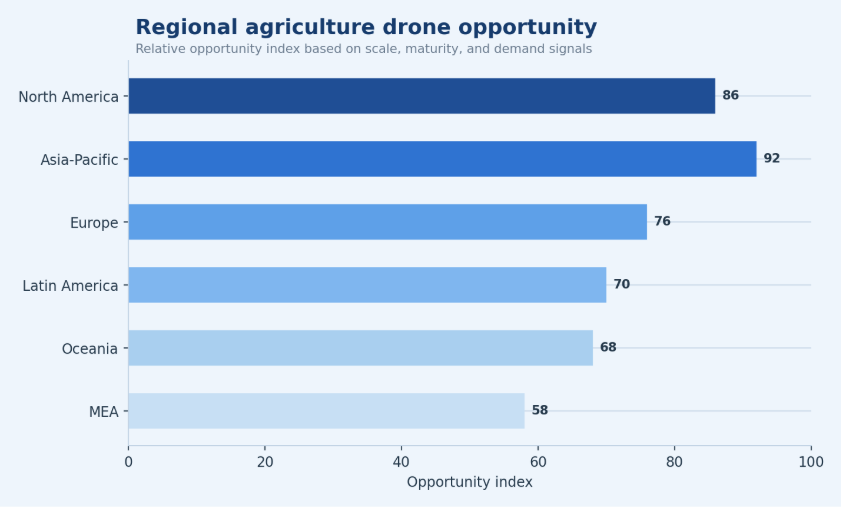
Figure 5. Regional agriculture drone demand should be measured by farm scale, crop value, labor availability, regulation, and precision-agriculture readiness rather than market size alone.
Country-Level Agriculture Drone Market Statistics
Country-level statistics make the market more practical. A national opportunity depends on more than GDP or farm area. It depends on crop mix, farm size, regulation, subsidy support, operator training, dealer networks, service providers, and whether drone data can be converted into agronomic action.
Country signals worth tracking
- China had around 300,000 operational agricultural drones by end-2025 in a collected country signal, showing how quickly drone use can scale when manufacturing, policy, and service ecosystems align.
- DJI was described in collected sources as controlling about 90% of the global civil drone market, making China central to agriculture drone supply chains.
- India’s opportunity is tied to smallholder services, subsidy support, water savings, and drone-as-a-service models that reduce ownership barriers.
- The United States combines large farms, precision-agriculture maturity, FAA operating rules, high-value crops, and a growing service ecosystem.
- Brazil and Argentina are important because large-scale soy, corn, sugarcane, and livestock systems can support mapping, spraying, and farm-data services.
- Australia is useful for broadacre operations, livestock monitoring, remote-area mapping, and spot-spraying experiments.
| Country | Demand driver | Drone opportunity | Maturity signal |
|---|---|---|---|
| United States | Large farms; precision-ag maturity | Scouting, spraying, mapping | High commercial readiness |
| China | Manufacturing scale; policy support | Spraying fleets and service models | Highest production signal |
| India | Smallholder access; subsidies | Drone services, spraying, water savings | Fast adoption potential |
| Brazil | Large crop operations | Soy, corn, sugarcane, coffee, livestock mapping | Strong scale fit |
| Australia | Broadacre and remote operations | Mapping, livestock monitoring, spot spraying | Practical field fit |
| Canada | Large acreage and precision farming | Scouting, mapping, crop insurance support | Mature demand pocket |
| Germany / France / UK | Sustainability and compliance | Input reduction, mapping, records | Regulation-sensitive market |
| South Africa | Food security and commercial farms | Monitoring, spraying, water-stress analytics | Emerging opportunity |
| Saudi Arabia / UAE | Water stress and controlled farming | Irrigation intelligence and protected farming | Policy-linked opportunity |
Country readout
Country-level drone adoption should be ranked by farm size, crop economics, regulation, subsidy support, service-provider availability, operator training, and agronomic analytics—not only by hardware sales.
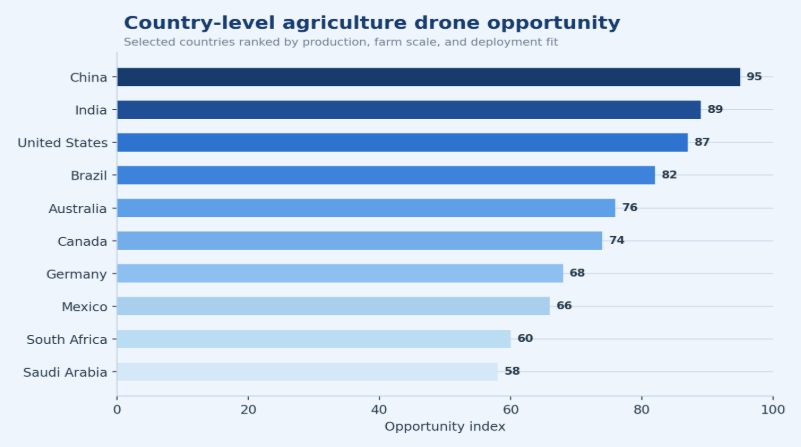
Figure 6. Country-level agriculture drone opportunity is strongest where farm scale, crop value, labor pressure, and regulatory readiness support commercial drone deployment.
Company, Technology, and Ecosystem Statistics
The agriculture drone market will not be decided by aircraft alone. Adoption depends on the wider ecosystem around sensors, software, trained operators, service providers, agronomic interpretation, maintenance, batteries, payloads, and regulation.
Hardware companies matter because they determine reliability, payload, flight time, serviceability, and price. Software companies matter because they turn images into decisions. Service providers matter because they make the technology usable for farms that do not want to own, license, insure, and maintain drones themselves.
- Drone manufacturers shape cost, battery performance, payload capacity, repair access, and safety features.
- Spraying drone makers are important because chemical application requires different workflow, tank, nozzle, and compliance requirements than imaging.
- Mapping and analytics platforms convert field images into vegetation maps, stand counts, field reports, and scouting priorities.
- Sensor providers shape the value of drone data through RGB, multispectral, thermal, and LiDAR payloads.
- Drone-as-a-service providers can reduce adoption barriers for smaller farms and seasonal users.
- Training and certification providers are important because safe and legal operation can decide whether drones move from pilot projects to repeat field use.
| Company / ecosystem type | Market signal | Likely role |
|---|---|---|
| Hardware manufacturers | Aircraft, payload, battery reliability | Set equipment economics and field capability. |
| Spraying drone makers | Input application and spot spraying | Drive direct farm productivity use cases. |
| Mapping software | Image processing and analytics | Turn flights into usable crop intelligence. |
| Sensor payload providers | Multispectral, thermal, LiDAR, RGB | Increase the value of each flight. |
| Drone-as-a-service providers | Lower ownership and training barriers | Help smaller farms access drone capability. |
| Agronomy consultants | Interpretation and recommendations | Convert images into field decisions. |
| Regulators and certification bodies | Airspace, spraying, safety, licensing | Shape adoption speed and compliance risk. |
Ecosystem readout
The market will not be decided by aircraft alone. The strongest ecosystem combines reliable drones, useful sensors, trained operators, agronomic interpretation, software integration, maintenance support, and service models that work for farms of different sizes.
Cost, ROI, and Farm-Level Economics
Agriculture drone ROI should be measured at farm level. Purchase price matters, but the stronger test is whether drones reduce scouting time, improve input targeting, reduce crop-loss risk, support better field decisions, or replace a more expensive manual process.
A drone does not need to increase yield directly to create value. It can pay for itself by reducing wasted application, documenting crop damage, identifying irrigation problems earlier, lowering labor hours, or helping agronomists cover more fields in less time.
- The true cost per acre depends on drone purchase price, batteries, maintenance, software, training, licensing, insurance, operator time, refill workflow, and data processing.
- Spraying economics should compare drone cost with manual crews, tractor or boom-sprayer availability, crop height, soil conditions, and terrain limitations.
- Drone-as-a-service economics should be compared against ownership when usage is seasonal, farm size is small, or trained operators are scarce.
- Input savings create value when drone spraying reduces over-application, supports spot treatment, or improves timing.
- Labor savings are strongest where scouting or spraying would otherwise require repeated field walking, manual backpack spraying, or delayed service.
- Crop-loss prevention may be the highest-value benefit when early detection prevents a pest, disease, or irrigation issue from spreading.
| Cost or benefit area | What to measure | Why it matters |
|---|---|---|
| Drone purchase | Aircraft, payload, batteries | Sets initial capital requirement. |
| Battery and maintenance | Cycles, replacement, repair access | Controls operating reliability and cost. |
| Software | Mapping and analytics subscriptions | Determines whether data becomes decision support. |
| Operator training | Licensing and field skill | Affects safety, compliance, and repeatability. |
| Spraying cost per acre | Labor, chemical, refill, battery time | Shows whether drone spraying beats alternatives. |
| Input savings | Chemical, fertilizer, water reduction | Turns precision into measurable farm economics. |
| Yield protection | Loss avoided through earlier action | Captures value beyond direct yield lift. |
| Service-provider alternative | Cost versus ownership | Useful for farms with seasonal or low-frequency demand. |
ROI interpretation
A drone does not need to increase yield directly to create ROI. It can reduce scouting time, improve input targeting, document field conditions, speed up pest detection, and help farmers make earlier decisions.
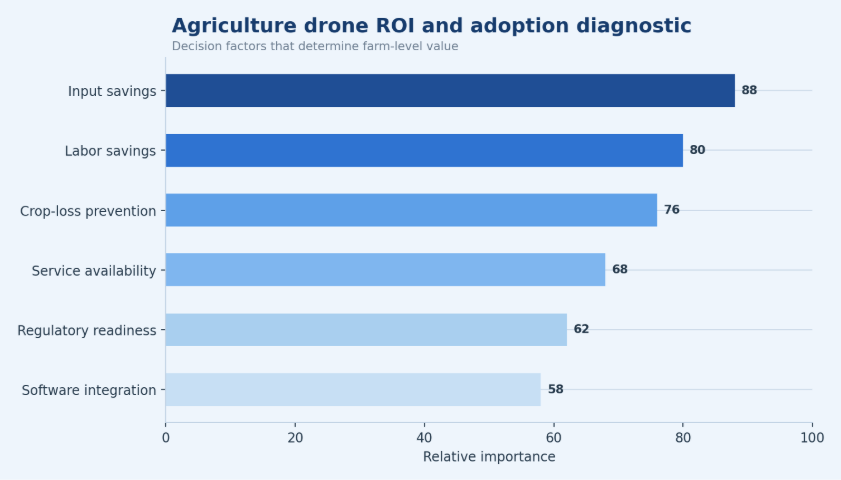
Figure 7. Agriculture drone ROI should be measured through farm economics, input savings, field workflow, and adoption readiness rather than flights alone.
Crop, Farm-Size, and Procurement Signals
Agriculture drone economics change by crop type, farm size, and the way the technology is purchased. A large grain operation, a rice farm, a fruit orchard, a vineyard, and a livestock ranch may all use drones, but the value model is not the same.
High-value crops usually justify more frequent monitoring because disease, water stress, pest pressure, and quality issues can change revenue quickly. Broadacre farms may focus more on fast mapping, spot spraying, and scale efficiency. Small farms may prefer drone-as-a-service because ownership requires training, maintenance, insurance, batteries, software, and regulatory compliance.
Crop and farm-size planning signals
- Large farms can justify ownership when drones are used repeatedly for scouting, mapping, spraying, and documentation.
- Small and midsize farms often benefit from service providers because they can access trained operators without carrying full equipment cost.
- High-value crops such as fruits, vegetables, vineyards, and orchards can support more frequent drone monitoring because field problems can become expensive quickly.
- Broadacre crops such as corn, soybeans, wheat, rice, and cotton create stronger demand for wide-area mapping, spot treatment, and efficient spraying workflows.
- Livestock and rangeland operations can use drones for fence checks, animal observation, water-point inspection, and remote-area monitoring.
- Procurement should compare ownership, leasing, and drone-as-a-service against cost per acre, operator utilization, local regulations, and available agronomic support.
Farm-size readout
The strongest procurement decision is not whether a drone can fly. It is whether the farm can use drone data often enough to improve scouting, input timing, labor planning, and crop decisions. Ownership works best when utilization is high; service models work best when farmers need capability without managing the full operating stack.
Adoption Barriers and Market Risks
A balanced market article should explain the barriers clearly. The main risk is not whether drones can work in agriculture; it is whether they can be used repeatably, legally, safely, and profitably across many farms and seasons.
Drones can collect impressive field images, but adoption slows if farmers cannot interpret the data, if regulations limit spraying, if trained operators are unavailable, if rural connectivity is weak, or if service economics do not fit the farm’s crop value and acreage.
- Regulation and licensing remain important because flight rules, pesticide application rules, and beyond-visual-line-of-sight limits vary by country and mission.
- Weather and wind limits can reduce operating windows, especially for spraying and small-payload drones.
- Battery endurance and tank capacity can create refill and swap bottlenecks in large fields.
- Data overload is a real barrier when farmers receive images but not clear agronomic recommendations.
- Upfront cost can slow ownership adoption, especially for small farms or seasonal applications.
- Maintenance and repair access matters because drones must operate when crop windows are narrow and field decisions are urgent.
| Barrier | Why it matters | Improvement path |
|---|---|---|
| Regulation | Limits where and how drones can fly or spray | Clarify licensing and spraying rules. |
| Operator training | Poor operation reduces safety and data quality | Expand certification and training. |
| Battery endurance | Short missions increase swap time | Improve battery logistics. |
| Payload limits | Tank size affects acres covered per run | Match drone size to crop, field, and application. |
| Data overload | Images may not become decisions | Connect drone data to agronomy and farm software. |
| Cost | Ownership may not fit all farms | Use leasing, cooperatives, or drone-as-a-service. |
| Weather limits | Wind and rain reduce spraying windows | Plan operations around weather and crop stage. |
| Service availability | Adoption needs local support | Build local operator and maintenance ecosystems. |
Risk interpretation
The main agriculture drone risk is not lack of interest. It is the gap between visible drone capability and repeatable field-level workflow. Adoption accelerates when regulation, training, service economics, and agronomic interpretation mature together.
Agriculture Drone Market Diagnostic
| Problem area | Core signals to measure | Useful benchmark from this report |
|---|---|---|
| Crop monitoring | Acres scouted, repeat flights, stress alerts | Crop monitoring holds a 28% application planning share. |
| Spraying productivity | Acres/hour, refill time, battery swaps | Benchmarks show 5-10 acres/hour. |
| Input efficiency | Pesticide, water, and drift reduction | Shows 30-40% pesticide and up to 90% water reduction. |
| Labor pressure | Labor hours saved, crew availability | Selected benchmarks show up to 70% lower labor needs. |
| Data analytics | Images converted into actions | Value rises when drone data connects to farm decisions. |
| Regional adoption | Regulation, service networks, crop economics | North America and Asia-Pacific show strong but different adoption drivers. |
| ROI | Cost per acre, input savings, loss avoided | Farm-level economics matter more than flight count. |
Diagnostic readout
The strongest market signal is the combination of application fit, farm economics, regulatory readiness, and repeat use. Drone adoption becomes durable when farms move from one-time imagery to recurring operational decisions.
90-Day Agriculture Drone Market Research Plan
Statistics become useful when they are translated into a research workflow. A 90-day plan helps analysts separate forecast noise from real adoption, field economics, company activity, and country-level opportunity.
| Timing | What to do | Output |
|---|---|---|
| Days 1-15 | Validate market-size forecast range and CAGR assumptions. | Market forecast map. |
| Days 16-30 | Segment applications by monitoring, spraying, mapping, irrigation, livestock, and analytics. | Application matrix. |
| Days 31-45 | Map regional and country-level adoption signals. | Regional dashboard. |
| Days 46-60 | Track companies, drone platforms, payloads, sensors, and service providers. | Ecosystem and supplier watchlist. |
| Days 61-75 | Compare cost per acre, input savings, labor savings, and service economics. | Farm-level ROI model. |
| Days 76-90 | Build market-entry dashboard, investment thesis, and country opportunity ranking. | Final strategic market brief. |
Planning principle
The best agriculture drone research program compares market forecasts with farm-level economics. Priority should go to use cases with clear ROI, regulatory feasibility, service availability, and repeat-use potential.
Metrics Agriculture Leaders Should Track
The final scorecard should separate drone activity from drone value. Flights, images, and acres covered matter, but the strongest metric is whether drone data changes field decisions and improves farm economics.
| Metric | Why it matters |
|---|---|
| Drone adoption rate | Shows whether drones are moving from pilot use to repeat operations. |
| Acres monitored by drone | Measures scouting scale and field-visibility coverage. |
| Acres sprayed by drone | Shows the scale of direct input-application use. |
| Cost per acre | Converts technology use into farm economics. |
| Flight time per mission | Reveals operational efficiency and battery constraints. |
| Payload capacity | Defines spraying, sensor, and mission capability. |
| Operator utilization | Shows whether trained labor is being used efficiently. |
| Crop-stress detection accuracy | Measures whether drone data can support decisions. |
| Input reduction | Captures chemical, fertilizer, and water savings. |
| Labor hours saved | Quantifies productivity gains. |
| Yield-protection impact | Captures value from earlier response to field problems. |
| Service-provider availability | Shows whether adoption can scale beyond owner-operators. |
| Regulatory approval status | Determines what missions are legally feasible. |
| Software integration rate | Shows whether drone data enters farm-management workflows. |
Agriculture Drones Market Statistics FAQ
How big is the agriculture drones market?
Market estimates vary by methodology. MarketsandMarkets places the market at USD 2.63 billion in 2025 and USD 10.76 billion by 2030, while other broader estimates reach higher values by 2032 or 2033.
What is the expected CAGR for agriculture drones?
Collected forecasts show strong double-digit growth. Major estimates range from about 18.5% to 32.6% CAGR, depending on whether the scope includes hardware, services, software, and analytics.
Which region leads the agriculture drones market?
North America held more than 33.5% share in one 2025 estimate, while Asia-Pacific is strategically important because China and India combine large farm demand, manufacturing capacity, and public adoption support.
What are agriculture drones mainly used for?
They are mainly used for crop monitoring, spraying, mapping, irrigation planning, livestock monitoring, field analysis, seeding support, and farm analytics.
Do agriculture drones reduce pesticide and water use?
Selected spraying benchmarks show 30–40% lower pesticide use and up to 90% less carrier-water use, but results depend on crop, field, payload, nozzle setup, operator skill, and application rules.
Are spraying drones replacing traditional equipment?
Spraying drones are more likely to complement traditional equipment than replace it everywhere. They are strongest in targeted spraying, wet fields, uneven terrain, specialty crops, smaller plots, and areas where labor is limited.
Are agriculture drones useful for small farms?
Yes, but the ownership model matters. Drone-as-a-service, cooperatives, and local operators can make drones practical for small farms that cannot justify a full in-house fleet.
What are the main barriers to adoption?
The biggest barriers are regulation, licensing, weather limits, battery endurance, payload capacity, data interpretation, upfront cost, service availability, and maintenance support.
Which crops benefit most from agriculture drones?
High-value crops, broadacre grains, soybeans, corn, rice, sugarcane, cotton, orchards, vineyards, vegetables, and plantation crops can benefit when drone data or spraying changes field decisions.
Which metrics matter most?
The most useful metrics are cost per acre, acres monitored, acres sprayed, input reduction, labor hours saved, detection accuracy, service-provider availability, regulatory approval, and ROI by crop or farm size.
Final Takeaway
Agriculture drones are becoming a measurable precision-farming category because farms need faster visibility, lower input waste, better labor efficiency, and stronger crop decision support. The market is growing because drones can make field information faster, more local, and more actionable.
Drones will not replace every farm machine, and they will not create value in every field automatically. Their strongest roles are crop monitoring, spraying, mapping, irrigation planning, livestock oversight, damage documentation, and data-driven agronomy where field decisions improve because the drone was used.
The best market reading combines forecast growth with farm-level economics, regulation, regional readiness, service-provider networks, and measurable outcomes such as cost per acre, input savings, crop-loss prevention, labor productivity, and repeat-use adoption. That is the difference between a drone purchase and a durable agriculture drone market.