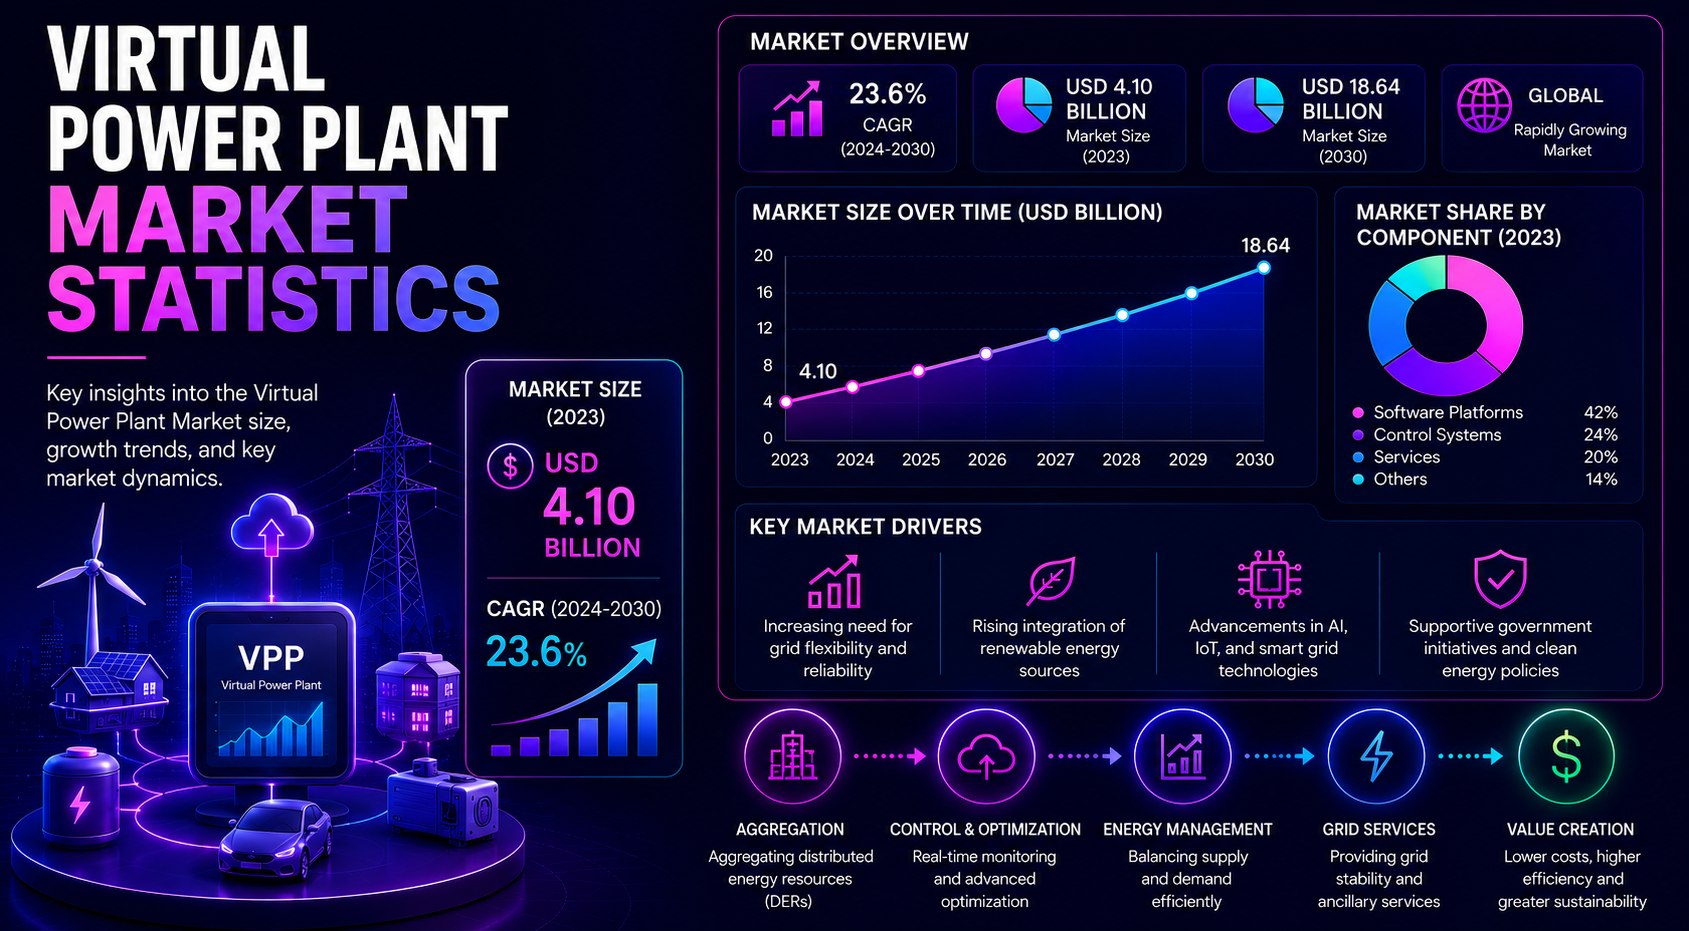
Virtual power plants have moved from pilot programs to one of the most important flexibility models in modern electricity markets. A virtual power plant does not depend on one large power station. It connects many smaller resources—home batteries, electric vehicles, rooftop solar systems, smart thermostats, commercial loads, industrial equipment, backup assets, and grid-interactive buildings—so they can behave like one coordinated power resource.
The market is no longer measured only by demand-response enrollment. It is measured by dispatchable capacity, enrolled devices, delivered megawatts, customer participation, software control, market access, utility procurement, battery duration, EV charging flexibility, and the ability to reduce peak demand without building new fossil-fuel peaker plants. That makes VPPs a grid operating model, a software category, a DER aggregation market, and a customer-participation business at the same time.
The strongest statistics show why VPPs deserve their own scorecard. The U.S. Department of Energy says tripling current VPP capacity to 80–160 GW by 2030 could cover 10–20% of U.S. peak load and save on the order of $10 billion in annual grid costs. Market researchers also show strong revenue growth, with several 2025 global market estimates clustered around the mid-single-digit billions and long-term forecasts moving toward tens of billions by the early-to-mid 2030s.
Executive Virtual Power Plant Benchmarks
These are the statistics that frame the article. They show the scale of VPP capacity potential, the spread of market-size forecasts, the role of distributed energy resources, and the difference between enrolled capacity and dependable grid value.
The numbers that define the virtual power plant market
• The U.S. Department of Energy says 80–160 GW of VPP deployment by 2030 could address 10–20% of U.S. peak load.
• DOE says this scale of VPP deployment could save on the order of $10 billion in annual grid costs by avoiding generation buildout, delaying infrastructure investment, and reducing peaker operation.
• DOE also notes that the U.S. grid may need more than 200 GW of new peak capacity by 2030 as demand rises and older fossil assets retire.
• Grand View Research estimated the global VPP market at $6.09 billion in 2025 and projected $30.85 billion by 2033, equal to a 22.6% CAGR from 2026 to 2033.
• Mordor Intelligence estimated the VPP market at $3.94 billion in 2025, $5.01 billion in 2026, and $16.61 billion by 2031, with a 27.08% CAGR over 2026–2031.
• MarketsandMarkets projected the VPP market to rise from $1.9 billion in 2024 to $5.5 billion by 2029, with a 23.4% CAGR.
• Precedence Research calculated a 2025 VPP market size of $6.28 billion and projected $45.67 billion by 2035.
• Fortune Business Insights projected the market from $2.46 billion in 2025 to $7.27 billion by 2034, showing a more conservative growth view than some other market models.
• Market Research Future estimated the VPP market at $1.94 billion in 2024 and projected $40.02 billion by 2035.
• FERC Order No. 2222 was issued to enable distributed energy resource aggregations to participate in regional wholesale electricity markets.
• Battery VPPs are becoming more valuable because they can deliver power quickly and can be measured by both MW and MWh.
• Residential VPP programs increasingly combine home batteries, rooftop solar, smart thermostats, EV chargers, and smart panels.
• Commercial and industrial VPPs often provide larger flexible capacity per site because HVAC, refrigeration, batteries, backup assets, and process loads can be coordinated.
• EV managed charging is emerging as a future VPP resource because charging load can either worsen peak demand or shift into lower-cost hours.
• North America is one of the most policy-driven VPP markets because DOE targets, utility procurement, and wholesale-market reforms are pushing flexible-capacity planning.
• Australia remains one of the strongest real-world VPP examples because South Australia’s program was designed around tens of thousands of homes with solar and batteries.
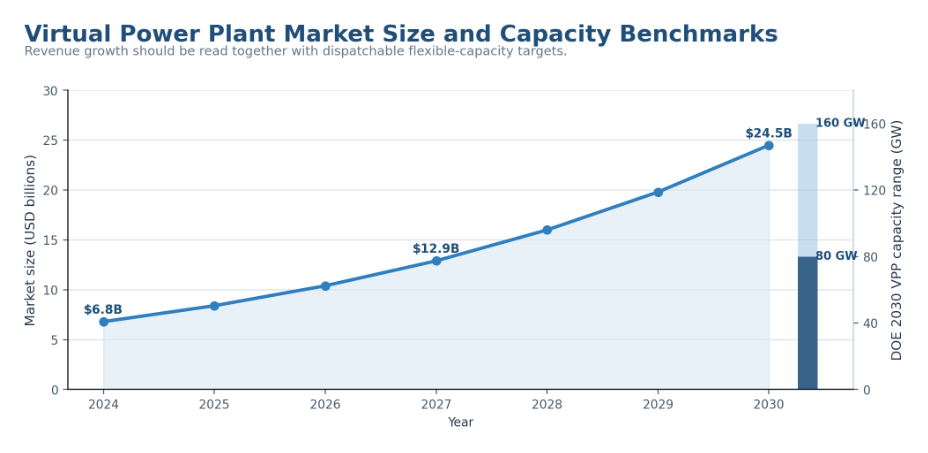
Figure 1. Virtual power plant market size and flexible-capacity benchmarks should be reviewed together because market revenue, grid capacity, and DER participation do not grow at the same pace.
Editorial readout
The headline numbers point to six forces shaping VPP growth: peak-demand pressure, DER adoption, battery deployment, market access, customer participation, and software orchestration. A VPP market review that tracks only revenue will miss the more important question: how much flexible capacity can be trusted, dispatched, verified, and paid for when the grid needs it most.
Why Virtual Power Plants Now Carry Grid-Scale Stakes
VPP statistics matter more when electricity systems face rising demand, renewable variability, slow interconnection, and expensive peak capacity. A VPP can reduce demand, shift load, dispatch batteries, coordinate EV charging, or provide grid services without building a single large power plant. That changes the business case from hardware ownership to flexible capacity performance.
• DOE’s 80–160 GW VPP target by 2030 is framed as roughly tripling current U.S. VPP scale.
• The 80–160 GW target is important because DOE says it could cover 10–20% of peak load.
• VPPs can reduce reliance on expensive peaker plants by lowering demand during tight grid hours.
• Flexible demand is increasingly important because electrification, data centers, heat pumps, and EV charging can raise peak load.
• Batteries improve VPP quality because they can export or absorb power rather than only reduce demand.
• Smart thermostats and connected HVAC systems can provide fast residential load reduction during peak events.
• Commercial buildings can provide flexibility through HVAC, refrigeration, lighting, batteries, and load management.
• EVs can become a controllable load if charging is shifted away from peak periods.
• Wholesale-market access matters because VPP revenue depends on whether aggregated resources can sell energy, capacity, and ancillary services.
• Distribution utility coordination matters because DER aggregations must not create local reliability problems while helping the bulk grid.
| Grid pressure | VPP response | Planning implication |
|---|---|---|
| Peak demand | Dispatch load or batteries | Avoids some peaker use |
| Renewable variability | Absorb or release energy | Improves flexibility |
| Interconnection delays | Use existing DERs | Adds capacity faster |
| Customer DER growth | Aggregate devices | Turns adoption into grid value |
| High infrastructure cost | Delay upgrades | Lowers system cost |
Market context
A virtual power plant is best understood as a capacity and coordination layer. It becomes valuable when thousands or millions of small assets can be forecast, controlled, measured, and settled with enough reliability to support grid operations. The market grows when utilities and grid operators trust that flexibility as much as they trust conventional capacity.
Virtual Power Plant Market Size Statistics
Market-size estimates vary because VPP definitions differ. Some models emphasize software platforms and aggregation services. Others include demand response, distributed generation, energy storage, utility programs, and grid-service revenue. The spread between estimates should not be treated as a contradiction; it shows that VPPs are still an emerging market category with different accounting boundaries.
• Grand View Research estimated the global VPP market at $6.09 billion in 2025 and $7.42 billion in 2026.
• Grand View Research projected the market to reach $30.85 billion by 2033.
• Mordor Intelligence estimated the VPP market at $3.94 billion in 2025 and projected $16.61 billion by 2031.
• MarketsandMarkets projected the market to grow from $1.9 billion in 2024 to $5.5 billion by 2029.
• Precedence Research estimated $6.28 billion in 2025 and projected $45.67 billion by 2035.
• Fortune Business Insights projected $2.46 billion in 2025 and $7.27 billion by 2034.
• Market Research Future estimated $1.94 billion in 2024 and projected $40.02 billion by 2035.
• Future Market Insights projected the market from $5.6 billion in 2025 to $39.5 billion by 2035.
• Global Market Insights estimated $5.5 billion in 2025 and projected $39.5 billion by 2035.
• The range of CAGR estimates commonly falls in the low-20% to low-30% band depending on base year, forecast year, and market definition.
| Market-size signal | What it measures | Planning implication |
|---|---|---|
| Revenue forecast | Software and services | Commercial scale |
| Capacity target | Dispatchable MW/GW | Grid value |
| Customer count | Participating sites | Program reach |
| DER mix | Batteries, EVs, loads | Flexibility quality |
| Market access | Rules and programs | Monetization path |
| Dispatch performance | Delivered capacity | Reliability |
Market interpretation
VPP revenue and VPP capacity should be read separately. A market can have strong DER adoption but weak monetization if rules do not allow aggregation. Another market can have smaller device counts but stronger VPP revenue if utilities procure flexibility and wholesale markets allow participation.
Virtual Power Plant Capacity and Deployment Statistics
Capacity statistics are useful only when they separate enrolled capacity from available capacity and delivered capacity. Enrolled capacity tells a program how large it looks on paper. Available capacity tells operators what can be dispatched at a specific time. Delivered capacity proves whether the resource actually performed during an event.
• DOE’s 80–160 GW target is a capacity benchmark, not a revenue forecast.
• DOE describes this scale as tripling current VPP capacity, which implies a much larger role for customer-sited assets.
• The 10–20% peak-load benchmark shows why VPPs are relevant to resource adequacy planning.
• Demand-response programs provide an installed base for VPP expansion, but many programs still need automation and better verification.
• Battery-based VPPs can offer clearer capacity value because they can inject power, absorb power, and respond quickly.
• Thermostat-based programs can scale quickly but may be constrained by customer comfort and opt-out behavior.
• C&I programs can provide larger site-level capacity but require more careful operating rules.
• EV charging can become a flexible load, but unmanaged charging can increase peak demand.
• Program value depends on event duration because a resource that can respond for 15 minutes is different from one that can sustain output for four hours.
• Capacity credibility improves when telemetry, baselines, settlement, and performance penalties are clearly defined.
| Capacity signal | What to measure | Why it matters |
|---|---|---|
| Enrolled capacity | MW/GW registered | Program scale |
| Available capacity | Dispatchable MW | Reliability value |
| Delivered capacity | Event performance | Real grid impact |
| Duration | Hours available | Separates resource types |
| Response speed | Dispatch timing | Matches grid-service need |
| Opt-out rate | Customer withdrawals | Protects capacity confidence |
Capacity interpretation
A strong VPP scorecard should never stop at enrolled megawatts. The practical question is how much capacity is available under real weather, real customer behaviour, real device status, and real distribution-grid constraints.
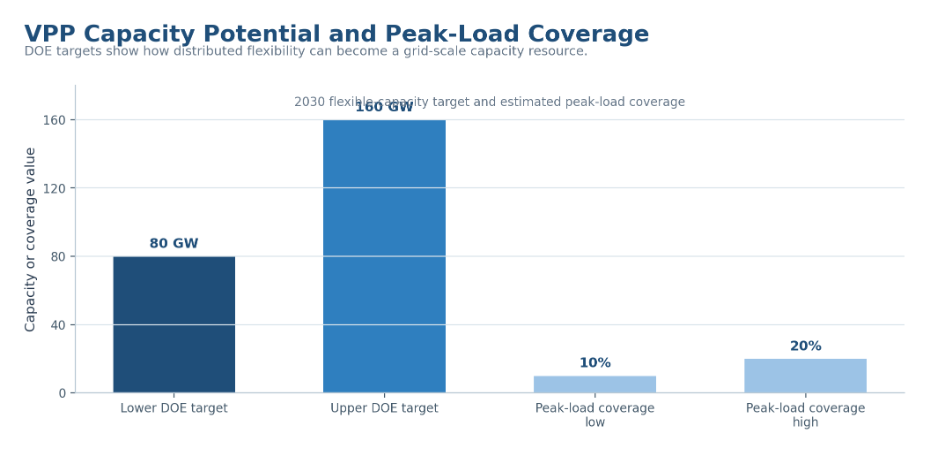
Figure 2. VPP capacity potential should be compared with peak-load growth because the market value depends on when and how flexible resources can be dispatched.
Demand Response and Flexibility Statistics
Demand response is the foundation of the VPP market, but the modern VPP is broader than traditional curtailment. Older programs often asked customers to reduce load during emergencies or high-price periods. Newer VPPs use automation, batteries, device-level telemetry, customer apps, and market settlement to create a more dependable flexibility product.
• Load reduction remains one of the simplest VPP use cases because it lowers demand during high-stress grid hours.
• Load shifting is becoming more important as renewables create midday surplus and evening ramps.
• Automated demand response improves dispatch confidence compared with manual customer action.
• Smart thermostats can reduce cooling or heating load across many homes with short notice.
• Water heaters can act as thermal storage by shifting electricity use without immediately affecting comfort.
• Commercial HVAC systems can reduce or pre-cool load during grid events.
• Industrial loads can provide flexibility when production processes allow controlled interruption or rescheduling.
• Demand response can lower peak load, but the delivered value depends on baselines, customer response, and event fatigue.
• VPP software improves demand-response value by forecasting which assets are available and by optimizing dispatch across many device types.
• A mature flexibility program tracks event performance by segment, not only total portfolio response.
| Flexibility type | Common resource | VPP role |
|---|---|---|
| Load reduction | HVAC, C&I loads | Peak shaving |
| Load shifting | EVs, water heaters | Time shifting |
| Battery dispatch | Home and site batteries | Fast capacity |
| Solar coordination | PV plus storage | Local support |
| Backup resources | Batteries, generators | Resilience |
| Ancillary services | Batteries, inverters | Grid support |
Flexibility readout
The VPP market is moving from demand-response enrollment toward active orchestration. The strongest programs combine load flexibility, batteries, customer incentives, automation, and verification so the grid operator can treat distributed resources as operational assets.
Battery-Based Virtual Power Plant Statistics
Battery VPPs are one of the clearest examples of distributed resources becoming grid-scale capacity. Batteries can discharge during peak demand, charge when prices are low or renewables are abundant, and respond quickly to grid signals. That makes battery VPPs easier to value than many passive demand-response resources.
• South Australia’s VPP was originally designed around 50,000 homes with rooftop solar and Tesla Powerwall batteries.
• The South Australia design was expected to deliver up to 250 MW of solar power and 650 MWh of battery storage when complete.
• Home battery VPPs can provide both customer backup value and grid flexibility value.
• Battery duration matters because a 10 MW one-hour fleet is not equal to a 10 MW four-hour fleet.
• Battery VPPs can respond quickly enough to support services beyond peak shaving in some markets.
• Solar-plus-storage VPPs can reduce evening peak pressure by shifting daytime solar output into later hours.
• Battery cycling rules matter because customer-owned batteries have warranties, degradation limits, and backup-reserve preferences.
• Customer incentives are important because a VPP must compensate households or businesses for sharing battery capacity.
• Aggregator software must protect customer reserve settings while still delivering portfolio-level capacity.
• Battery VPP economics improve when one fleet can serve multiple value streams without double-counting capacity.
| Battery signal | What to compare | Why it matters |
|---|---|---|
| Device count | Number of batteries | Shows scale |
| Power capacity | MW available | Shows dispatch value |
| Energy capacity | MWh available | Shows duration |
| Response time | Seconds/minutes | Supports grid services |
| Customer incentive | Monthly or event payment | Drives enrollment |
| Reserve setting | Backup threshold | Protects trust |
Battery interpretation
Battery VPPs should be measured by MW, MWh, response time, customer rules, and revenue stack. A portfolio that looks large in device count may deliver limited capacity if batteries are reserved for backup, already discharged, or unavailable during the needed event window.
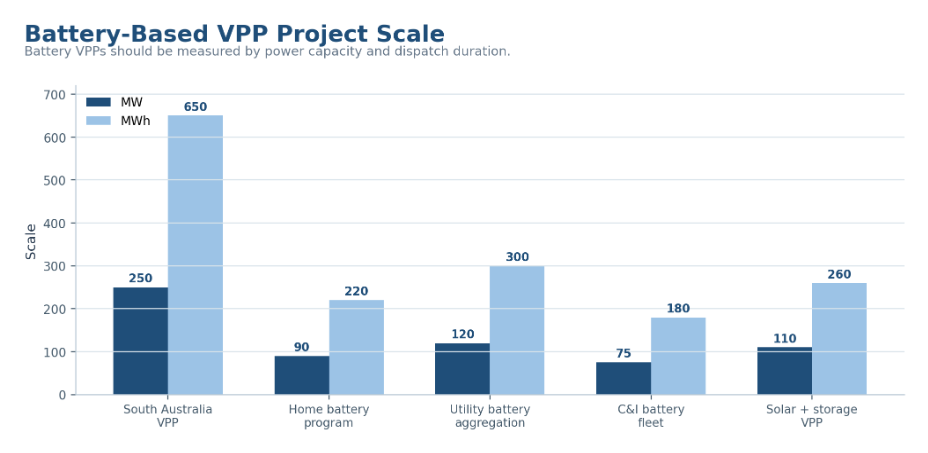
Figure 3. Battery-based VPPs should be measured by both MW and MWh because grid value depends on power capacity and dispatch duration.
Residential Virtual Power Plant Statistics
Residential VPPs turn households into flexible grid resources. The customer does not need to think like a power trader. The program works when the device is enrolled, the incentive is clear, the automation is reliable, and the customer retains enough control to trust the program.
• Residential VPP resources commonly include home batteries, rooftop solar, smart thermostats, EV chargers, water heaters, and smart panels.
• Home batteries provide stronger dispatch value when paired with rooftop solar and clear backup-reserve controls.
• Smart thermostats scale quickly because HVAC load is common and can be adjusted in small increments.
• Residential EV charging is important because a single home charger can create meaningful load during evening hours.
• Water heaters can provide low-visibility flexibility because heat can be stored before electricity demand peaks.
• Customer trust is a key metric because opt-outs reduce dependable capacity during events.
• Program simplicity matters because households are more likely to join when incentives, control rules, and comfort limits are easy to understand.
• Residential VPPs often require a retailer, utility, aggregator, device manufacturer, or software platform to coordinate enrollment and dispatch.
• The strongest residential scorecard measures active devices, available capacity, event participation, opt-out rate, and customer compensation.
• A residential VPP can grow quickly in markets with high rooftop solar penetration, high electricity prices, reliability concerns, and battery incentives.
| Residential resource | VPP value | Main constraint |
|---|---|---|
| Home batteries | Dispatch and backup | Cost and warranty |
| Thermostats | Fast load control | Comfort limits |
| EV chargers | Flexible charging | Driver schedule |
| Water heaters | Thermal storage | Device access |
| Rooftop solar | Local generation | Midday output |
| Smart panels | Whole-home control | Hardware adoption |
Residential readout
Residential VPPs are not only a device problem. They are a customer-experience problem. The market scales when enrollment is simple, incentives are visible, comfort is protected, and participants believe the program will not leave them without backup power when they need it.
Commercial and Industrial VPP Statistics
Commercial and industrial VPPs can deliver larger chunks of flexibility from fewer sites. A supermarket, warehouse, office campus, data center, factory, cold-storage facility, or logistics hub may provide more controllable load than hundreds of homes. But C&I flexibility requires careful contract design because business operations cannot be disrupted casually.
• Commercial HVAC systems can reduce peak demand when buildings are pre-cooled or controlled within comfort ranges.
• Cold storage and refrigeration can shift some load when temperature bands allow safe operation.
• Commercial batteries can reduce demand charges and provide grid services when connected to a VPP platform.
• Industrial loads can provide high-value flexibility if production schedules and process constraints allow it.
• Data centers may become important flexibility customers, but reliability and uptime requirements are strict.
• EV fleets can offer managed charging potential because vehicles may have predictable depot schedules.
• Microgrids can behave like VPP assets when they coordinate generation, storage, and controllable load.
• C&I VPP contracts often need performance terms, baseline rules, payment formulas, and operational limits.
• Site-level metering and telemetry are critical because commercial participants usually require accurate settlement.
• C&I VPP value is strongest when flexibility revenue adds to bill savings, resilience, or sustainability goals.
| C&I resource | Flexibility value | Main metric |
|---|---|---|
| HVAC systems | Load reduction | kW curtailed |
| Refrigeration | Thermal flexibility | Event duration |
| Batteries | Peak and grid services | MW/MWh |
| Backup systems | Resilience capacity | Availability |
| EV fleets | Managed charging | Charging schedule |
| Microgrids | Local reliability | Island capability |
C&I interpretation
C&I VPPs should be evaluated through operational risk as much as capacity. A strong program gives businesses clear control boundaries, predictable payments, reliable automation, and confidence that energy flexibility will not interfere with core operations.
EVs and Managed Charging VPP Statistics
Electric vehicles are a future VPP resource and a future grid challenge. If charging is unmanaged, EV adoption can increase evening peaks. If charging is coordinated, the same vehicles can become a flexible load pool that shifts demand, follows prices, supports renewables, and eventually provides vehicle-to-grid services where allowed.
• Managed charging shifts EV charging away from peak hours without necessarily sending power back to the grid.
• Smart charging can respond to time-of-use rates, grid signals, carbon intensity, or wholesale prices.
• Vehicle-to-grid programs can turn parked EVs into export-capable resources, but battery warranties and customer behavior remain constraints.
• Fleet charging is often easier to manage than scattered residential charging because schedules and locations are more predictable.
• Home charging can be valuable when a utility can control or influence overnight charging windows.
• Workplace charging can shift demand into solar-heavy daytime periods in some markets.
• EV charging flexibility depends on dwell time, driver needs, charger connectivity, and customer permission.
• The VPP market opportunity grows as EV adoption expands and more chargers become networked.
• EVs should be modeled as flexible load first and export-capable assets second, because V2G rules are still developing in many markets.
• Managed charging can reduce infrastructure stress when it lowers coincident peak demand across a feeder or service territory.
| EV model | What it does | Market implication |
|---|---|---|
| Managed charging | Shifts charging time | Reduces peak load |
| Smart charging | Responds to signals | Supports tariffs |
| V2G | Exports power | Adds capacity |
| Fleet charging | Coordinates vehicles | Creates controllable load |
| Home charging | Controls overnight load | Improves flexibility |
EV readout
They become one when chargers are connected, customer rules are clear, charging windows are flexible, and market or utility programs reward load shifting. The same charging demand can be a grid problem or a grid asset depending on coordination.
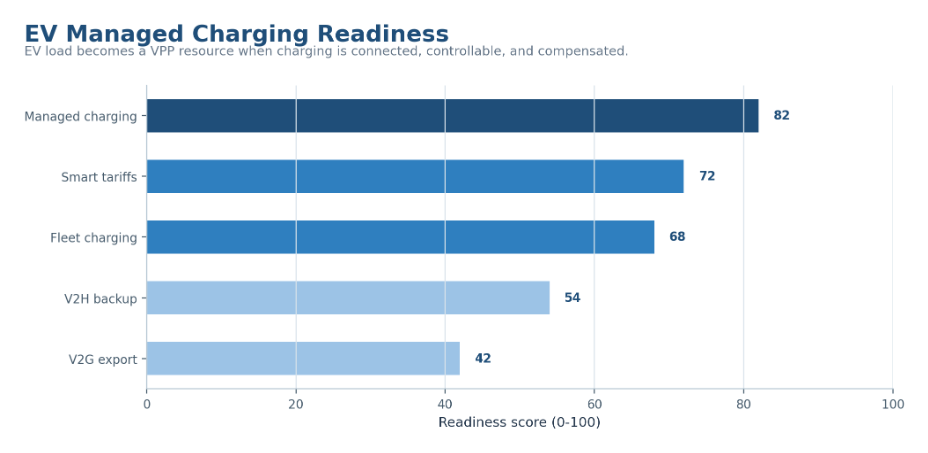
Figure 4. EV-managed charging should be treated as a future VPP resource because vehicle load can either raise peaks or provide flexible capacity.
Virtual Power Plant Software and Platform Statistics
A VPP is not only a portfolio of devices. It is also a software platform that forecasts availability, controls dispatch, tracks performance, verifies delivery, settles payments, and protects customer preferences. Without the platform layer, distributed assets remain scattered devices rather than a market-ready capacity resource.
• Forecasting is needed because VPP capacity changes with weather, customer behavior, battery state of charge, and device availability.
• Optimization software decides which assets to dispatch while protecting comfort, battery reserve, and contract constraints.
• Telemetry proves whether resources responded during events and supports settlement.
• Device integration is critical because VPPs must connect batteries, thermostats, EV chargers, inverters, meters, and building systems.
• Customer apps improve enrollment, participation, preference management, and incentive visibility.
• DERMS platforms help utilities coordinate distributed assets with distribution-grid needs.
• Cybersecurity becomes more important as VPPs control more grid-connected devices.
• Settlement accuracy matters because customers, aggregators, and market operators need confidence in payments.
• Software maturity is one reason a VPP can scale beyond a pilot into a repeatable utility resource.
• The best platforms support forecasting, dispatch, verification, settlement, customer controls, and regulatory reporting in one operating model.
| Software capability | Market role | Why it matters |
|---|---|---|
| Forecasting | Predicts flexibility | Improves dispatch |
| Optimization | Selects resources | Protects customers |
| Telemetry | Tracks performance | Supports settlement |
| Integration | Connects DERs | Expands pool |
| Customer app | Manages participation | Builds trust |
| Cybersecurity | Protects assets | Reduces risk |
Platform interpretation
The platform layer turns a VPP from a customer program into a grid product. The software must know what is available, what can be safely dispatched, what was delivered, and how value should be paid to participants.
Regional Virtual Power Plant Market Intelligence
Regional data is one of the highest-value parts of a VPP statistics report. Global market-size averages hide major differences in rules, DER adoption, battery penetration, rooftop solar, utility procurement, wholesale markets, and customer incentives.
North America
• The United States is one of the most important VPP markets because DOE has quantified an 80–160 GW deployment opportunity by 2030.
• FERC Order No. 2222 supports DER aggregation participation in organized wholesale markets, although implementation varies by grid operator.
• U.S. VPP growth is tied to peak-demand pressure, extreme weather, capacity needs, utility programs, batteries, smart thermostats, and EV charging.
• Canada’s VPP opportunity is smaller but connected to utility flexibility programs, winter peak management, and distributed storage pilots.
Europe
• Europe has strong VPP potential because flexibility markets, residential batteries, heat pumps, smart meters, and renewable integration are expanding.
• Germany is important because residential solar and battery adoption create a large base of controllable distributed storage.
• The United Kingdom is a key flexibility-market example because distributed resources can participate in balancing and local flexibility services.
• The Netherlands, France, Italy, and Nordic markets each have different flexibility needs depending on renewable penetration, grid congestion, and retail-market rules.
Asia-Pacific
• Australia is one of the strongest VPP demonstration markets because rooftop solar penetration and home battery programs create practical aggregation opportunities.
• South Australia’s VPP shows how many residential batteries can be combined into a grid-support resource.
• Japan’s VPP opportunity is tied to resilience, demand response, batteries, and distributed energy management.
• China and India represent large future markets, but VPP growth depends on market rules, smart-grid capability, and aggregation models.
Latin America, Middle East, and Africa
• Latin America has growing VPP potential where distributed solar, storage, and grid constraints create flexibility needs.
• Brazil and Chile are important future markets because renewable growth and distributed energy adoption can support aggregation.
• Middle East markets may use VPP concepts around solar, batteries, cooling load, and smart-grid development.
• South Africa’s reliability challenges create a different type of opportunity around backup systems, storage, microgrids, and dispatchable distributed assets.
| Region | VPP market implication | Primary signal |
|---|---|---|
| North America | Policy and peak pressure | DOE target and Order 2222 |
| Europe | Flexibility-market growth | Batteries and aggregation |
| Asia-Pacific | Australia leads pilots | Solar and home storage |
| Latin America | Future flexibility need | Distributed solar growth |
| Middle East & Africa | Reliability and microgrids | Storage and backup assets |
Regional interpretation
Regional VPP readiness should be measured by more than market size. The useful scorecard compares DER adoption, customer incentives, market rules, utility procurement, software capability, grid congestion, and the practical need for flexible capacity.
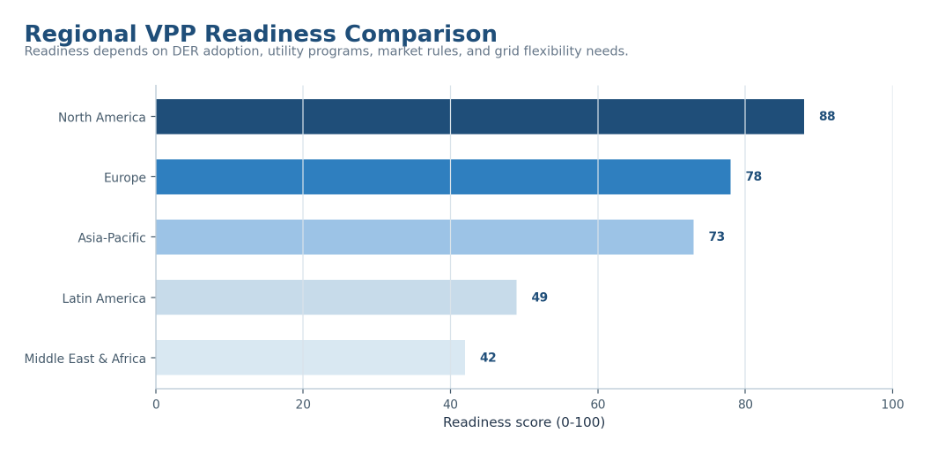
Figure 5. Regional VPP readiness should be measured by DER adoption, market rules, utility programs, and grid-flexibility needs rather than market size alone.
Country-Level Virtual Power Plant Statistics
Country-level VPP analysis should separate readiness from revenue. A country may have many rooftop solar systems, batteries, EVs, or smart devices, but VPP monetization depends on rules, metering, settlement, utility procurement, and customer participation.
| Country | VPP readiness signal | Market implication |
|---|---|---|
| United States | DOE target and market rules | Scale opportunity |
| Australia | Home battery VPP pilots | Deployment leader |
| Germany | Residential batteries | Europe battery hub |
| United Kingdom | Flexibility markets | Market-design leader |
| Japan | Resilience and demand response | Reliability market |
| China | Demand-side scale | Large future market |
| India | Emerging flexibility needs | Early-stage growth |
| Canada | Utility pilots | Regional opportunity |
| Brazil | Distributed solar growth | Future VPP base |
| South Africa | Backup and storage need | Reliability-driven opportunity |
Country readout
The strongest country analysis separates three questions: are flexible resources available, can they be aggregated, and can they be paid for performance? A market with strong DER adoption but weak participation rules may have high technical potential and low near-term revenue.
Virtual Power Plant Revenue and Business Model Statistics
VPP monetization is not one revenue stream. A VPP can be paid for capacity, demand response, energy arbitrage, ancillary services, demand-charge reduction, utility programs, resilience, or software fees. The right model depends on who owns the device, who controls dispatch, who pays the customer, and what market rules allow.
• Capacity payments reward dependable availability during peak periods.
• Demand-response payments reward load reduction or load shifting during events.
• Energy arbitrage rewards batteries that charge when prices are low and discharge when prices are high.
• Ancillary-service revenue can reward fast response from batteries or inverter-based resources.
• Utility programs may pay aggregators and customers for avoided peak demand or deferred infrastructure.
• C&I customers may receive value through demand-charge management in addition to grid-service revenue.
• Residential participants often need clear bill credits, monthly payments, upfront rebates, or event-based incentives.
• Software providers may monetize VPPs through subscriptions, platform fees, performance fees, or managed-service contracts.
• Aggregator margins depend on customer incentives, device costs, software costs, performance penalties, and market revenue.
• The most durable VPP business models avoid relying on a single revenue stream.
| Revenue stream | Who earns it | Value driver |
|---|---|---|
| Capacity payments | Aggregators and customers | Reliable availability |
| Energy arbitrage | Battery owners | Price spreads |
| Ancillary services | Batteries and inverters | Fast response |
| Utility programs | Customers and aggregators | Peak reduction |
| Demand charge savings | C&I customers | Load management |
| Software fees | Platform providers | Program scale |
Revenue interpretation
Revenue quality matters more than gross revenue. A VPP may generate strong market payments but still perform poorly if customer incentives are too high, software costs are rising, event performance is weak, or battery warranty concerns limit dispatch.
Virtual Power Plant Challenges and Risk Statistics
VPP growth is strong, but the market is not risk-free. Aggregating thousands of small assets creates different operational challenges than building one power plant. Customer behavior, device compatibility, local grid constraints, settlement accuracy, cybersecurity, regulation, and verification all affect market quality.
• Customer opt-outs reduce dependable capacity during events.
• Device interoperability limits scale when batteries, thermostats, chargers, and building systems cannot be integrated easily.
• Dispatch reliability depends on connectivity, device status, customer preferences, and weather conditions.
• Baseline design affects payments because demand-response performance is measured against expected usage.
• Battery warranty and cycling rules can limit how aggressively a VPP dispatches customer-owned batteries.
• Distribution-grid constraints can prevent aggregated DERs from being dispatched even when the bulk system needs capacity.
• Cybersecurity risk rises when more grid-connected devices are remotely controlled.
• Privacy concerns can slow enrollment if customers do not understand what data is collected.
• Settlement errors damage trust because customers and aggregators need accurate compensation.
• Regulatory delays can slow VPP growth even when the technology is ready.
| Risk signal | Core metric | Why it matters |
|---|---|---|
| Customer opt-out | Event participation | Reduces capacity |
| Device failure | Dispatch success | Affects reliability |
| Interoperability | Supported devices | Limits scale |
| Settlement errors | Payment accuracy | Affects trust |
| Cybersecurity | Incident rate | Protects operations |
| Battery cycling | Cycle count | Protects economics |
| Regulatory delay | Market timeline | Slows revenue |
Risk interpretation
VPPs avoid some traditional infrastructure costs, but they create coordination risk across many assets. The strongest programs treat verification, cybersecurity, customer control, and distribution-grid coordination as core market infrastructure, not as afterthoughts.
Virtual Power Plant Forecasts to 2030 and Beyond
VPP forecasts are useful when they explain both growth and constraints. Market revenue is expected to expand, but the quality of growth will depend on dispatchable capacity, utility procurement, wholesale-market access, customer incentives, and whether DER adoption translates into verified grid services.
• DOE’s 2030 target of 80–160 GW creates one of the clearest capacity benchmarks for the U.S. VPP market.
• Grand View Research projected the global market to reach $30.85 billion by 2033.
• Precedence Research projected the market to reach $45.67 billion by 2035.
• Market Research Future projected the market to reach $40.02 billion by 2035.
• Future Market Insights projected $39.5 billion by 2035.
• Battery VPPs are likely to become more important as home storage, commercial storage, and grid-scale storage grow.
• EV managed charging is likely to become a larger VPP resource as networked chargers and fleet electrification expand.
• Utilities are likely to procure more flexible capacity where peak demand, reliability risk, and infrastructure costs rise.
• Regulatory implementation will remain uneven because wholesale, retail, and distribution rules differ by market.
• By 2030, the strongest VPP markets will likely be those that combine high DER adoption with clear compensation and trusted dispatch performance.
| Market area | Expected direction | Planning implication |
|---|---|---|
| VPP capacity | Strong growth | Flexibility mainstreams |
| Batteries | More aggregation | Dispatch quality improves |
| EV charging | Major future load | Managed charging matters |
| Software | More advanced | Forecasting is critical |
| Regulation | Gradual opening | Access remains uneven |
| Utilities | More procurement | VPPs compete with peakers |
Outlook readout
The next phase of VPP growth will be judged less by pilot announcements and more by repeatable performance. Markets will need to prove that distributed capacity can be enrolled, dispatched, verified, settled, and trusted during the grid hours when it matters most.
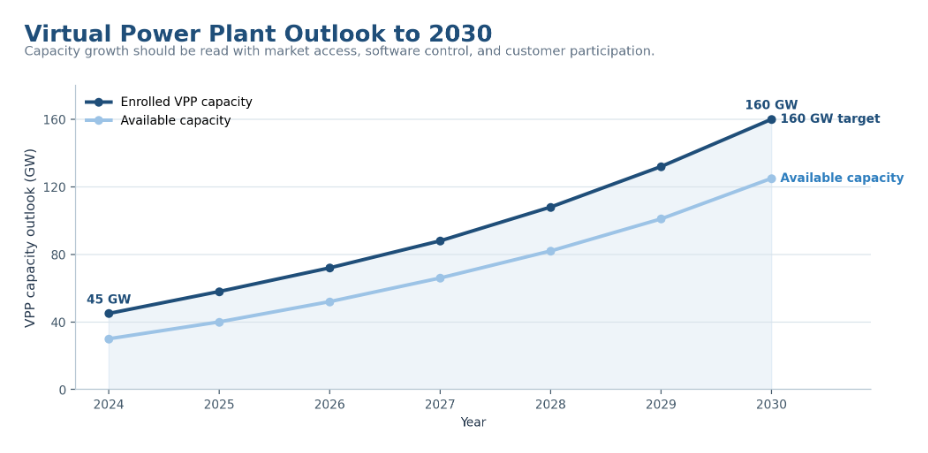
Figure 6. VPP market forecasts should be read with grid-flexibility needs because revenue growth depends on regulation, DER adoption, and dispatchable capacity.
Virtual Power Plant Market Diagnostic
A useful VPP benchmark should help teams decide where to look next. The diagnostic model below connects statistics to action, so the article works as a market scorecard rather than a long list of figures.
| Problem area | Core signals to measure | Useful benchmark |
|---|---|---|
| Market demand | Peak load and DER adoption | DOE 2030 target |
| Customer participation | Enrollment and opt-outs | Active device count |
| Dispatch quality | Delivered MW and events | Available vs enrolled |
| Software maturity | Forecasting and telemetry | Dispatch accuracy |
| Revenue quality | Payments and incentives | Net VPP margin |
| Regulatory access | Market rules | Order 2222 and local rules |
| Risk control | Cybersecurity and verification | Program reliability |
Diagnostic readout
This model keeps the article from becoming a stat dump. Each metric belongs to a market question: is the VPP large, available, dispatchable, trusted, monetized, regulator-ready, and reliable enough to compete with conventional capacity?
90-Day Virtual Power Plant Benchmark Plan
Statistics become useful when they are translated into a measurement plan. A practical VPP market review can be organized into a 90-day cycle rather than a vague monitoring project.
| Timing | What to do | Output |
|---|---|---|
| Days 1–30 | Build baseline by region, capacity, DER mix, customers, and rules | Map of VPP readiness |
| Days 31–60 | Compare market size, utility programs, platforms, and revenue | Priority markets and use cases |
| Days 61–90 | Review dispatch performance, risk, incentives, and forecasts | Repeatable VPP scorecard |
Planning principle
The best VPP teams do not chase every benchmark. They compare external statistics against grid need, customer participation, market access, dispatch performance, and net revenue.
Metrics Virtual Power Plant Leaders Should Track
The final scorecard should be detailed enough to locate the signal without becoming a vanity dashboard. These metrics connect program scale, dispatch quality, customer trust, software maturity, revenue, and risk.
| Metric | Why it matters |
|---|---|
| Enrolled capacity | Program scale |
| Available capacity | Dependable flexibility |
| Delivered capacity | Event performance |
| Customer count | Participation depth |
| Device count | Aggregation scale |
| DER mix | Flexibility quality |
| Event duration | Grid-service fit |
| Dispatch success rate | Reliability |
| Opt-out rate | Customer trust |
| Incentive cost | Participation economics |
| Grid-service revenue | Monetization |
| Net program margin | Business quality |
| Forecast accuracy | Software maturity |
| Settlement accuracy | Market trust |
| Cybersecurity compliance | Operational readiness |
Virtual Power Plant Market Statistics FAQ
What is a virtual power plant?
A virtual power plant is a coordinated network of distributed energy resources that can be operated together as a flexible grid resource. It may include batteries, EV chargers, smart thermostats, rooftop solar, commercial loads, and other controllable assets.
How big is the virtual power plant market?
Market estimates vary by source. Grand View Research estimated $6.09 billion in 2025 and projected $30.85 billion by 2033, while Precedence Research estimated $6.28 billion in 2025 and projected $45.67 billion by 2035.
How much VPP capacity could the United States deploy by 2030?
DOE says 80–160 GW of VPP deployment by 2030 could address 10–20% of U.S. peak load and save on the order of $10 billion in annual grid costs.
What resources are used in virtual power plants?
Common VPP resources include home batteries, commercial batteries, smart thermostats, EV chargers, rooftop solar, water heaters, HVAC systems, industrial loads, and microgrids.
Why are batteries important for VPPs?
Batteries are important because they provide dispatchable power, fast response, and measurable duration. A battery VPP should be measured by both MW and MWh.
How do EVs fit into VPPs?
EVs fit into VPPs through managed charging, smart charging, fleet charging, and eventually vehicle-to-grid services where rules and customer agreements allow it.
What is FERC Order No. 2222?
FERC Order No. 2222 is a U.S. regulatory order intended to enable distributed energy resource aggregations to participate in regional wholesale electricity markets.
What are the biggest risks for VPPs?
The biggest risks are customer opt-outs, device interoperability, dispatch failure, settlement errors, cybersecurity, battery cycling concerns, distribution-grid constraints, and regulatory delays.
Which metrics matter most?
The most useful VPP scorecard combines enrolled capacity, available capacity, delivered capacity, device count, opt-out rate, dispatch success, revenue, settlement accuracy, and cybersecurity readiness.
Final Takeaway
Virtual power plant market statistics point to one conclusion: the market is moving from pilots and demand-response programs toward grid-scale flexible capacity. The headline revenue forecasts are strong, but the more important signal is operational. VPPs are valuable when they can reduce peak demand, dispatch batteries, coordinate EV charging, support renewables, and provide reliable capacity without requiring the same buildout timeline as conventional generation.
The strongest analysis separates enrolled devices from available capacity and delivered performance. A program with thousands of devices is not automatically a dependable power plant. The practical test is whether the portfolio can forecast available flexibility, dispatch the right assets, respect customer limits, verify delivery, settle payments accurately, and repeat that performance across events.
For utilities, aggregators, software providers, investors, and policy teams, the goal is a VPP market that is scalable, automated, customer-friendly, regulator-ready, and trusted enough to compete with conventional capacity. The next stage of growth will not be defined only by how many customers enroll. It will be defined by how much flexible capacity is available, how often it performs, and how clearly the market pays for that performance.