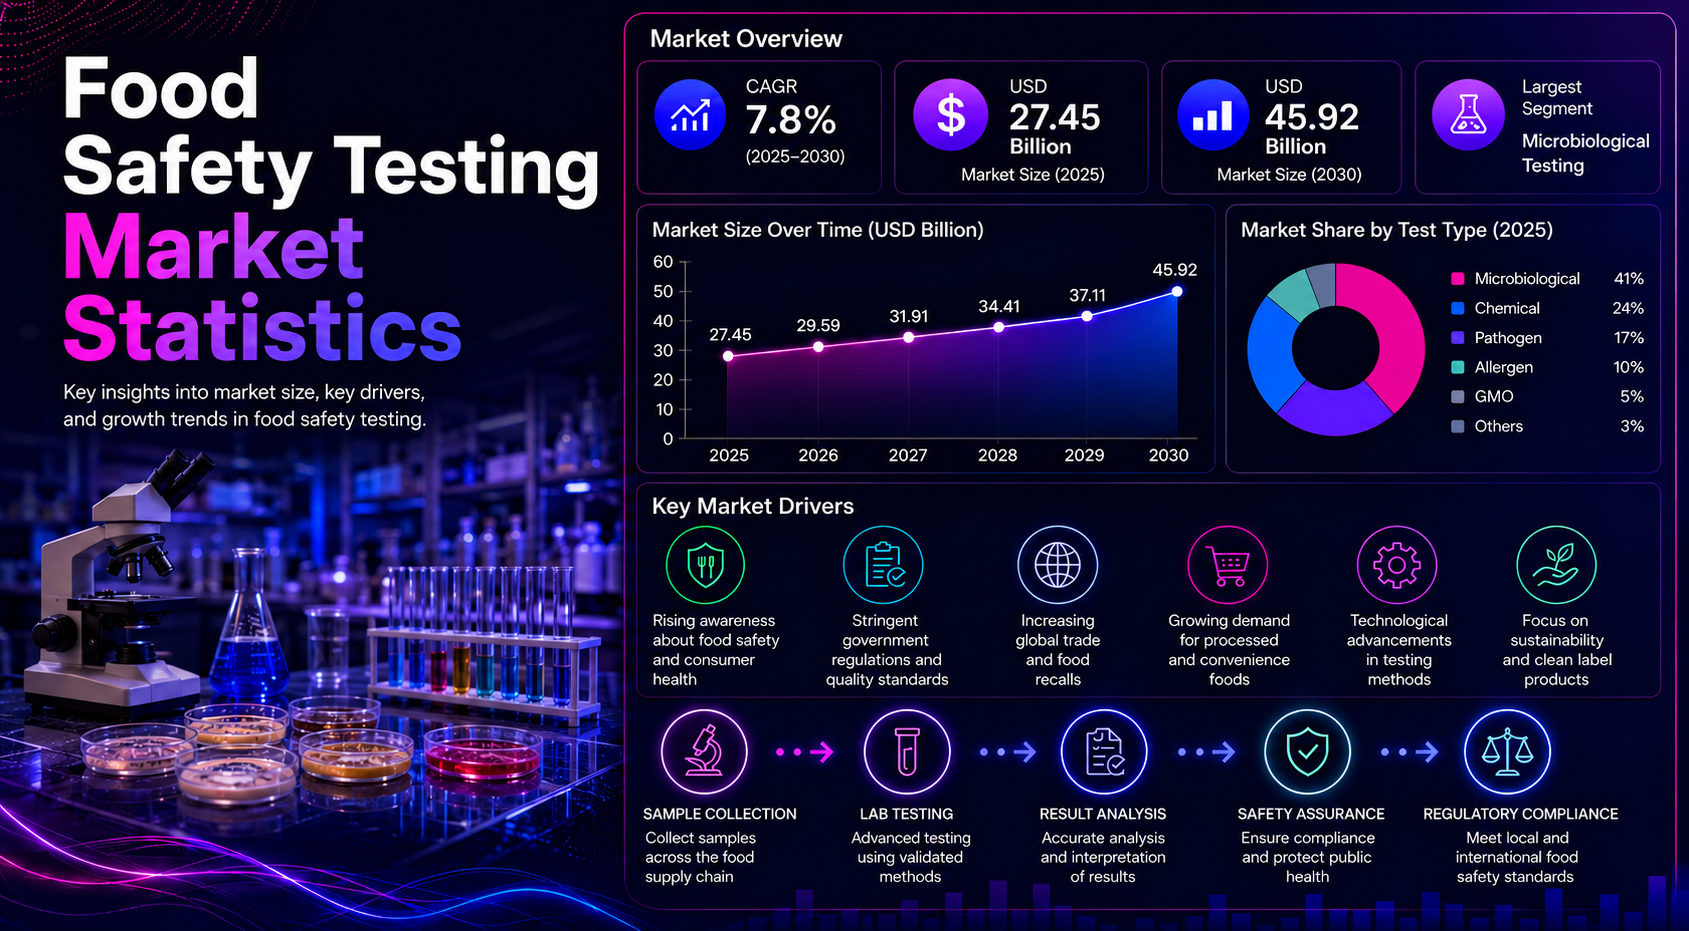
Food safety testing is now a core operating layer across the global food chain. Demand is shaped by pathogen control, allergen management, residue monitoring, import compliance, brand protection, and faster release decisions across manufacturing and retail networks. The global food safety testing market was estimated at USD 26.27 billion in 2025 and is forecast to reach USD 48.01 billion by 2033, supported by a 7.8% CAGR from 2026 to 2033.
The commercial importance of this market comes from the frequency of the decisions it supports. Testing can determine whether an ingredient is accepted, whether a production lot is released, whether an exporter can document compliance, and whether a retailer keeps a supplier approved. Those decisions occur repeatedly across production cycles, so demand is not limited to major outbreaks or recall events. The market expands as more companies formalize verification at incoming-material, in-process, environmental, finished-product, and shipment stages. This broader use of testing creates a more durable revenue base than a market driven only by emergency response.
The market is also becoming more connected across functions. Laboratory results increasingly influence procurement, quality assurance, regulatory affairs, operations, logistics, and brand-risk management at the same time. A failed result may trigger supplier investigation, additional sampling, inventory holds, corrective action, or customer notification, while a clean result can support faster release and smoother trade documentation. This cross-functional role helps explain why food safety testing grows alongside regulation and technology: the value of a test is measured not only by analytical accuracy, but also by how effectively it supports a timely and defensible business decision.
Public-health pressure gives the market a durable base. WHO reported more than 866 million foodborne illness cases in 2021, while CDC estimates that 48 million Americans get sick from foodborne illness each year. These figures explain why food safety testing is treated as a business-critical function rather than a narrow laboratory service.
The clearest market view starts with global value, then moves into segment performance, food categories, regional leadership, country opportunity, technology shifts, and regulatory monitoring. This order keeps the data useful and prevents the market from becoming a list of disconnected numbers.
The result is a market that combines routine verification with high-consequence risk management. A company may perform testing every day even when no incident is visible because release decisions, supplier approval, retailer requirements, and export access depend on documented evidence. This recurring use pattern is important for the market outlook: growth is supported not only by new laboratories or new methods, but also by deeper testing coverage inside existing food production and distribution systems.
Executive Food Safety Testing Market Benchmarks
The headline numbers show a market with stable regulatory demand and a clear growth path. Food companies, laboratories, retailers, exporters, and governments are investing because risk is now measured across more products, pathogens, trade routes, and compliance systems.
- The global food safety testing market was estimated at USD 26.27 billion in 2025.
- The market is forecast to reach USD 48.01 billion by 2033.
- The expected market CAGR stands at 7.8% from 2026 to 2033.
- Europe held the largest revenue share at 34.1% in 2025.
- Microbiological testing accounted for 28.9% of global revenue in 2025.
- Traditional testing methods accounted for 55.3% of revenue in 2025.
- The rapid food safety testing market is projected to grow from USD 19.66 billion in 2025 to USD 31.22 billion by 2030.
- The 2025 benchmark of USD 26.27 billion gives the market a current baseline, while the 2033 forecast of USD 48.01 billion shows how much value can be added as testing expands across pathogens, residues, allergens, and export compliance.
- The benchmark separates volume pressure from value pressure. More tests are being run because supply chains are larger and more complex, while revenue also rises as tests become more specialized. Molecular methods, rapid screening, contaminant panels, and documentation-heavy workflows can carry higher value than basic checks.
- Food safety testing increasingly behaves like an infrastructure market. Manufacturers expanding into new countries, retailers tightening supplier standards, and regulators increasing monitoring all create repeatable testing demand rather than one-time spikes.
- The executive benchmarks clarify the market hierarchy. Market size explains scale, CAGR explains pace, regional share explains geography, and segment share shows where testing demand concentrates. Together, these measures create a clearer view than any single statistic.
- The market story then becomes more specific through forecast, regional, country-level, testing-type, and regulatory indicators that explain where demand is concentrated.
The benchmark set also shows why no single number can describe the market on its own. The global value of USD 26.27 billion in 2025 establishes scale, while the USD 48.01 billion forecast for 2033 defines the longer growth path. Europe’s 34.1% share explains where revenue is concentrated today, microbiological testing’s 28.9% share identifies the core test family, and the 55.3% traditional-method share shows that established laboratory workflows still carry substantial commercial weight. Rapid testing adds a second layer because it changes the timing of decisions without eliminating the need for validated confirmation.
Table 1. Executive Food Safety Testing Market Benchmarks
| Metric | Value | Period | Meaning |
|---|---|---|---|
| Global market size | USD 26.27 billion | 2025 | Revenue base |
| Global forecast | USD 48.01 billion | 2033 | 2033 target |
| Global CAGR | 7.8% | 2026-2033 | Growth pace |
| Europe share | 34.1% | 2025 | Lead region |
| Microbiological testing | 28.9% | 2025 | Test leader |
| Traditional methods | 55.3% | 2025 | Base method |
| Rapid testing forecast | USD 31.22 billion | 2030 | Rapid shift |
Market readout:
Food safety testing demand is being shaped by three forces at once: stricter regulation, higher foodborne illness visibility, and faster global food movement.
Food Safety Testing Market Size and Forecast
Market-size estimates differ across sources because the food safety testing category can be defined narrowly or broadly. Some values focus on laboratory testing services, while others include rapid testing kits, technology-enabled platforms, outsourced testing, and specialized method categories. These differences should be read as scope variation rather than contradiction.
A useful benchmark range shows the market moving from USD 21.1 billion in 2022 to USD 24.0 billion in 2024, then into a stronger path during the late 2020s.
The 2025 estimate of USD 26.27 billion and the 2033 forecast of USD 48.01 billion show that testing frequency, product coverage, regulatory scrutiny, and rapid method adoption are rising together.
Forecast variation is especially useful when it reveals the boundaries of the category. A services-only model can produce a lower total than a model that also captures kits, instruments, outsourced verification, molecular workflows, or digital testing infrastructure. The correct interpretation is therefore not to force every estimate into one midpoint, but to use each forecast for the part of the market it actually represents. This keeps the global trend credible while allowing the article to compare different commercial layers without double counting them.
The long-term direction remains consistent across the available benchmarks: testing expands as food chains become more formal, more international, and more data intensive. Growth also comes from greater testing depth inside established categories. A producer that once relied mainly on finished-product checks may add environmental monitoring, supplier verification, allergen controls, residue testing, and rapid screening at earlier points in production. This increases the number of testing decisions made per product cycle and supports recurring revenue even when overall food production grows more slowly than the testing market.
Food safety testing demand is recurring because testing is tied to batch release, audit readiness, retailer approval, export documentation, and safety verification. Demand is also spreading across a wider mix of food categories, from animal proteins and fresh produce to infant foods, bakery, beverages, cereals, sauces, supplements, and imported specialty products.
The market is becoming more data-driven as laboratories, manufacturers, and regulators use historical results to identify higher-risk suppliers, ingredients, regions, and product types. A 7.8% growth path therefore reflects structural demand from broader product coverage, faster methods, cross-border trade, and more documented safety decisions.
Table 2. Food Safety Testing Market Size Forecast Comparison
| Benchmark | Base value | Forecast value | CAGR | Interpretation |
|---|---|---|---|---|
| Markets and Markets | USD 21.1 billion in 2022 | USD 31.1 billion by 2027 | 8.1% | Mid-term view |
| Research and Markets | USD 24.0 billion in 2024 | USD 35.0 billion by 2030 | 6.5% | Conservative |
| Grand View Research | USD 26.27 billion in 2025 | USD 48.01 billion by 2033 | 7.8% | Benchmark |
| Precedence Research | USD 26.90 billion in 2025 | USD 51.88 billion by 2034 | 7.59% | Long view |
| Technavio | 2024 base | USD 15.38 billion incremental growth by 2029 | 9.0% | High growth |
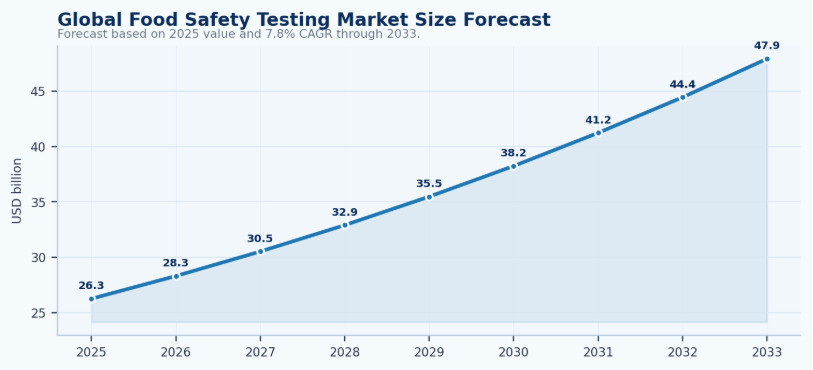
Figure 1. Global food safety testing market forecast from 2025 to 2033.
Market readout:
Forecast differences are normal because some models count only testing services while others include broader rapid testing and technology-enabled safety verification.
Why Food Safety Testing Demand Is Rising
Food safety testing demand is rising because the cost of failure is visible across public health, recalls, trade restrictions, retailer audits, and consumer trust. Testing is no longer a back-end compliance task; it is part of production release, supplier approval, import screening, export documentation, and brand-risk management.
WHO reported more than 866 million foodborne illness cases and 1.52 million deaths from foodborne illnesses in 2021.
In the United States, CDC estimates 48 million illnesses, 128,000 hospitalizations, and 3,000 deaths from foodborne illness each year. These public-health figures create the social and regulatory foundation for routine testing demand.
Regulation adds another layer. EU Alert and Cooperation Network activity reached 9,460 notifications in 2024, up 8% from the prior year. This level of monitoring reinforces the need for documented testing, faster confirmation, and stronger traceability.
Public-health data and alert-system activity also explain why testing demand is resilient across economic cycles. Food companies can postpone some discretionary investments, but pathogen control, allergen verification, residue monitoring, and regulatory evidence are harder to defer because they are connected to product release and market access. The larger the potential consequence of failure, the more likely testing remains embedded in routine operating budgets rather than treated as a temporary project.
Risk visibility also changes behavior before a recall occurs. When regulators publish more alerts and retailers strengthen supplier requirements, companies tend to move verification earlier in the supply chain. Incoming ingredients may be screened more frequently, high-risk suppliers may face tighter sampling plans, and ready-to-eat or export products may receive additional confirmation. These changes do not always appear as a single dramatic statistic, but together they raise testing frequency and create a broader base of repeat demand for laboratories, kits, instruments, and quality systems.
Foodborne illness, recalls, and regulatory alerts explain why testing budgets remain protected even when other operating costs are under pressure. A contamination or allergen event can affect factories, suppliers, logistics networks, retailers, and brand reputation at the same time.
Cross-border food movement adds another layer of recurring demand because exporters need proof that products meet destination-market standards and importers need confidence that incoming products satisfy domestic rules.
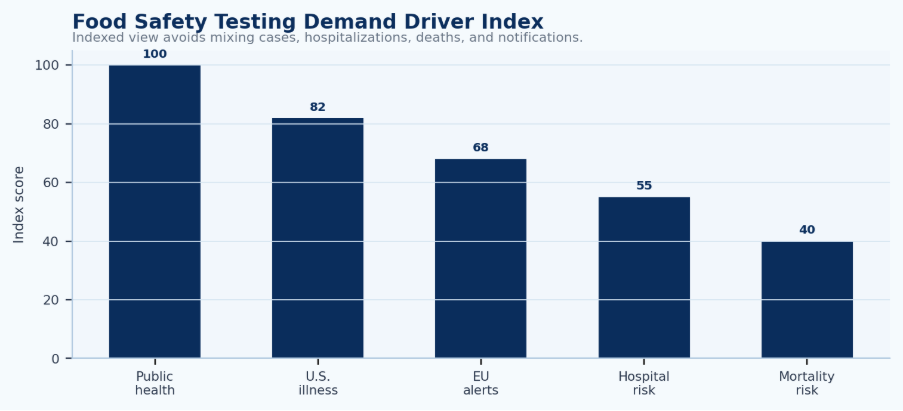
Figure 2. Selected demand-driver signals behind food safety testing growth.
Market readout:
The market is growing because food testing has moved from periodic quality control to continuous risk management.
Food Safety Testing by Test Type
The food safety testing market is built around several test families, but microbiological testing remains the anchor. Pathogen-related testing has the clearest link to recalls, public-health events, and regulatory enforcement
This is why microbiological testing led with 28.9% of global revenue in 2025 and is expected to grow at an 8.8% CAGR from 2026 to 2033.
GMO testing is a smaller but meaningful category. It generated USD 3.436 billion in 2025 and is expected to reach USD 5.801 billion by 2033, with a 6.8% CAGR.
Chemical, allergen, residue, mycotoxin, authenticity, and pathogen-specific tests remain important because they connect directly to food categories and market access.
Each test family therefore occupies a different commercial role. Microbiological testing is tied most directly to pathogen control and urgent safety decisions, while allergen testing is often linked to formulation change, sanitation verification, and labeling. Chemical and residue testing becomes especially important where food crosses borders or where regulatory limits differ by destination. Mycotoxin testing is concentrated in commodities such as grains, and authenticity testing becomes more valuable when fraud, substitution, origin claims, or premium ingredients create economic incentives for misrepresentation.
The mix of test types also affects laboratory economics. Different methods require different instruments, analyst skills, validation procedures, sample preparation, and turnaround times. A laboratory serving a broad food customer base may need to balance high-volume routine methods with lower-volume specialized tests that carry greater technical complexity. For food companies, this means the most useful testing strategy is not to maximize the number of methods used, but to align method selection with hazard severity, product type, regulatory acceptance, and the speed required for a commercial decision.
Test-type statistics are most useful when tied to use cases. Microbiological testing supports pathogen control, GMO testing supports labeling and market access, allergen testing protects packaged-food brands, and chemical testing supports residue and contaminant monitoring.
Rapid methods improve decision speed, while validated traditional or confirmatory methods remain important for formal compliance. This layered system explains why traditional methods still hold 55.3% of revenue even as rapid testing grows.
Table 4. Food Safety Testing by Test Type
| Test type | 2025 value / share | Growth signal | Main use | Meaning |
|---|---|---|---|---|
| Microbiological testing | 28.9% share | 8.8% CAGR | Pathogens | Core revenue driver |
| GMO testing | USD 3.436 billion | 6.8% CAGR | Label and trade compliance | Specialized testing base |
| Chemical testing | Priority segment | 7.3% signal | Residues and contaminants | Export and safety need |
| Allergen testing | High relevance | 8.0% signal | Packaged foods | Label-risk protection |
| Mycotoxin testing | High relevance | 7.8% signal | Cereals and grains | Commodity testing need |
| Authenticity testing | Rising relevance | 7.5% signal | Fraud detection | Supply-chain trust |
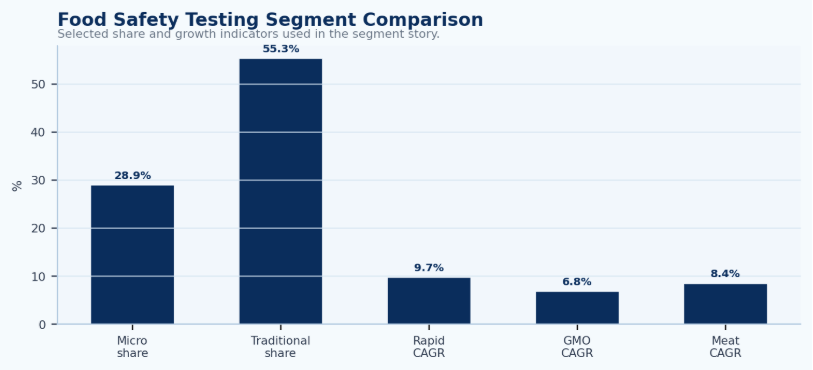
Figure 3. Selected food safety testing segment comparison.
Market readout:
Microbiological testing remains the core market because pathogens create the clearest link between testing, public health, recalls, and enforcement.
Food Category Testing Statistics
Food category matters because testing intensity is not equal across the food chain. Meat, poultry, seafood, dairy, ready-to-eat meals, and fresh produce carry higher testing relevance because they face stronger pathogen, cold-chain, residue, and contamination risks.
The meat, poultry, and seafood application is expected to grow at an 8.4% CAGR from 2026 to 2033.
Dairy testing has its own measurable market. It was estimated at USD 7.42 billion in 2025 and is projected to reach USD 11.05 billion by 2030, with an 8.3% CAGR. Dairy testing is driven by microbial quality, adulteration control, residue checks, allergen concerns, and export requirements.
Testing intensity also changes inside the same broad food category. A raw ingredient may require different verification from a finished ready-to-eat product, and a domestic product may face different evidence requirements from an export shipment. Meat and seafood businesses often combine incoming-material checks, environmental monitoring, pathogen testing, and release decisions because contamination can spread through processing environments. Dairy producers may layer microbial testing with residue, adulteration, composition, and quality checks because the product is perishable and often subject to strict customer specifications.
For fresh produce, the testing logic extends beyond the factory. Water quality, agricultural inputs, washing systems, handling practices, and cold-chain conditions can all affect risk. Cereals and grains have a different profile because mycotoxins, residues, GMO status, and authenticity may be more commercially important than short-turnaround pathogen release. These differences explain why food-category statistics should guide method mix and sampling frequency rather than simply rank categories from largest to smallest.
Food categories create different testing economics because risk, perishability, and regulatory exposure vary by product. Meat, poultry, seafood, and dairy require stronger pathogen and cold-chain controls, while fresh produce adds water-quality and residue risks and cereals and grains depend more heavily on mycotoxin, GMO, and commodity-trade testing.
Testing frequency therefore follows category risk. High-risk perishables require faster verification, while packaged and commodity foods concentrate more on allergens, authenticity, residues, and labeling. This recurring category-level demand is what turns food safety testing into a durable market.
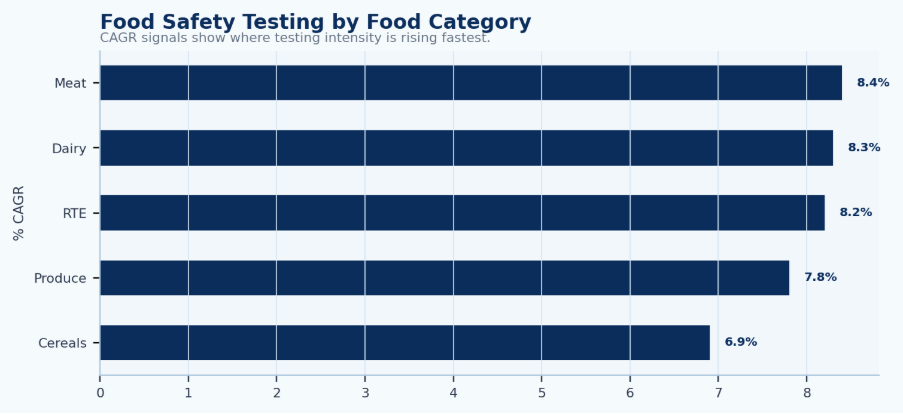
Figure 4. Food safety testing growth signals by food category.
Market readout:
Animal-protein and dairy categories carry higher testing intensity because they combine pathogen risk, cold-chain exposure, and strict import/export requirements.
Regional Food Safety Testing Market Statistics
Regional structure reflects regulation, food exports, testing infrastructure, manufacturing scale, and consumer safety expectations. Europe held the largest revenue share at 34.1% in 2025, making it the leading regional market. Mature monitoring systems, border controls, retailer standards, and public reporting mechanisms support that position.
North America remains a major testing base, generating USD 8.1685 billion in 2025 and growing at a 7.6% CAGR from 2026 to 2033. Asia Pacific is the faster-growth story because China and India combine population scale, formalizing food systems, expanding processed food consumption, and stronger enforcement.
Regional comparisons also reveal different reasons for spending. Europe’s leadership reflects a dense compliance environment in which border controls, alert networks, importer responsibility, retailer standards, and public reporting reinforce the value of documented testing. North America combines regulatory requirements with large food manufacturing, private-label retail, litigation exposure, and strong recall sensitivity. These conditions support a mature market where laboratories compete not only on analytical capability but also on turnaround time, accreditation, digital reporting, and customer integration.
Asia Pacific is more strongly associated with growth because formal retail, processed food consumption, export activity, and enforcement are expanding simultaneously in several large countries. Latin America and Middle East & Africa have smaller modeled shares, but testing can still be strategically important where agricultural exports, imported foods, or national retail systems require stronger verification. Regional opportunity is therefore a combination of current revenue, future growth, food-trade intensity, regulatory maturity, and the availability of reliable laboratory infrastructure.
Regional demand is best read through regulatory maturity and food-trade intensity. Europe’s 34.1% share reflects strong reporting systems, border controls, importer responsibility, retailer standards, and consumer-protection rules, while North America combines manufacturing scale, recall sensitivity, brand protection, and FSMA-based compliance.
Asia Pacific provides the sharper growth contrast as processed-food consumption, formal retail, exports, and enforcement expand in China and India. Country values are most useful when read alongside regulation, export demand, retail auditing, and the formalization of food systems.
Table 6. Regional Food Safety Testing Market Snapshot
| Region | 2025 value / share | Growth signal | Key demand driver | Meaning |
|---|---|---|---|---|
| Europe | 34.1% share | Largest regional base | Strict monitoring | Revenue leader |
| North America | USD 8.1685 billion | 7.6% CAGR | FSMA, recalls, audits | Stable high-value market |
| Asia Pacific | 23.5% modeled share | China and India growth | Population scale | Growth area |
| Latin America | 6.0% modeled share | Emerging compliance | Export agriculture | Opportunity region |
| Middle East & Africa | 5.3% modeled share | Import dependence | Food trade and retail | Developing base |
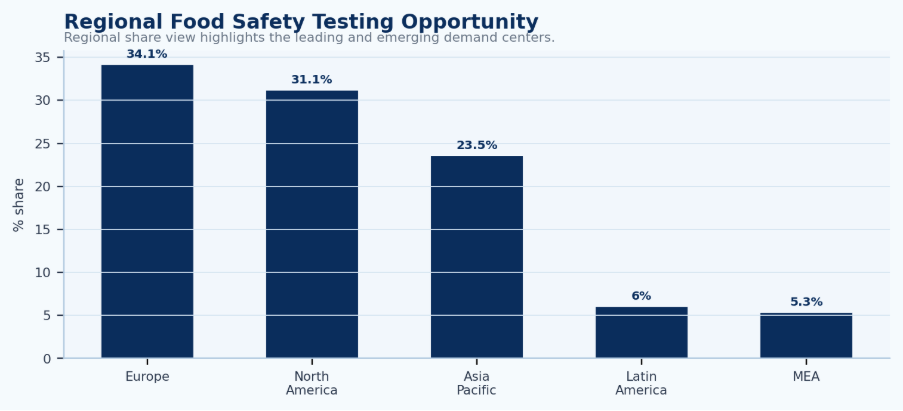
Figure 5. Regional food safety testing opportunity by 2025 share.
Market readout:
Europe leads in revenue share, but Asia Pacific is the sharper growth story because China and India combine population scale with tightening food safety enforcement.
Country-Level Food Safety Testing Market Statistics
Country-level data should be read by market role rather than as a long list. The U.S. is the strongest single-country revenue base, China is a large high-growth market, and India is one of the fastest large-market opportunities. European countries such as Germany, the United Kingdom, France, Italy, Spain, and the Netherlands remain important because they sit inside a mature compliance environment.
The U.S. food safety testing market generated USD 6.1136 billion in 2025 and is expected to reach USD 10.8751 billion by 2033, supported by a 7.5% CAGR.
China generated USD 2.6392 billion in 2025 and is forecast to reach USD 5.363 billion by 2033, with a 9.3% CAGR.
India generated USD 717.9 million in 2025 and is expected to reach USD 1.5153 billion by 2033, with a 9.8% CAGR.
The country figures show how different market roles can coexist inside the same global forecast. The United States offers the strongest single-country revenue base, which makes it important for laboratories, instrument suppliers, rapid-testing providers, and outsourced service companies seeking scale. China combines a much larger base than many emerging markets with a 9.3% CAGR, while India’s 9.8% CAGR signals faster expansion from a smaller 2025 revenue base. Germany and the United Kingdom represent a different opportunity: mature European compliance systems support consistent demand even when percentage growth is less dramatic.
Country-level statistics work as a market map: the U.S. provides the strongest revenue anchor, China adds large-scale growth, and India delivers the fastest major-market signal. European countries add a compliance-heavy layer, while Brazil and other emerging markets show how export demand and food trade create testing opportunities.
The U.S. market’s USD 6.1136 billion 2025 value shows how large a national testing base can become when regulation, retail standards, manufacturing scale, and consumer protection overlap. China and India are also becoming more formal, urban, and exposed to national and international scrutiny, increasing demand for laboratories, rapid testing, supplier audits, and documented quality systems.
Table 7. Country-Level Food Safety Testing Market Statistics
| Country | Region | 2025 value | Forecast value | Meaning |
|---|---|---|---|---|
| United States | North America | USD 6.1136 billion | USD 10.8751 billion by 2033 | Largest single-country base |
| China | Asia Pacific | USD 2.6392 billion | USD 5.363 billion by 2033 | Growth market |
| India | Asia Pacific | USD 717.9 million | USD 1.5153 billion by 2033 | Fast growth |
| Germany | Europe | USD 1.75 billion | USD 2.48 billion by 2030 | EU compliance |
| United Kingdom | Europe | USD 1.45 billion | USD 2.04 billion by 2030 | Retail audits |
| France | Europe | USD 1.35 billion | USD 1.89 billion by 2030 | Processed food base |
| Brazil | Latin America | USD 750 million | USD 1.06 billion by 2030 | Export demand |
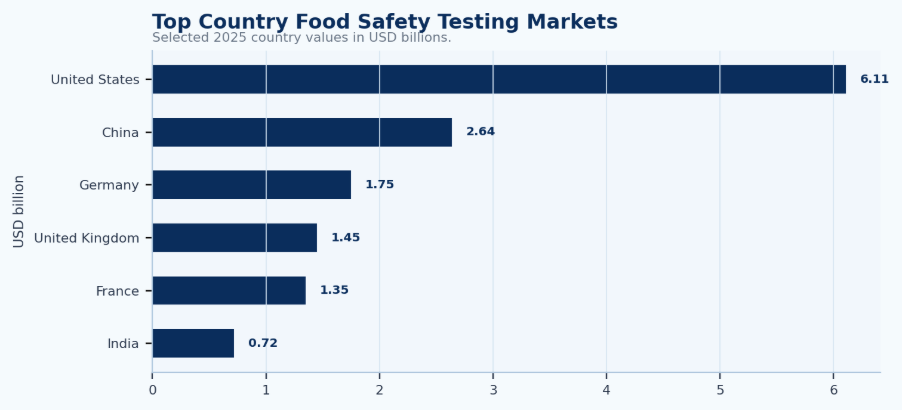
Figure 6. Selected top country food safety testing markets in 2025.
Market readout:
The U.S. is the strongest single-country revenue base, while India and China provide the fastest large-market growth signals.
Rapid Food Safety Testing and Technology Statistics
Technology is changing market behavior. Traditional testing still holds the largest share because many compliance decisions depend on established culture-based methods and validated laboratory processes. Traditional methods accounted for 55.3% of food safety testing revenue in 2025, showing that older methods remain embedded in formal systems.
Rapid testing is expanding because food companies need faster release decisions, shorter recall-response windows, and practical on-site screening.
The rapid food safety testing market is estimated at USD 19.66 billion in 2025 and projected to reach USD 31.22 billion by 2030, supported by a 9.7% CAGR.
Another benchmark places rapid testing at USD 11.7497 billion in 2025 and USD 22.2089 billion by 2033.
Rapid testing creates value when speed changes inventory or risk decisions. A result delivered sooner can reduce the time a batch remains on hold, allow a producer to isolate a suspect lot before it moves further downstream, or help a quality team decide which samples need confirmatory analysis. In high-throughput operations, even modest reductions in waiting time can matter because finished goods, ingredients, and refrigerated products carry storage and working-capital costs while they remain unreleased.
The technology shift is therefore better understood as workflow layering than wholesale replacement. Traditional methods remain important for accepted reference procedures and formal confirmation, while PCR, immunoassays, biosensors, chromatography, and other rapid or instrumental approaches can support screening and faster decision points. Digital connectivity adds further value when results flow into LIMS, traceability systems, supplier records, or regulatory documentation. The competitive advantage increasingly comes from combining analytical accuracy with usable turnaround time and clean data transfer.
Technology statistics matter because speed changes operational decisions. Faster results can reduce inventory hold time, shorten investigations, and help companies act before unsafe products move further downstream.
Traditional methods remain important for validation, regulatory acceptance, and legal defensibility, while rapid screening improves decision speed. PCR, immunoassays, biosensors, chromatography, LIMS, and traceability tools add the most value when results connect directly to suppliers, lots, production lines, and regulatory documents.
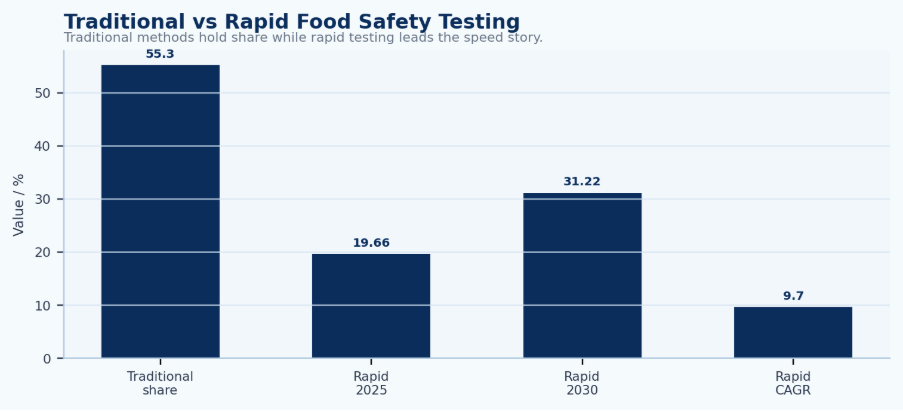
Figure 7. Traditional and rapid food safety testing comparison.
Market readout:
Traditional methods still dominate revenue, but rapid testing is gaining because food companies need faster release decisions and shorter recall-response windows.
Food Safety Regulation and Monitoring Statistics
Regulation gives the food safety testing market recurring demand. Food companies test because they must prove that products, suppliers, facilities, imports, labels, and batches meet safety rules. That makes testing a risk-management operating system rather than a one-time service purchase.
In Europe, the ACN system recorded 9,460 notifications in 2024, up 8% from 2023.
Potential intentional behavior signals also increased, with 1,335 AAC notifications and 1,959 RASFF notifications identified as potentially intentional in 2024.
AAC intentional-behavior notifications rose 24%, while RASFF intentional-behavior notifications increased 21%.
Data infrastructure is expanding as well. The CHEFS database consolidates around 392 million analytical results, more than 15.2 million samples, and more than 4,000 food product types. In the United States, FSMA reshaped food safety expectations after 2011, and required food facility registrations must be renewed every 2 years.
The regulatory statistics also illustrate why testing volumes can rise even without a corresponding increase in foodborne outbreaks. Monitoring systems are designed to identify problems earlier, document suspicious patterns, and create evidence before products reach consumers. More notifications, more samples, and larger analytical databases can therefore indicate stronger surveillance rather than simply worse food safety. For testing providers, stronger surveillance still translates into demand because each verification step requires validated methods, records, and trained personnel.
Intentional-behavior signals broaden the commercial scope beyond accidental contamination. Food fraud, adulteration, substitution, origin claims, and mislabeling can require authenticity, chemical, or composition testing in addition to traditional safety methods. This overlap strengthens the role of laboratories as evidence providers for regulators, retailers, importers, and brand owners. As databases become larger and reporting systems more connected, testing results also become part of long-term risk intelligence, helping organizations target suppliers, products, or trade routes that need more frequent verification.
Table 9. Food Safety Regulation and Monitoring Signals
| Regulatory signal | Region | Value | Meaning | Market use |
|---|---|---|---|---|
| ACN notifications | European Union | 9,460 in 2024 | Alert activity rising | Pressure signal |
| ACN increase | European Union | 8% | Monitoring intensity higher | Trend signal |
| AAC intentional cases | European Union | 1,335 | Fraud risk visible | Risk section |
| RASFF intentional cases | European Union | 1,959 | Fraud signal | Risk section |
| CHEFS results | European Union | 392 million | Data base | Data section |
| CHEFS samples | European Union | 15.2 million | Sample scale | Data section |
| FDA registration renewal | United States | Every 2 years | Recurring | Regulatory section |
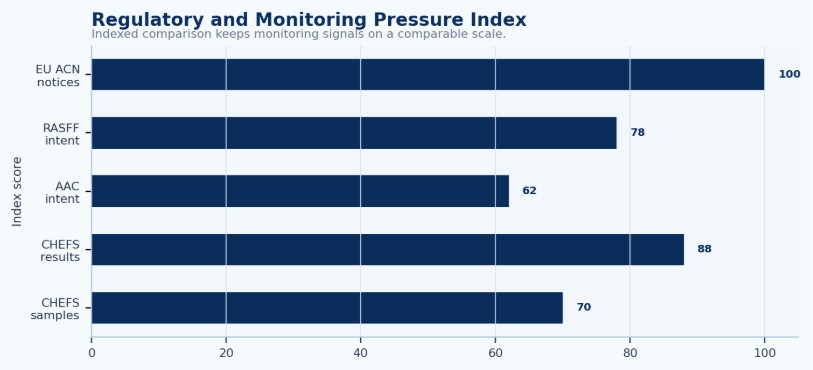
Figure 8. Regulatory and monitoring pressure indicators.
Market readout:
Regulation turns food safety testing from a discretionary quality-control cost into a required operating system for food producers, importers, laboratories, and retailers.
90-Day Food Safety Testing Benchmark Plan
A practical 90-day benchmark plan turns the market statistics into operating priorities. The sequence below moves from baseline sizing to segment and regional comparison, then to a final opportunity scorecard.
Total-market, rapid-testing, dairy-testing, GMO-testing, and country forecasts should remain separate unless their definitions are directly comparable. The final opportunity view should combine revenue scale, CAGR, testing frequency, regulatory pressure, food-category risk, and country readiness.
The benchmark plan is most useful when it produces a decision hierarchy rather than another collection of statistics. The first priority is to confirm the market definition and baseline. The second is to identify the test families and food categories where demand is most concentrated. The third is to connect those segments to regions and countries where regulation, trade, and customer expectations make testing commercially necessary. Only after those steps should technology choices and detailed opportunity scores be compared.
A disciplined sequence also prevents scope inflation. Rapid testing, dairy testing, GMO testing, and country forecasts may overlap with the total market, so they should be used as segment indicators rather than simply added together. Keeping each benchmark in its proper layer makes the final market view easier to defend and more useful for decisions about laboratory capacity, product development, regional expansion, or partnership priorities.
Table 10. 90-Day Food Safety Testing Benchmark Plan
| Timing | What to review | Output |
|---|---|---|
| Days 1–30 | Confirm total-market scope; benchmark global size, CAGR, test types, and food categories. | Clear market baseline |
| Days 31–60 | Compare regional shares, country growth, regulatory pressure, and rapid-testing adoption. | Segment and geography map |
| Days 61–90 | Score opportunities by revenue scale, testing frequency, risk, compliance, and technology readiness. | Practical market scorecard |
Market readout:
A strong food safety testing research plan should separate market value, testing frequency, regulatory demand, and technology adoption.
Metrics Food Safety Testing Companies Should Track
Food safety testing companies should not track market size alone. They need metrics showing where testing frequency is rising, regulatory alerts are increasing, food categories require more verification, and technologies are shortening turnaround time.
The strongest operating metrics show where demand is becoming more urgent. Testing volume by food category, turnaround time, rapid-testing adoption, alert frequency, and recall patterns connect market growth with day-to-day laboratory and quality decisions.
For laboratories, capacity utilization and method mix shape equipment, staffing, accreditation, and workflow needs. For food companies, supplier failures, batch holds, non-compliance events, and repeat testing show whether the testing program is preventing problems or only reacting after they appear.
Metric selection should distinguish demand indicators from performance indicators. Market size, segment growth, regulatory notices, and category testing volume show where demand may increase. Turnaround time, repeat-testing rates, sample backlog, method mix, and capacity utilization show whether a laboratory can capture that demand efficiently. For food manufacturers, supplier non-compliance, batch-hold time, recall frequency, and corrective-action trends reveal whether testing is preventing disruption or simply documenting problems after they occur.
The strongest dashboards combine both types of measures. A laboratory may operate in a fast-growing market but still face weak economics if method utilization is low or turnaround targets are missed. A food producer may run more tests without reducing risk if sampling plans are poorly targeted. Connecting market statistics to operating metrics keeps growth analysis grounded in the actual decisions that determine safety, release speed, customer confidence, and service profitability.
Table 11. Food Safety Testing Metrics to Track
| Metric | Why it matters | Best user | Meaning |
|---|---|---|---|
| Testing volume by food category | Shows category intensity | Labs and producers | Identifies demand pockets |
| Pathogen test share | Links to public-health risk | Food manufacturers | Core testing load |
| Rapid testing adoption | Measures technology shift | Labs and investors | Speed-demand signal |
| Regulatory notices | Tracks enforcement pressure | Compliance teams | Risk visibility |
| Turnaround time | Shows release efficiency | QA teams | Operational use |
| Recall frequency | Measures failure risk | Retailers and brands | Demand trigger |
| Allergen testing growth | Tracks label risk | Packaged food brands | Consumer safety |
| Residue monitoring frequency | Supports trade compliance | Exporters | Access signal |
Market readout:
The best food safety testing metrics connect laboratory demand to product risk, regulatory pressure, and commercial decision-making.
How to Read Food Safety Testing Market Statistics Correctly
Food safety testing statistics can be misleading if market scope is not checked first. Some values include only laboratory services, while others include rapid kits, technology platforms, molecular testing, outsourced services, and specialized verification categories. Forecast values can differ while still being useful.
Regional statistics also need context. A high revenue share does not always mean a region has the most food production. It may reflect stricter regulation, higher testing frequency, stronger reporting systems, more import controls, or more mature lab infrastructure. Country values should be read alongside exports, manufacturing scale, and enforcement maturity.
The same principle applies to growth rates. A high CAGR can reflect genuine acceleration, but it can also come from a smaller starting base. Country and segment forecasts should therefore be read with both the base-year value and the operational conditions that support adoption. A mature market with slower percentage growth may still generate more absolute revenue and more stable testing volumes than a smaller market growing at a faster rate.
Public-health statistics require a different interpretation again. Illness cases, deaths, hospitalizations, and regulatory alerts are not testing revenue, but they explain why food safety remains a protected operating priority. Technology statistics explain how the work is performed, while regulatory statistics explain why evidence must exist. Keeping these roles separate prevents double counting and produces a clearer story: revenue defines the market, risk creates the need, regulation makes testing recurring, and technology changes the speed and cost of delivery.
The clearest reading method connects each number to its business role: market size explains scale, CAGR explains pace, share explains structure, public-health data explains demand pressure, and regulatory notifications explain enforcement visibility. Unrelated benchmarks—such as total-market and rapid-testing forecasts—should not be combined unless scope is directly comparable.
Food safety testing is a multi-layer operating market in which microbiological, allergen, residue, authenticity, and rapid testing support different decisions. The most useful statistics are therefore the ones that explain scale, risk, timing, supplier accountability, and the ability to prevent disruption before products move downstream.
Market readout:
Food safety testing statistics should be read as a compliance and risk-management market, not only as a laboratory services market.
Food Safety Testing Market Statistics FAQ
How big is the food safety testing market?
The global food safety testing market was estimated at USD 26.27 billion in 2025 and is forecast to reach USD 48.01 billion by 2033. Other forecast models place the market at USD 35.0 billion by 2030 or about USD 51.88 billion by 2034, depending on the scope used.
What is the projected CAGR of the food safety testing market?
The main benchmark places the market CAGR at 7.8% from 2026 to 2033. Other models show CAGRs such as 6.5%, 7.59%, 8.1%, and 9.0%, which reflects different forecast windows and category definitions.
Which region leads the food safety testing market?
Europe leads by revenue share, holding 34.1% of the market in 2025. Its leadership is tied to strong monitoring systems, import controls, food-alert reporting, and mature testing infrastructure.
Which testing segment is most important?
Microbiological testing is the core segment because it held 28.9% of global revenue in 2025 and is expected to grow at an 8.8% CAGR. This segment is closely linked to pathogen control, recalls, and public-health risk.
Why is rapid food safety testing growing?
Rapid testing is growing because food companies need faster release decisions, shorter recall-response windows, and quicker verification across complex supply chains. The rapid food safety testing market is projected to grow from USD 19.66 billion in 2025 to USD 31.22 billion by 2030.
Which countries matter most in food safety testing?
The United States is the strongest revenue base with USD 6.1136 billion in 2025. China and India are important growth markets, with China expected to reach USD 5.363 billion by 2033 and India expected to reach USD 1.5153 billion by 2033.
What role does regulation play in food safety testing?
Regulation creates recurring testing demand. EU ACN notifications reached 9,460 in 2024, while U.S. FSMA rules and facility registration requirements reinforce continuous compliance behavior.
What is the main takeaway from food safety testing market statistics?
The main takeaway is that food safety testing is becoming a larger, faster, and more technology-driven market because food companies must manage public-health risk, regulatory enforcement, global trade, and consumer trust at the same time.
Final Takeaway
Food safety testing market statistics show a category that is expanding because food safety has become a permanent operating requirement. The market’s headline path from USD 26.27 billion in 2025 to USD 48.01 billion by 2033 reflects more than laboratory spending. It reflects the rising cost of foodborne illness, tighter regulation, more complex supply chains, and faster testing expectations.
Europe currently leads by share, North America remains a high-value testing base, and Asia Pacific provides the strongest large-market growth story through China and India. At the segment level, microbiological testing remains the core revenue driver, while rapid testing is reshaping how companies manage release timing, recalls, and supplier verification.
The most useful way to read the market is as a risk-management system. Food producers, retailers, exporters, regulators, and laboratories are using testing to protect consumers, satisfy compliance rules, defend brand trust, and keep food moving through global trade channels. That is why food safety testing is positioned for steady growth across markets, technologies, and food categories.
The long-term opportunity is therefore strongest where testing is embedded in everyday operating decisions. High-risk foods, cross-border trade, private-label supply chains, rapid-release environments, and tightly regulated markets all create repeated points where evidence is needed before a product can move forward. Laboratories and technology providers that can connect accurate results with faster reporting, reliable documentation, and customer workflows are positioned to capture more value than providers competing on analytical capacity alone.