Food processing machinery sits at the center of modern food manufacturing. The category includes industrial equipment used to mix, cut, grind, form, bake, brew, process meat and poultry, prepare fruit and vegetables, manufacture confectionery, and move products through increasingly automated production environments. For food producers, machinery is not only a capital purchase. It determines throughput, consistency, sanitation performance, labor requirements, energy use, yield, changeover speed, and the ability to scale new products without sacrificing quality.
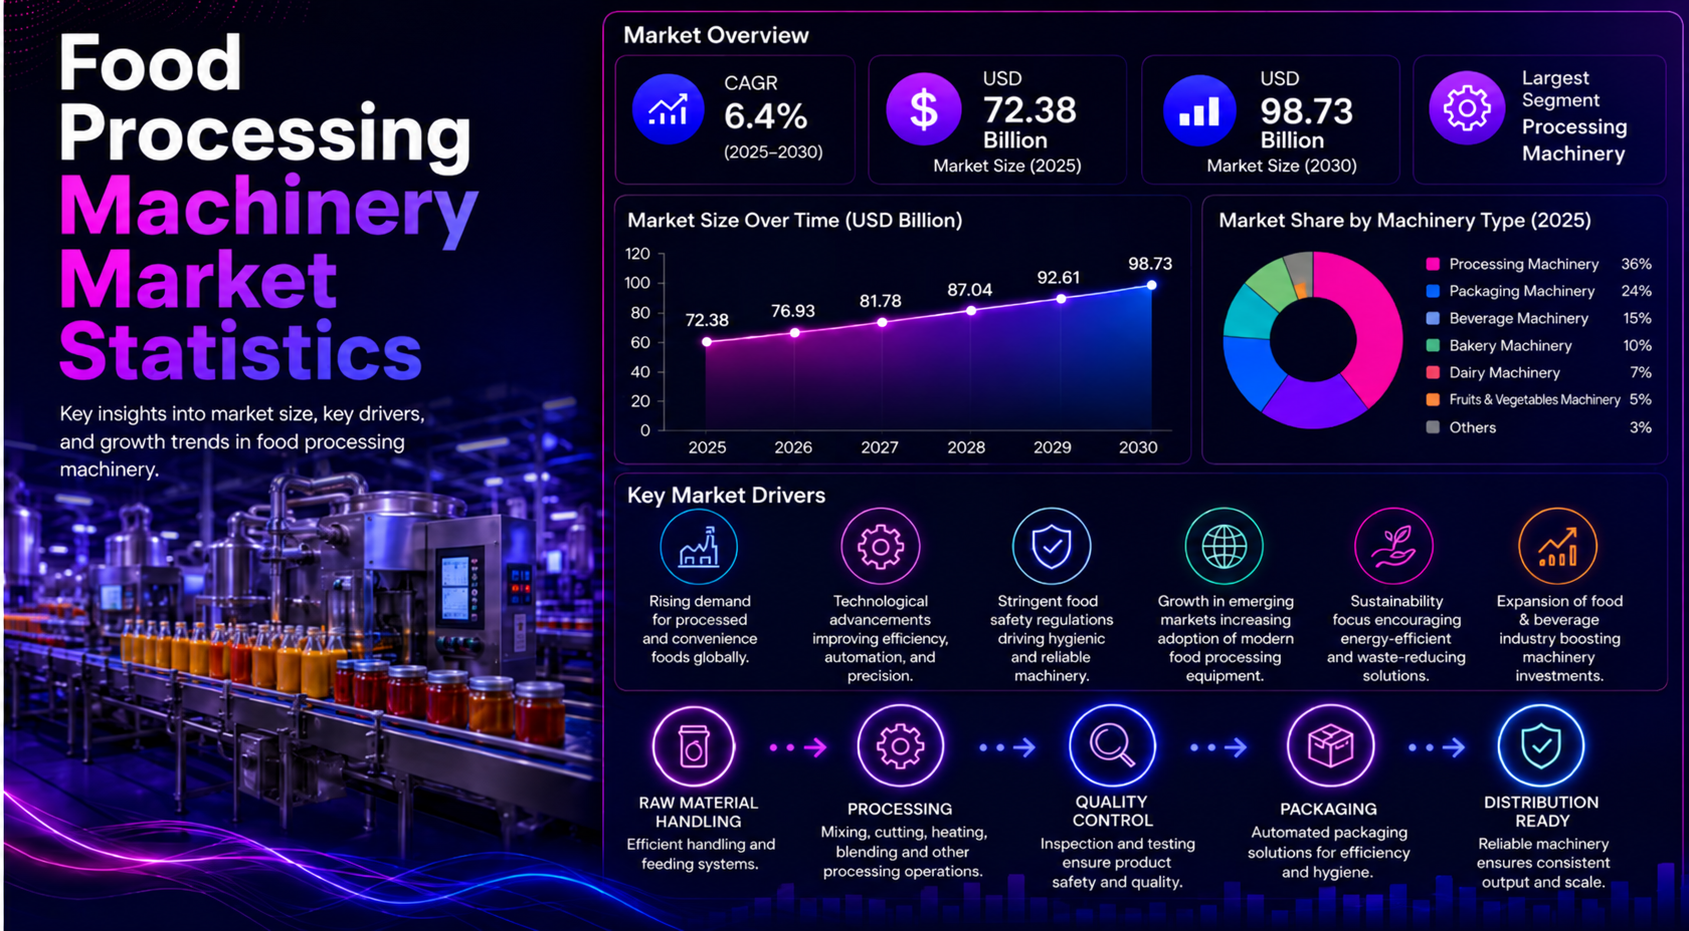
The market is already large and still expanding. One published estimate places the food processing equipment market at $68.70 billion in 2024 and $73.39 billion in 2025, with a forecast of $100.38 billion by 2030. Other market definitions produce higher or lower totals, but the direction is consistent: investment is being supported by packaged-food demand, industrialization, factory modernization, automation, food-safety requirements, and replacement of aging production lines. Trade data shows the same global reach. HS 8438 food-processing machinery imports reached about $14.65 billion in 2024, while exports totaled about $17.49 billion.
The most useful way to read this market is not to rely on one global CAGR. Machinery demand is uneven across equipment types, processing applications, regions, and countries. A mature market may import billions of dollars of equipment even during a down year, while a smaller market can post rapid percentage growth because several large factories are being equipped at once. This report therefore combines market-size estimates with import and export flows, regional benchmarks, country momentum, tariff conditions, automation signals, and the operational economics that determine whether processors replace, expand, or redesign production capacity.
Executive Food Processing Machinery Benchmarks
These figures frame the machinery market before the analysis moves into equipment categories, trade, regions, and country-level demand. They show that the sector is large enough for small shifts in capital spending to create meaningful changes in supplier opportunity, yet fragmented enough that one market-size headline cannot describe the whole industry.
The numbers defining the machinery market
• 360iResearch estimated the food processing equipment market at $68.70 billion in 2024 and $73.39 billion in 2025.
• The same source forecasts a market value of $100.38 billion by 2030, equivalent to a 6.52% CAGR for 2025–2030.
• Research and Markets reported a broader food processing machinery and equipment estimate of $72.5 billion in 2024 and $102.8 billion by 2030.
• That Research and Markets outlook implies growth of about 6.0% annually through 2030.
• Virtue Market Research used a broader market definition and estimated $101.7 billion in 2023, with a $149.92 billion forecast for 2030.
• Industry ARC projects the food processing machinery market at $146.40 billion by 2030 and cites an 8.0% CAGR over its forecast period.
• Global Info Research estimated food processing machinery and equipment at $58.99 billion in 2023 and $84.47 billion in 2030, showing how market definitions materially affect headline totals.
• Meticulous Research data cited by Fresh Fruit Portal projects the food processing equipment market to reach about $103.0 billion by 2031.
• The same dataset placed semi-automatic equipment at about 60.3% of the market in 2024.
• Asia-Pacific was estimated at about 43% of food processing equipment market share in that dataset, equal to roughly $30.38 billion in regional value.
• PMMI and Trade Data Monitor data shows global HS 8438 machinery imports of about $14.65 billion in 2024.
• Global HS 8438 exports reached about $17.49 billion in 2024, up 6.1% from 2023 in the same trade dataset.
• The United States imported about $2.04 billion of HS 8438 food processing machinery in 2024, the largest individual import value among the leading markets in the dataset.
• Germany exported about $2.85 billion of HS 8438 machinery in 2024, followed closely by Italy at about $2.74 billion.
Editorial readout
The headline statistics point to five forces shaping the market: global food-production scale, factory automation, equipment replacement, international trade, and regional industrial investment. The most attractive opportunities are rarely identified by a single growth percentage. Suppliers and processors need to compare absolute market size, equipment category, import dependence, installed capacity, tariff burden, service requirements, and the economics of keeping older lines running versus replacing them.
Why Food Processing Machinery Is Becoming a $100 Billion Market
Food processing equipment benefits from a structural feature that distinguishes it from many discretionary capital-goods categories: food demand is persistent, but the form in which food is produced and sold keeps changing. Population growth, urbanization, convenience formats, frozen foods, ready meals, packaged snacks, beverages, protein products, bakery items, and increasingly sophisticated cold-chain systems all create pressure on processors to handle more volume with tighter consistency. That pressure eventually reaches the factory floor through new lines, upgraded controls, sanitation improvements, debottlenecking, and replacement machinery.
Published market estimates differ substantially because research firms do not define the category in exactly the same way. A narrower food-processing-equipment scope may exclude packaging, auxiliary handling, or selected process systems, while a broader machinery definition may capture more of the plant. For that reason, the $68.70 billion, $72.5 billion, $101.7 billion, and other estimates in the research set should not be averaged into one figure. They are better used as a range showing that even conservative definitions describe a very large industrial equipment market.
The forecast direction is nevertheless consistent. 360iResearch moves from $68.70 billion in 2024 to $100.38 billion in 2030. Research and Markets moves from $72.5 billion in 2024 to $102.8 billion in 2030. Meticulous Research points to approximately $103.0 billion by 2031. Broader definitions from Virtue Market Research and Industry ARC reach roughly $146–150 billion around 2030. Across these sources, the implied growth rate generally falls in the mid-single digits to high-single digits, which is meaningful for an established industrial category.
The business implication is that market growth will not be distributed evenly. Expansion can come from greenfield factories, new product categories, higher line speeds, automation retrofits, energy-efficiency projects, hygiene upgrades, or replacement of machinery that has reached an economic maintenance threshold. A supplier selling a high-value meat line faces a different cycle from a vendor supplying bakery mixers, confectionery systems, fruit preparation equipment, or standard components. Market size therefore establishes the scale of opportunity, but application-level and country-level data determine where that opportunity is actually accessible.
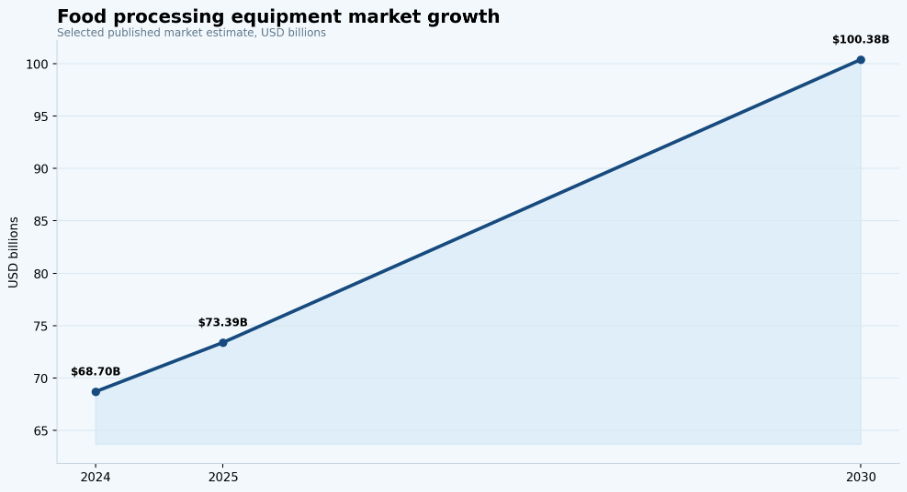
Figure 1. Published forecasts point to sustained expansion in food-processing equipment as manufacturers invest in capacity, automation, efficiency, and modern production systems.
Machinery Demand by Processing Function
Food processing machinery is not a single homogeneous product class. HS 8438 separates equipment for bakery and pasta production, confectionery and cocoa processing, sugar manufacturing, breweries, meat and poultry preparation, fruit and vegetable processing, other food or drink preparation, and machinery parts. That classification is useful because each segment carries a different combination of throughput, hygiene, temperature, mechanical stress, recipe variability, and maintenance requirements.
Bakery and pasta machinery can range from mixers and dough-processing systems to forming and industrial baking equipment. Confectionery machinery adds precise temperature control, depositing, molding, enrobing, and handling requirements. Meat and poultry equipment must combine speed with sanitation, worker safety, cutting accuracy, and cold-process reliability. Fruit and vegetable systems may emphasize washing, peeling, sorting, cutting, pulping, juicing, waste separation, and gentle handling. Brewery machinery has its own vessel, flow, fermentation, filtration, and cleaning requirements.
These differences matter commercially. A processor evaluating machinery does not simply ask whether a vendor makes ‘food equipment.’ It asks whether the vendor understands the product, cleaning regime, line speed, recipe changes, allergen controls, packaging interface, available floor space, utilities, and local service conditions. That is why specialist manufacturers can maintain strong positions even in a market with many competitors: expertise in a particular process often becomes part of the machine’s value proposition.
Parts are also strategically important. A production line can remain in service for many years, but bearings, seals, blades, belts, pumps, controls, sensors, motors, valves, and wear components require replacement. The installed base therefore creates aftermarket demand that is less visible in headline market-size estimates. For machinery suppliers, the economic value of a market can include new equipment, retrofits, spare parts, service, commissioning, operator training, and upgrades to controls or sanitation systems.
| Machinery category | Typical process | Main demand driver | Operational consideration |
|---|---|---|---|
| Bakery / pasta | Mixing, forming, baking | Packaged bakery and convenience foods | Throughput, consistency, changeover |
| Confectionery | Mixing, tempering, molding | Premium and packaged sweets | Temperature and recipe control |
| Brewery | Brewing and beverage processing | Beverage output and product variety | Flow control, cleaning, automation |
| Meat / poultry | Cutting, grinding, forming | Protein processing capacity | Hygiene, safety, yield |
| Fruit / vegetable | Washing, grading, cutting | Fresh and processed food demand | Gentle handling and waste reduction |
| Other / parts | Multi-category processes | Flexible manufacturing and installed base | Integration, maintenance, uptime |
Automation and the Modern Food Factory
Automation is one of the clearest long-term themes in food manufacturing, but the market is not moving from manual work to fully autonomous factories in one step. The Meticulous Research dataset cited in the research workbook placed semi-automatic equipment at about 60.3% of the market in 2024. That share is a reminder that many processors still value machinery that combines mechanical productivity with human oversight, especially where product variation, investment budgets, local labor economics, or frequent changeovers make complete automation difficult to justify.
Semi-automatic systems can be attractive for small and mid-sized manufacturers because they reduce repetitive work without requiring the same level of integration as a fully automated line. They may also fit plants where upstream and downstream processes have different levels of modernization. A company can automate the most labor-intensive or consistency-sensitive stage first, then connect additional equipment as production volume rises. In that sense, semi-automation can be a transition architecture rather than a permanent endpoint.
Fully automated equipment becomes more compelling when throughput, labor availability, precision, traceability, or contamination control makes manual intervention costly. Modern lines increasingly use programmable controls, sensors, recipe management, vision inspection, robotics, digital monitoring, and data capture. The economic case usually comes from several gains at once: more output per shift, fewer handling steps, lower variation, less giveaway, reduced rework, faster changeovers, improved safety, or better asset utilization.
The most important automation metric is not the percentage of tasks performed by machines. It is the amount of profitable production the plant gains for the capital deployed. Processors should compare throughput, labor hours per unit, uptime, unplanned stops, changeover time, reject rates, yield, sanitation time, energy consumption, and maintenance cost before and after automation. A faster line that creates more waste, more difficult cleaning, or greater maintenance dependency can produce weaker economics than a simpler system with stable output.
Automation interpretation
Automation should be evaluated as a production-system decision rather than a machinery feature checklist. The strongest projects remove bottlenecks, improve repeatability, reduce avoidable labor, and produce measurable capacity or quality gains without creating disproportionate maintenance, integration, or sanitation complexity.
Food Safety, Sanitation, and Equipment Design
Food-processing machinery works in an environment where production performance and hygiene performance are inseparable. Equipment that is difficult to clean can create longer sanitation windows, hidden product accumulation, allergen cross-contact risk, microbial harborage points, and more disassembly work for operators. As a result, hygienic design is not merely a regulatory feature. It affects effective capacity because every additional hour spent cleaning is an hour the line cannot produce.
Stainless-steel construction, accessible surfaces, drain ability, appropriate seals, protected bearings, cleanable conveyors, sanitary welds, and well-designed product-contact zones all influence lifecycle performance. The requirements become more demanding in wet processing, meat and poultry, dairy-style environments, ready-to-eat production, or applications where product residues can harden or support microbial growth. Even when two machines have similar rated throughput, differences in cleaning access and changeover procedure can produce very different daily output.
Digitalization can also support food-safety performance. Sensors and control systems can document temperatures, line speeds, batch timing, cleaning cycles, and critical operating conditions. That information helps processors identify deviations faster and can improve traceability during quality investigations. However, digital monitoring does not compensate for poor mechanical design. The basic machine still needs to be safe, maintainable, cleanable, and compatible with the product being processed.
A useful equipment scorecard therefore includes sanitation time, unplanned downtime, reject rate, contamination events, cleaning water and chemical use, maintenance frequency, spare-part consumption, and line availability. For processors making multiple recipes, allergen-control time and changeover time should also be measured. These operating metrics often explain why a higher-priced machine can have a lower total cost over its service life.
Global Food Processing Machinery Trade
International trade data provides a different view of the market from commercial market-size estimates. Instead of estimating all equipment revenue, HS 8438 data records cross-border flows of machinery used for industrial preparation or manufacture of food or drink. PMMI and Trade Data Monitor figures show global imports rising from about $12.50 billion in 2022 to $13.98 billion in 2023 and $14.65 billion in 2024. The 2024 increase was approximately 4.8% year over year.
Exports were larger in gross reported value, rising from about $14.97 billion in 2022 to $16.49 billion in 2023 and $17.49 billion in 2024. Export value increased about 6.1% in 2024. Gross global import and export totals do not have to match exactly because of reporting practices, valuation bases, re-exports, timing, and country coverage, so the useful signal is the direction and concentration of trade rather than an attempt to force the two totals into perfect balance.
The upward movement matters because industrial food equipment is often produced in one country, integrated with components from several others, and installed in a third market. Large machinery suppliers therefore depend on logistics, commissioning, local service, spare-parts channels, and technical support in addition to manufacturing capability. The trade data also captures the reality that many food-producing markets cannot source every specialized processing technology domestically.
For equipment vendors, trade value is one of the best external indicators of addressable demand because it shows where companies are actually purchasing foreign machinery. For processors, import concentration can reveal supply-chain exposure. A factory that depends on imported equipment may also depend on imported components, specialist engineers, software support, or long lead-time parts. That creates an operational reason to evaluate supplier coverage and service capability alongside purchase price.
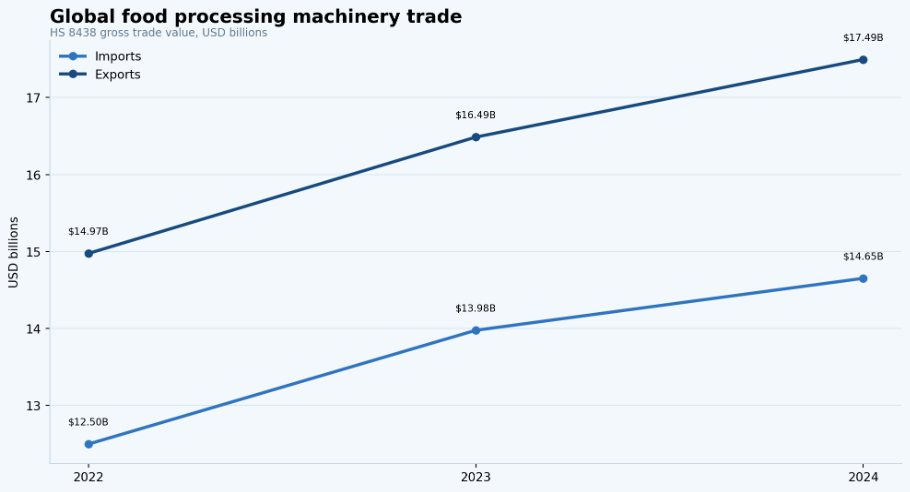
Figure 2. International trade in food-processing machinery expanded between 2022 and 2024, illustrating the globalized nature of production-line investment and equipment supply.
Largest Food Processing Machinery Import Markets
Country imports show where foreign machinery demand is concentrated. The United States remained the largest individual importer in the PMMI/Trade Data Monitor table at about $2.04 billion in 2024, even after a 9.0% decline from 2023. The next tier is much more closely grouped, with Mexico, Canada, France, Germany, the United Kingdom, the Netherlands, Spain, Turkey, and Belgium each importing hundreds of millions of dollars of machinery.
2024 importer benchmarks
• The United States imported about $2.04 billion in 2024, down 9.0% from approximately $2.24 billion in 2023.
• Mexico imported about $645.4 million, up 8.5% from 2023 and well above its $389.4 million level in 2022.
• Canada imported about $588.1 million, almost flat at –0.2% year over year.
• France reached about $568.0 million of imports, rising 3.4% in 2024.
• Germany imported about $553.9 million, down 3.1% from 2023.
• The United Kingdom imported about $520.5 million, an increase of 1.4%.
• The Netherlands reached about $490.8 million, up 7.6%.
• Spain imported about $461.7 million, up 19.1% year over year.
• Turkey reached about $440.2 million, with an exceptional 62.3% increase from 2023.
• Belgium imported about $420.2 million, also up 19.1%.
• India reached about $395.6 million, increasing 13.8%.
• Poland imported about $359.6 million, up 6.9%.
• Italy imported about $323.9 million, down 7.9%.
• China imported about $312.3 million, down 5.6%.
• Indonesia imported about $278.7 million, increasing 11.4%.
• Saudi Arabia reached about $273.5 million, up 54.6% year over year.
• Brazil imported about $266.4 million, increasing 37.0%.
• South Korea reached about $179.1 million, up 25.6%.
The largest percentage increases should be interpreted carefully because machinery purchases are lumpy. A single factory expansion or major production line can materially change a country’s annual total. Even so, rapid growth across several markets is useful for identifying where processors may be investing in capacity, modernization, or new categories. Turkey, Saudi Arabia, Brazil, South Korea, Spain, Belgium, Iran, and India stand out as markets that deserve closer project-level investigation.
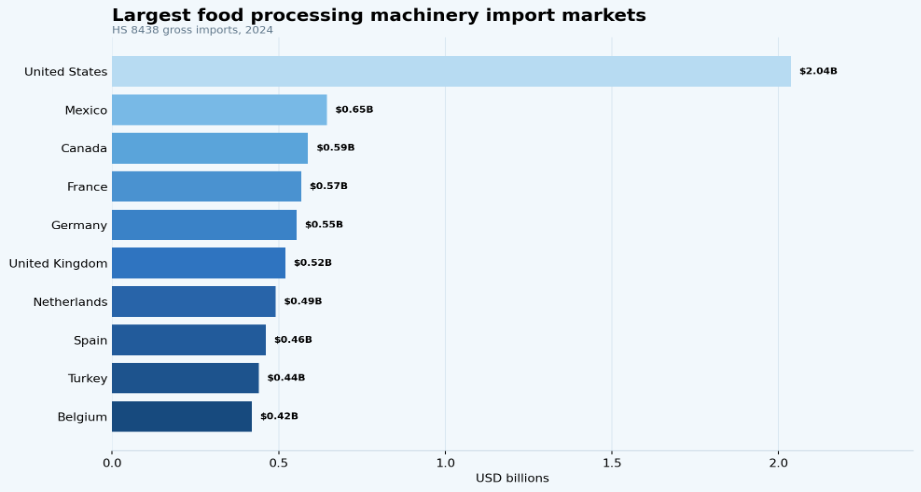
Figure 3. The United States remains the largest individual importer among the leading markets in the dataset, while Mexico, Canada, and major European economies also represent substantial machinery demand.
| Market | 2024 imports | 2024 vs. 2023 | Market readout |
|---|---|---|---|
| United States | $2.04B | -9.0% | Largest market; mature demand despite recent contraction |
| Mexico | $645.4M | +8.5% | Large and expanding import base |
| Turkey | $440.2M | +62.3% | Exceptional recent project-driven growth |
| India | $395.6M | +13.8% | Strong structural modernization signal |
| Saudi Arabia | $273.5M | +54.6% | Rapid investment growth |
| Brazil | $266.4M | +37.0% | Fast-growing Latin American demand |
Leading Food Processing Machinery Exporters
Exports reveal where food-processing machinery manufacturing and engineering capability is concentrated. Germany led the 2024 table with approximately $2.85 billion of HS 8438 exports, while Italy followed at about $2.74 billion. The Netherlands reached about $2.38 billion, and China exported roughly $1.76 billion. The United States was also a major supplier at approximately $1.29 billion.
The scale of European exports reflects deep machinery ecosystems built around specialized engineering, component suppliers, integrators, food-industry clusters, and international service networks. Denmark exported about $737 million, France about $670 million, Spain about $459 million, Switzerland about $377 million, and Turkey about $354 million in 2024. Poland, Austria, and the United Kingdom each exceeded $300 million.
Growth adds another dimension. United Kingdom exports rose about 20.0% in 2024, Spain increased 17.7%, India 17.1%, Japan 14.4%, China 14.0%, South Korea 13.5%, and Brazil and Turkey each around 11.6%. These increases do not automatically mean suppliers from those countries are taking permanent global share, but they show a broad manufacturing base beyond the traditional European leaders.
For buyers, exporter strength matters because a large supplier country can offer deeper competition, more component availability, and more established service channels. For machinery manufacturers, the data highlights the importance of dealer networks and local support. Industrial food equipment is rarely a one-time transaction: installation, commissioning, training, spare parts, preventive maintenance, software updates, and line modifications can determine whether an exporter develops recurring revenue in a market.
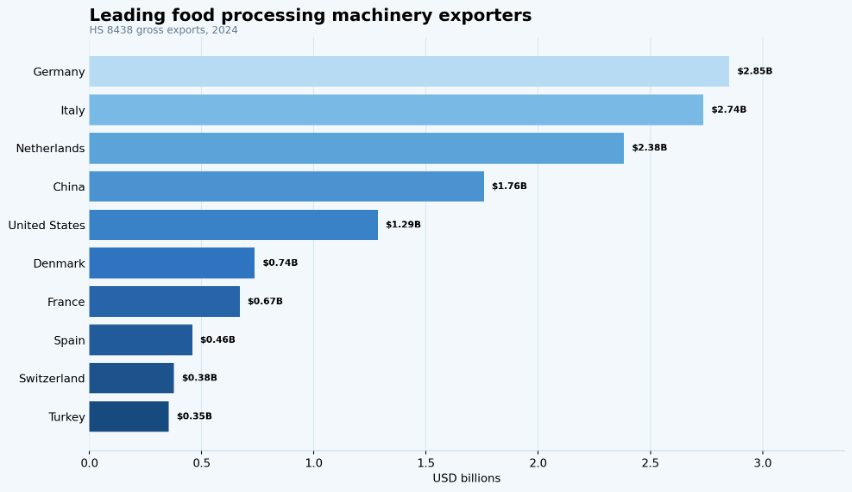
Figure 4. European engineering hubs dominate the leading exporter list, while China and the United States also supply substantial volumes of food-processing machinery to global markets.
Regional Food Processing Machinery Market Statistics
Regional averages are useful only when they lead to country-level questions. Food production, labor cost, product mix, capital availability, domestic equipment manufacturing, tariff structures, and factory modernization differ widely inside each region. The strongest regional analysis therefore combines broad market indicators with individual-country trade data.
North America
PMMI’s regional benchmark places combined 2024 food-processing machinery imports for the United States and Canada at about $2.6 billion, with a 2015–2024 CAGR of approximately 6.2%. The United States alone accounted for about $2.04 billion in 2024, while Canada imported roughly $588.1 million. Mexico, although often treated separately in trade groupings, imported about $645.4 million and has become an important machinery market tied to expanding manufacturing and food production.
North American demand is supported by a large installed base, high labor costs, sophisticated packaged-food industries, and continuing automation pressure. Mature plants create replacement and retrofit opportunities even when greenfield construction slows. The United States’ 9.0% import decline in 2024 therefore should not be read as evidence that the underlying machinery opportunity disappeared; it may instead reflect project timing after a strong 2023.
Europe
Western Europe represented approximately $4.3 billion of processing machinery imports in the PMMI regional benchmark for 2024 and recorded an estimated 3.9% CAGR from 2015 to 2024. At country level, France imported about $568.0 million, Germany $553.9 million, the United Kingdom $520.5 million, the Netherlands $490.8 million, Spain $461.7 million, Belgium $420.2 million, Poland $359.6 million, and Italy $323.9 million.
Europe is unusual because it is simultaneously a major buyer and the world’s most important machinery production cluster. Germany, Italy, the Netherlands, Denmark, France, Spain, Switzerland, Austria, the United Kingdom, and Poland all appear among leading exporters. That means European plants have access to a dense supplier base, while European machinery manufacturers are highly exposed to international capital-spending cycles.
Asia-Pacific
One market dataset cited in the research workbook assigns Asia-Pacific about 43% of global food processing equipment market share in 2024, equivalent to approximately $30.38 billion under that source’s market definition. The region’s scale reflects large populations, expanding food manufacturing, urban consumption, modern retail, export-oriented production, and continuing investment in automated processing capacity.
Country trade indicators show very different patterns. India imported about $395.6 million of HS 8438 machinery in 2024 and has an estimated 8.1% long-term 2015–2024 import CAGR in the PMMI regional analysis. China imported about $312.3 million in 2024, Australia about $256.1 million, Indonesia $278.7 million, South Korea $179.1 million, Thailand $171.1 million, and Japan about $144.2 million. India’s long-term growth contrasts with approximately –2.2% for China and –1.3% for Japan in the cited long-run import indicators, illustrating why Asia-Pacific should never be treated as one uniform machinery market.
Latin America
PMMI’s selected Latin American benchmark covering Mexico, Brazil, Chile, and Argentina totaled about $990.5 million of machinery imports in 2024, with long-term 2015–2024 CAGR of roughly 0.3%. The modest regional growth rate hides major country differences. Mexico imported about $645.4 million in 2024, while Brazil reached about $266.4 million.
Brazil’s imports increased 37.0% in 2024, making it one of the faster-growing major countries in the dataset. Mexico’s 8.5% increase came on a much larger base. For suppliers, both markets can be attractive, but commercial models must account for local service, import procedures, currency exposure, and customer financing.
Middle East
Turkey is the strongest Middle East-adjacent growth story in the dataset, with about $440.2 million of imports in 2024 and a 62.3% increase from 2023. PMMI’s long-run Turkey indicator shows approximately 6.3% CAGR from 2015 to 2024. Saudi Arabia imported about $273.5 million in 2024, rising 54.6%, while Iran reached roughly $169.6 million after 19.8% growth.
The combination of food-security investment, domestic manufacturing ambitions, modern retail, hospitality demand, and imported technical capability can support machinery purchases across the region. However, project access, financing, trade rules, local partnerships, and service capacity can matter as much as headline growth.
Africa
The available regional dataset provides less depth for Africa, but South Africa offers a useful benchmark. PMMI reports approximately $139.0 million in 2024 food-processing machinery imports and about 2.4% CAGR from 2015 to 2024. The smaller absolute figure should not be confused with an absence of opportunity; it indicates that market selection and project targeting are especially important.
Across African markets, demand can be driven by formalization of food production, local processing of agricultural output, packaging and shelf-life requirements, cold-chain expansion, and substitution of imported finished foods with domestic production. Suppliers entering these markets generally need to evaluate distributor capability, technical training, parts inventory, power and utility conditions, and the processor’s ability to finance imported equipment.
| Region | Statistical signal | Market implication |
|---|---|---|
| North America | Large U.S. import base; 6.2% long-run U.S.+Canada CAGR | Mature but high-value automation and replacement demand |
| Europe | $4.3B Western Europe import indicator | Major equipment-production and consumption ecosystem |
| Asia-Pacific | 43% reported market share in one dataset | Scale, industrialization, and food-demand growth |
| Latin America | Mexico and Brazil dominate selected-market imports | Opportunities vary sharply by country |
| Middle East | Turkey +62.3%; Saudi Arabia +54.6% in 2024 | Strong recent capacity-investment signals |
| Africa | South Africa about $139M imports | Selective modernization and local processing opportunities |
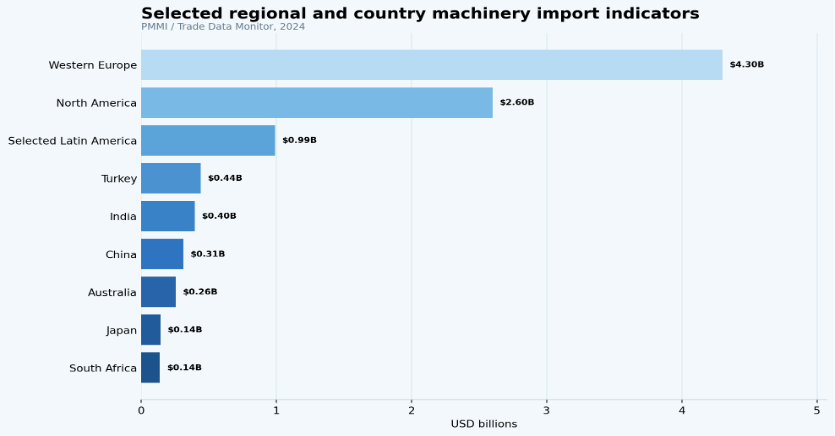
Figure 5. Selected PMMI regional and country import indicators show large differences in machinery demand, reinforcing the need to evaluate each geography on its own industrial structure and project pipeline.
Country-Level Machinery Growth Stories
The most dramatic year-over-year changes in machinery imports appear in markets where industrial projects can move the total quickly. Turkey’s 62.3% increase, Saudi Arabia’s 54.6% rise, Brazil’s 37.0% gain, South Korea’s 25.6% increase, Spain and Belgium’s 19.1% gains, Iran’s 19.8% increase, and India’s 13.8% rise all point to active investment. These markets deserve attention, but the correct question is what caused the increase rather than whether the percentage alone is high.
Food-processing equipment is purchased in large increments. One meat plant, dairy line, bakery expansion, beverage project, or fruit-processing facility can add tens of millions of dollars to a country’s annual imports. A year with several projects can therefore look exceptional, followed by a flatter year once installation is complete. Suppliers should combine annual trade growth with longer-term trends, known factory projects, customer pipelines, and end-market food demand.
Mature or declining markets provide an equally useful lesson. U.S. imports fell 9.0% in 2024 after reaching about $2.24 billion in 2023. Australia declined 18.1%, Italy 7.9%, China 5.6%, Denmark 4.9%, and Germany 3.1%. These declines can reflect project timing, weaker capital spending, domestic machinery supply, or normalization after earlier investment rather than a permanent loss of demand.
The best country scorecard therefore separates three questions: how large is the market, how fast is it changing, and how sustainable is the change? A $2 billion market shrinking modestly may still offer more sales than a $150 million market growing 30%. Conversely, a smaller high-growth market can offer an easier route to share if competition is less entrenched and local processors are actively modernizing.
Import Tariffs and Machinery Market Access
Equipment demand does not automatically translate into accessible demand. Imported machinery carries freight, insurance, installation, potential customs brokerage, and in some markets a meaningful tariff. PMMI’s 2025 guide provides standard MFN tariff indications across HS 8438 categories, including bakery and pasta machinery, confectionery machinery, sugar machinery, brewery equipment, meat and poultry preparation machinery, fruit and vegetable machinery, other food-processing equipment, and parts.
The tariff structure varies sharply. Canada is listed as free across the selected HS 8438 categories. The European Union and Turkey show approximately 1.7% standard rates in the PMMI table. India is shown at about 7.5%, while South Korea is around 8%. Saudi Arabia and the United Arab Emirates are generally around 5%, and Chile around 6%. China’s listed rates vary roughly from 5% to 8% depending on subcategory.
The United States has several free categories in the table but applies rates such as approximately 2.3% for brewery machinery and 2.8% for meat or poultry preparation machinery. Indonesia ranges from free or 5% in some categories up to 10% for brewery machinery. These differences can influence landed equipment cost, particularly for large projects where even a few percentage points represent a substantial amount of capital.
Tariffs should always be rechecked before publication or commercial quoting because rates can change and preferential trade agreements may reduce the actual duty payable. Still, the comparison is valuable for market planning. A supplier with similar demand in two countries may find that tariff treatment, local taxes, certification, shipping distance, and service requirements materially change the final competitiveness of the offer.
| Market | Typical rate in dataset | Market-access interpretation |
|---|---|---|
| Canada | Free | Low standard tariff barrier across listed categories |
| European Union | 1.7% | Relatively low MFN rate |
| United States | Free-2.8% | Varies by machinery category |
| China | 5-8% | Category-specific import cost |
| India | 7.5% | Material landed-cost consideration |
| South Korea | 8% | Higher standard rate in selected comparison |
| Saudi Arabia | 5% | Moderate machinery duty |
| UAE | 5% | Moderate standard rate |
| Chile | 6% | Meaningful import-cost factor |
Machinery Investment Economics
Processors ultimately buy machinery because they expect the equipment to improve production economics. Purchase price is visible, but it is only one component of the decision. A lower-cost machine can become expensive if it creates excessive downtime, difficult cleaning, high scrap, frequent parts replacement, weak local support, or long changeovers. Conversely, a more expensive line can justify its capital cost when it consistently delivers higher yield, throughput, reliability, and labor efficiency.
The first step is to identify the constraint. If demand exceeds available capacity, throughput and uptime may dominate the business case. If labor is difficult to recruit, automation and ergonomic benefits may matter more. If the plant loses product during trimming, filling, or changeover, yield improvement can create a large financial return. If sanitation consumes excessive hours, hygienic design may release capacity without changing rated line speed.
Energy and utility use are also becoming more important in equipment selection. Heating, refrigeration, compressed air, water, steam, pumping, and cleaning can create significant operating costs. Processors should compare energy per unit, water per cleaning cycle, warm-up time, standby consumption, and heat recovery where relevant. These variables are especially important when a machine will operate for multiple shifts over many years.
The investment case should end with a realistic total-cost model. That model should include acquisition, installation, training, spare parts, expected maintenance, utilities, labor, yield, cleaning time, financing, tariffs for imported equipment, and the value of incremental production. The right machinery decision is the system that produces the strongest risk-adjusted output over its useful life, not simply the lowest purchase order.
| Decision | What to measure | Why it matters |
|---|---|---|
| Add automation | Throughput, labor hours, uptime | Determines productivity gain |
| Replace an older line | Maintenance, energy, rejects, downtime | Tests replacement economics |
| Import equipment | Machine price, tariff, freight, service | Measures landed and lifecycle cost |
| Buy local equipment | Lead time, parts, service coverage | Measures operational resilience |
| Increase capacity | Utilization, bottlenecks, demand | Prevents unnecessary capex |
| Upgrade hygiene | Sanitation time, water, contamination risk | Connects safety improvement to usable capacity |
Supply Chain, Service, and the Machinery Aftermarket
A processing line can remain productive for a decade or longer, which makes the supplier relationship much longer than the original equipment sale. Plants need wear parts, controls support, software updates, lubrication guidance, preventive maintenance, emergency repairs, operator training, and occasionally major rebuilds. The installed base therefore creates recurring aftermarket demand that can be strategically important for both manufacturers and distributors.
Service capability becomes especially important when machinery is imported. A processor may accept a long initial delivery time for a specialized machine, but it cannot tolerate a multi-week delay for a critical spare part during production. Suppliers that maintain regional parts inventory, trained technicians, remote diagnostics, and clear maintenance documentation can reduce operational risk and strengthen customer loyalty.
The trade data makes this point practical. Germany, Italy, the Netherlands, China, the United States, Denmark, France, Spain, Switzerland, and Turkey export large values of machinery. Their customers are distributed across many countries, so the commercial model must extend beyond the factory gate. Export growth without service infrastructure can create installed machines that are difficult to support, which eventually weakens repeat business.
For buyers, the correct comparison is therefore not supplier A versus supplier B on machine specification alone. It is the full operating ecosystem: local commissioning, technician response, parts lead time, remote support, warranty clarity, training, software ownership, and the ease of integrating future line changes. These factors can determine whether a machine remains a productive asset or becomes a bottleneck as the plant evolves.
Market Risks and Constraints
The positive growth outlook does not remove the cyclical and operational risks of machinery investment. Capital equipment is sensitive to financing conditions, business confidence, plant-construction schedules, and customer cash flow. When interest rates rise or food manufacturers become cautious about demand, projects can be delayed even though long-term consumption continues to grow. That creates uneven quarterly and annual order patterns for equipment suppliers.
Input costs can also affect both buyers and manufacturers. Stainless steel, motors, electronics, controls, pumps, sensors, bearings, freight, and skilled engineering labor all influence machine cost. A supplier may face margin pressure if component costs rise after a project is quoted. A buyer may face budget overruns if exchange rates or import charges change between approval and delivery.
Technical risk is equally important. Highly automated equipment can improve productivity but may require capabilities that the plant does not yet have. Maintenance technicians need training, operators need confidence with controls, and the facility needs reliable utilities. A technically advanced machine that cannot be maintained locally may produce more downtime than a simpler alternative.
Finally, annual trade data must be treated as a directional indicator rather than a perfect proxy for end-user demand. Machinery trade is lumpy, classifications can include a range of equipment, and large individual projects can move country totals sharply. The strongest market analysis triangulates trade data with customer pipelines, installed-base information, plant announcements, food-sector investment, and supplier interviews before committing resources.
Food Processing Machinery Market Opportunity Diagnostic
A useful statistics report should end with a diagnostic model rather than a stack of unrelated numbers. The following framework connects the external benchmarks to the questions that machinery manufacturers, distributors, investors, and food processors actually need to answer.
| Problem area | Core signals to measure | Useful benchmark from this report |
|---|---|---|
| Market scale | Revenue estimates, CAGR, forecast horizon | Multiple sources move toward $100B+ around 2030-2031 |
| Import demand | Country import value and growth | Global imports about $14.65B in 2024 |
| Export capability | Export value, growth, supplier concentration | Global exports about $17.49B in 2024 |
| Regional opportunity | Regional share and import scale | Asia-Pacific reported at about 43% in one dataset |
| Country momentum | YoY change plus multi-year trend | Turkey +62.3%; Brazil +37.0%; India +13.8% in 2024 |
| Market access | Tariffs, logistics, certification, service | Selected MFN rates range from free to about 10% |
| Customer economics | Throughput, labor, yield, downtime | Use total-cost and capacity metrics rather than price alone |
Diagnostic principle
Large markets, fast-growing markets, and easy-to-enter markets are not always the same places. A strong opportunity score combines demand scale, momentum, import dependence, competitive intensity, tariffs, service requirements, customer economics, and the supplier’s ability to support the installed base after commissioning.
90-Day Food Processing Machinery Benchmark Plan
External statistics become more useful when they are translated into a repeatable research cycle. A 90-day benchmark process can turn a broad global market into a practical list of segments and countries worth deeper commercial investigation.
| Timing | What to do | Output |
|---|---|---|
| Days 1-30 | Benchmark global market estimates, machinery categories, import/export flows, and priority countries. | A baseline showing where equipment demand and supply are concentrated. |
| Days 31-60 | Compare target countries by absolute imports, recent growth, tariffs, domestic supplier strength, and likely customer sectors. | A short list of high-priority market and equipment combinations. |
| Days 61-90 | Add customer economics, distributor coverage, service availability, installed-base clues, and project-level evidence. | A commercial scorecard for product, country, and channel prioritization. |
Planning principle
Do not chase every high-growth country. Prioritize combinations where meaningful market size, customer investment, accessible channels, manageable landed cost, and service capability reinforce one another. The purpose of the statistics is to narrow the opportunity, not to replace commercial validation.
Metrics Food Processing Machinery Leaders Should Track
The final scorecard should be detailed enough to locate opportunity and risk without becoming a vanity dashboard. Market metrics should sit beside plant-level operating metrics because equipment demand is ultimately created by production constraints and investment economics.
| Metric | Why it matters |
|---|---|
| Global market size | Establishes overall industry scale and forecast direction. |
| Market CAGR | Shows long-term expansion under a consistent source definition. |
| Regional market share | Identifies major demand zones but needs country validation. |
| Country import value | Measures the scale of imported machinery demand. |
| Import growth | Highlights short-term investment momentum. |
| Country export value | Identifies manufacturing hubs and competitive supply bases. |
| Tariff rate | Affects landed equipment cost and market competitiveness. |
| Installed capacity | Helps estimate replacement and expansion opportunity. |
| Equipment utilization | Shows whether current assets are approaching a capacity constraint. |
| Downtime | Measures lost production and maintenance pain. |
| Maintenance cost | Supports repair-versus-replace economics. |
| Throughput | Measures productive output from machinery investment. |
| Yield / waste | Shows how effectively raw material becomes saleable product. |
| Energy and water use | Connects machinery design to operating cost. |
| Service lead time | Measures the resilience of the supplier and aftermarket network. |
Food Processing Machinery Market Statistics FAQ
What is the size of the food processing machinery market?
Published estimates vary because research firms define the market differently. One 360iResearch estimate places food processing equipment at $68.70 billion in 2024, while Research and Markets reports about $72.5 billion under its scope. Broader machinery definitions can exceed $100 billion. The important point is to compare forecasts within the same source methodology rather than averaging incompatible market definitions.
How fast is the food processing machinery market growing?
The research set generally points to mid-single-digit or high-single-digit annual growth. Examples include 5.3%, 5.61%, 5.7%, 6.0%, 6.52%, and 8.0% CAGRs from different sources and market definitions. These figures should be treated as source-specific forecasts, but together they indicate continued expansion rather than a flat mature market.
Which region has the largest food processing equipment market?
One Meticulous Research dataset cited in the workbook assigns Asia-Pacific about 43% of global food processing equipment market share in 2024, equal to roughly $30.38 billion under that source’s definition. Regional rankings can differ by market scope, so the share should be presented with its source rather than as a universal figure.
Which country imports the most food processing machinery?
The United States is the largest individual importer in the PMMI/Trade Data Monitor HS 8438 table, with approximately $2.04 billion of imports in 2024. Mexico followed at about $645.4 million, Canada at $588.1 million, France at $568.0 million, and Germany at $553.9 million.
Which countries export the most food processing machinery?
Germany led the 2024 exporter table at approximately $2.85 billion, followed by Italy at $2.74 billion and the Netherlands at $2.38 billion. China exported about $1.76 billion and the United States about $1.29 billion. The rankings demonstrate the strength of European machinery engineering while also showing substantial supply from China and North America.
Which machinery import markets grew fastest in 2024?
Among notable markets in the dataset, Turkey increased 62.3%, Saudi Arabia 54.6%, Brazil 37.0%, South Korea 25.6%, Iran 19.8%, Spain 19.1%, Belgium 19.1%, and India 13.8%. Because capital-equipment imports are project-driven, one-year growth should be checked against multi-year trends before being treated as structural.
What equipment categories are included in HS 8438?
The classification covers industrial machinery used for preparation or manufacture of food or drink, including bakery and pasta machinery, confectionery and cocoa machinery, sugar-manufacturing equipment, brewery machinery, meat and poultry preparation machinery, fruit and vegetable preparation machinery, other food and beverage processing machinery, and parts. Machinery for extraction or preparation of fixed vegetable or animal fats and oils is outside this specific heading.
Final Takeaway
Food processing machinery is a large global capital-equipment market supported by five systems working together: growth in food production, automation, equipment replacement, international machinery trade, and regional industrial investment. Published forecasts differ in scope, but several place the market near or above $100 billion around 2030–2031, while broader definitions move substantially higher. At the same time, global HS 8438 imports reached about $14.65 billion and exports about $17.49 billion in 2024, showing how dependent the industry is on cross-border equipment supply.
The strongest market analysis therefore goes beyond the headline CAGR. If a country imports large volumes but growth is slowing, the opportunity may center on replacement and service. If imports are rising rapidly, the more important question is whether new factories, category expansion, or a few large projects are driving the change. If tariffs are high or service infrastructure is weak, strong demand may still be difficult to convert into profitable sales.
For machinery suppliers, the practical goal is to find markets where customer investment, import demand, competitive positioning, landed cost, and aftermarket support align. For food processors, the objective is to choose equipment that improves profitable output over its full operating life. That means looking beyond purchase price to throughput, uptime, labor, yield, sanitation, energy, maintenance, parts availability, and service response.
The statistics point to a market with durable long-term demand but significant local variation. The most attractive opportunities will be where food-production growth, high equipment utilization, expanding automation, manageable market-access costs, and reliable technical support reinforce one another. Those are the conditions most likely to turn machinery investment into sustained production gains and recurring supplier value.