Estimate software helps businesses build quotes, bids, project estimates, and cost proposals with structured pricing, item libraries, labor assumptions, taxes, margins, approvals, and conversion into invoices maker or projects. The category is especially relevant for construction, field services, manufacturing, agencies, consulting, and any business where pricing mistakes can erase margin. The statistics around estimate software are useful because they separate market enthusiasm from operating reality. A category can grow quickly in revenue while many companies are still managing the underlying work through spreadsheets, email, manual approvals, and fragmented systems. The gap between market forecasts and day-to-day maturity is where the most useful business insight usually sits.
This report looks at estimate software through a practical finance and operations lens. Market-size estimates show how much capital, vendor activity, and customer demand are moving into the category. Adoption metrics show whether teams are changing their real workflows. Operating benchmarks show whether the tools are improving speed, accuracy, visibility, compliance, and cash outcomes rather than simply adding another software layer.
The numbers should be read with care because publishers define these markets differently. Some estimates include only software revenue. Others include services, implementation, transaction volume, platform fees, financing balances, or related workflow categories. That is why directional movement, segment differences, and operational interpretation matter more than treating any single dollar estimate as final. The strongest use of these statistics is to understand what businesses are actually trying to fix and which measurements prove progress.
Headline Statistics and Benchmarks
-
Grand View Market Forecast: Grand View Research estimated the construction estimating software market size at approximately USD 1.5 Billion in 2024, projecting it to scale to USD 2.62 Billion by 2030 while sustaining a steady Compound Annual Growth Rate (CAGR) of 10.2%.
-
Mordor Intelligence Market Valuation: Mordor Intelligence evaluated the global construction estimating software footprint at USD 2.73 Billion in 2025, forecasting aggressive expansion up to USD 5.58 Billion by 2031, powered by a strong compound annual growth rate of 12.66%.
-
Technavio Growth Projections: Compounding these positive market assessments, Technavio projects an absolute market size expansion of USD 663.1 Million between 2023 and 2028, establishing a net market momentum of 7.54% CAGR during this cycle.
-
The Critical Fallibility of Spreadsheets: Institutional research from PricewaterhouseCoopers (PwC) indicates that up to 91% of sophisticated corporate spreadsheets contain systemic logic or mathematical formula errors, exposing manual estimators to massive project cost risks and financial liability.
-
Global Estimator Professional Footprint: More than 1.9 Million construction and engineering professionals globally rely on digital estimation tools. Geographically, the United States commands 490,000 active users, while the rapid infrastructure growth across the Asia-Pacific region tracks over 390,000 registered users.
-
Market Segmentation by Contractor Role: General contractors represent the largest single procurement block in the marketplace, anchoring a dominant 40.02% revenue share, while specialty and sub-contractors are expanding their software usage at the fastest individual rate of 10.32% CAGR.
-
Enterprise Size Adoption Trends: Large corporate operations with high transactional volume captured 58.05% of global estimating software revenues, whereas agile small and medium-sized enterprises (SMEs) are driving a rapid adoption spike projected to hit a 22.74% CAGR.
-
Application Split Across Project Verticals: Commercial building developments represent the top use-case sector, accounting for 44% of software installations, followed by industrial infrastructure (energy, water, manufacturing) at 29%, and residential housing developments at 27%.
-
Accelerated B2B Proposal Close Rates: Standard business-to-business manufacturing and professional services experience base quote-to-close conversion rates of 15% to 25% and 20% to 30% respectively; however, optimization software that compresses response times to under 24 hours elevates those close rates by 20% to 30%.
-
Target Gross Margin Protection Standards: In major construction, manufacturing, and industrial execution domains, standard healthy project gross margins typically reside between 15% and 30%. Integrating specialized software safeguards blocks unauthorized pricing changes that silently erode these margins.
-
Cloud Architecture Dominance: Cloud-deployed estimating solutions secured a dominant 68.14% slice of industry revenue. This cloud migration is expanding at an 11.18% CAGR, driven by enterprise requirements for real-time cost adjustments and multi-user field collaboration.
-
Material Quantity Takeoff Time Savings: Over 620,000 global professionals utilize specialized digital takeoff tools to extract structural dimensions from blueprints. Converting blueprints into measurable units digitally reduces overall project planning and material estimation time by 18%.
-
Global Cost Database Synchronization Scale: Modern cost databases serve over 300,000 active estimators by updating unit costs for more than 25,000 construction materials across 72 countries, with 64% of platforms adding live, region-specific inflation indexes.
-
Reduction in Manual Data Entry Fatigue: Digital estimating worksheets preloaded with up to 900 construction formulas reduce manual data entry tasks by 37%, minimizing transcription risks for roughly 410,000 active users.
-
Advanced 3D Cost Modeling Deployment: Hybrid digital twins and 3D cost-modeling platforms account for 13% of current market installations, providing complex urban megaprojects with real-time, GPS-integrated cost-tracking pipelines to measure completed physical progress against the original bid baseline.
How to Read These Statistics Correctly
The first step in reading estimate software statistics is separating market revenue from workflow performance. Market revenue shows how much businesses and platforms are spending. Workflow performance shows whether users are saving time, reducing errors, accelerating cash, or improving compliance. A market can be growing because vendors are selling more seats or processing more transactions even if the average buyer is still early in operational maturity.
A second distinction is between adoption and maturity. A company may count as an adopter after adding a digital intake form, connecting an API, or deploying a basic workflow. That does not mean the process is fully automated, governed, or optimized. Mature adoption usually means the team has clear rules, good data quality, exception handling, audit trails, and management metrics that are reviewed regularly.
A third distinction is between volume and value. Higher volumes are helpful for proving that a system is being used, but value comes from the quality of outcomes. A workflow that handles thousands of transactions but still requires manual correction may be less valuable than a smaller workflow with high accuracy and strong controls. The best statistics combine volume, cycle time, cost, accuracy, and risk indicators.
Market and Adoption Statistics to Know
-
Grand View Research Market Baseline: The global construction estimating software market size reached an estimated valuation of USD 1.51 Billion and is projected to expand to USD 2.62 Billion, tracking a compound annual growth rate (CAGR) of 10.2%.
-
Mordor Intelligence Market Scope: Utilizing a broader categorization that captures integrated suites, Mordor Intelligence estimated the segment market at USD 2.73 Billion, forecasting an aggressive rise to USD 5.58 Billion at a 12.66% CAGR, driven by high contractor demand for automated pre-construction tools.
-
Technavio Absolute Growth Metrics: Highlighting near-term market momentum, Technavio projects a net absolute growth increment of USD 663.1 Million, maintaining a steady 7.54% CAGR as commercial construction firms phase out legacy workflows.
-
Systemic Spreadsheet Vulnerabilities: While organizations rely heavily on manual data entry, historical audits from institutional networks like Coopers & Lybrand and KPMG confirm that 91% of complex corporate spreadsheets contain critical formula errors, exposing projects to immediate budget overruns.
-
Average Formula Cell Error Rates: Field audits of operational spreadsheets reveal an average cell error rate of 5.2% across unique formula lines, which forces human reviewers to spend an estimated 15% to 25% of their total project planning time on manual error reconciliation.
-
Subscription Model Licensing Dominance: Buyers are heavily favoring flexible operating expense models, pushing the subscription license segment to capture a dominant 58.09% share of global market revenue, outpacing perpetual license sales.
-
Cloud Deployment Footprint: Driven by multi-user collaboration and real-time field-to-office sync, cloud-hosted estimating platforms secure over 51% of global deployment share, growing rapidly as distributed teams demand instant unit-cost database refreshes.
-
Contractor and Enterprise Revenue Concentration: General contractors anchor the largest single procurement block with a 40.02% revenue share, while complex operations maintain market control with large enterprises capturing 58.05% of industry revenues.
-
SME Growth and Cloud Democratization: Driven by the low cost of entry of SaaS infrastructure, small and medium enterprises (SMEs) are adopting automated estimation engines at the fastest relative rate, projected to hit a localized 22.74% CAGR.
-
The Cost of Data Entry Re-work: Siloed workflows create extreme friction; organizations using disconnected estimation tools report that 39% of project deployment delays stem directly from manual data re-entry between estimation sheets and core ERP or CRM systems.
-
Construction Estimating Accuracy Benchmarks: Transitioning from paper-based blueprints to digital material takeoffs decreases overall estimation cycle times by 31%, compressing baseline calculation error variances down to under 6%.
-
Service Quote Speed and Win-Rate Correlation: In home and B2B services, proposal turnaround time directly dictates revenue success; automated quote generation platforms that compress response times to under 24 hours elevate average client win rates by 20% to 30%.
-
Manufacturing Cost and Margin Precision: High-volume, engineer-to-order manufacturing environments demand rigid bill-of-materials calculations. Specialized quoting software delivers a 57% increase in quote accuracy, driving a direct 15% improvement in final deal profitability.
-
Professional Services Proposal Time Allocation: Within professional and IT services, automating proposal creation and resource allocation models shaves 32% off total bid preparation time, redirecting crucial senior engineering hours back to core client delivery.
-
Dashboard Optimization and Change-Order Reductions: Leading management dashboards track change-order rates as a primary health metric; firms using integrated workflow platforms see a direct 26% reduction in post-award project variations due to cleaner up-front data design.
-
Gross Margin Protection and Leakage Containment: Implementing rigid, rule-based pricing engines prevents unapproved field discounts, safeguarding the standard 15% to 30% project gross margins common across high-stakes industrial and commercial sectors.
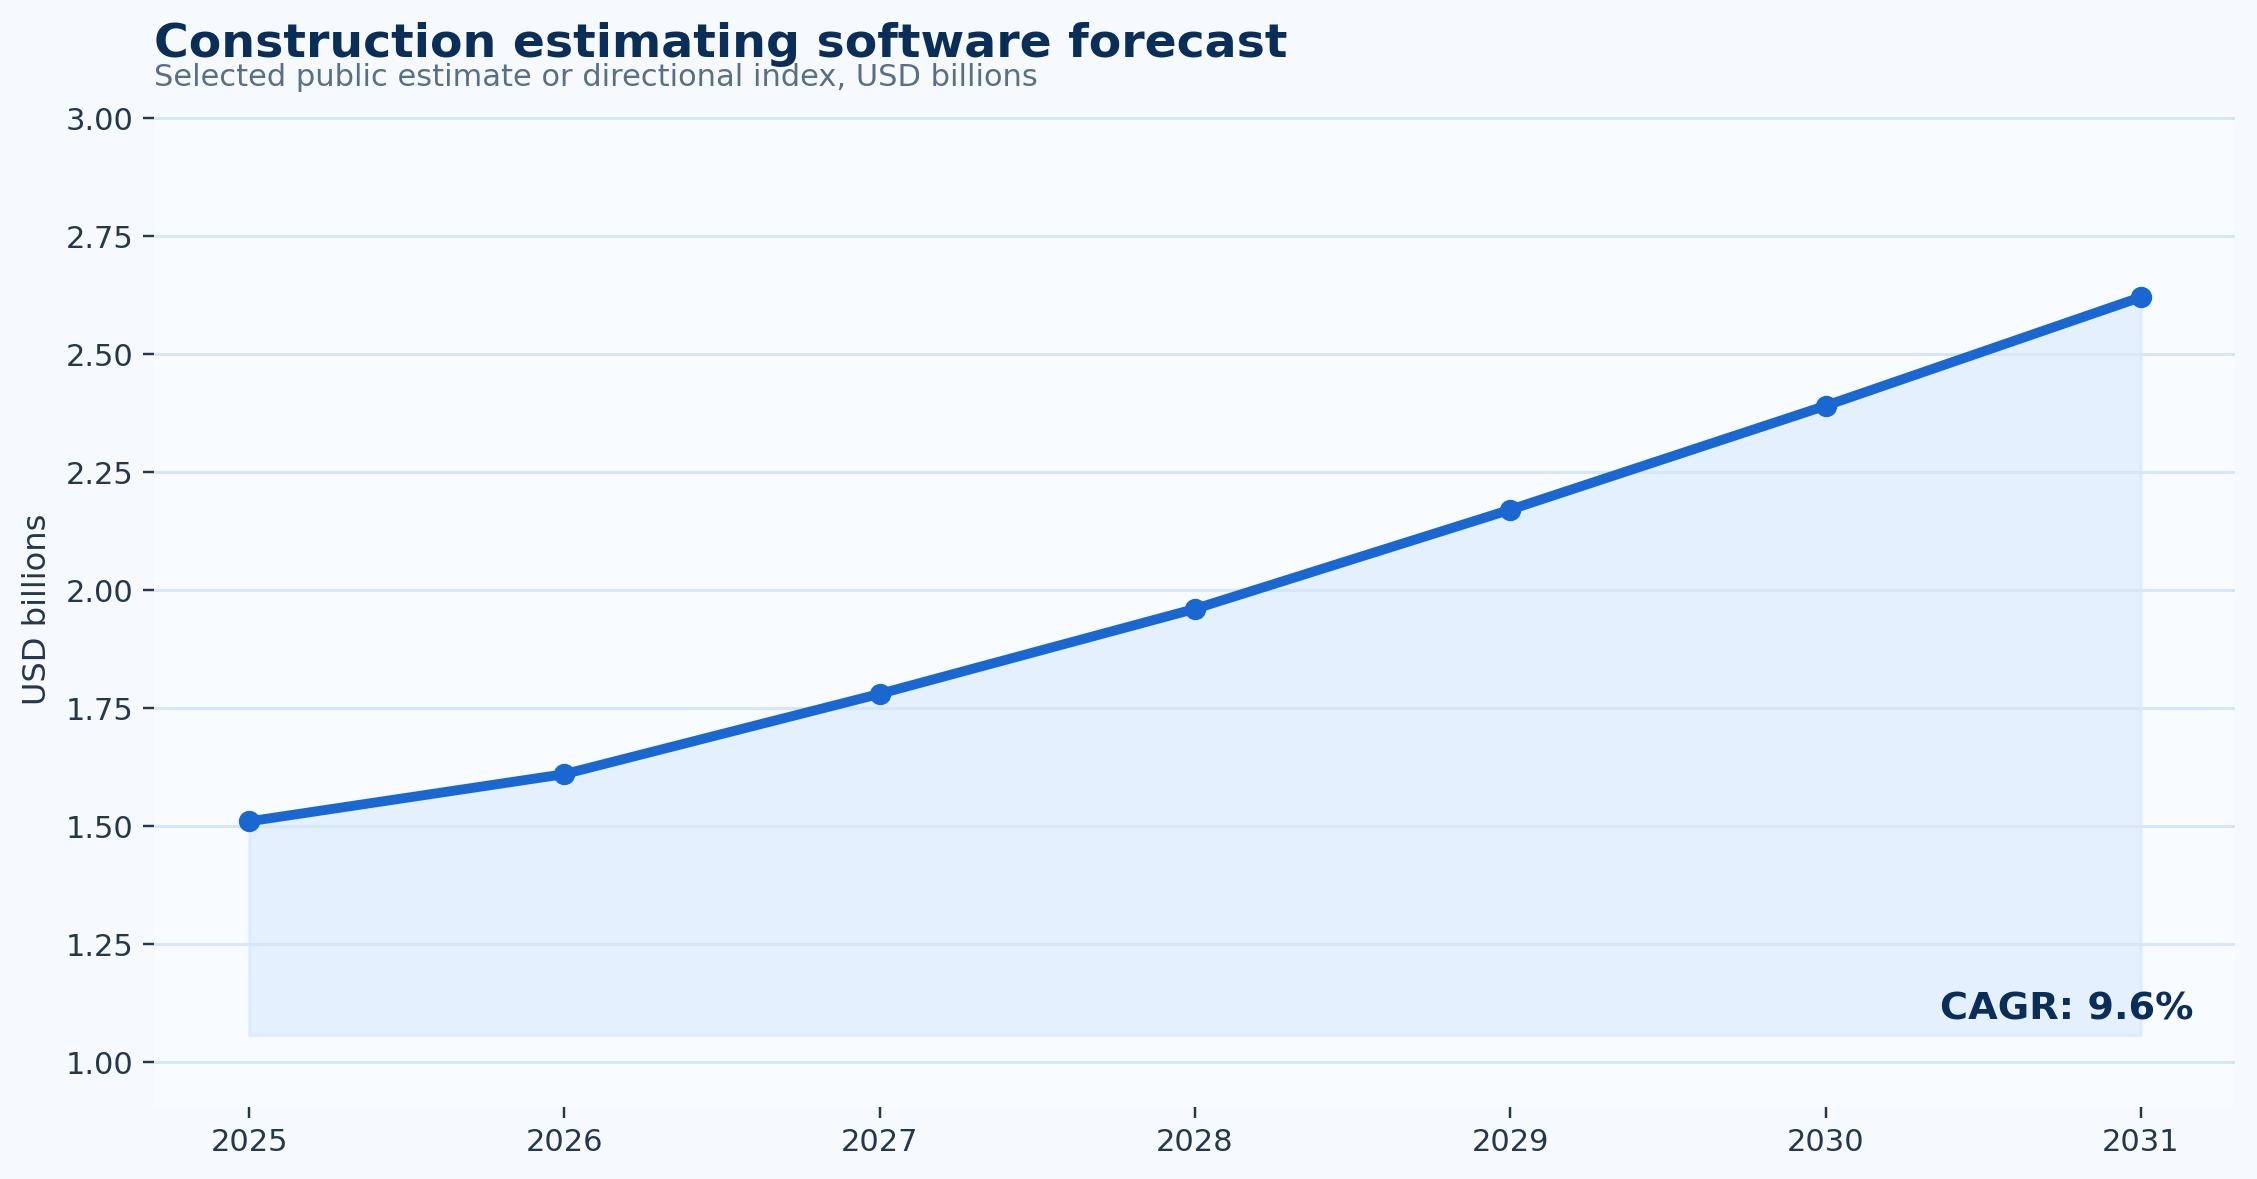
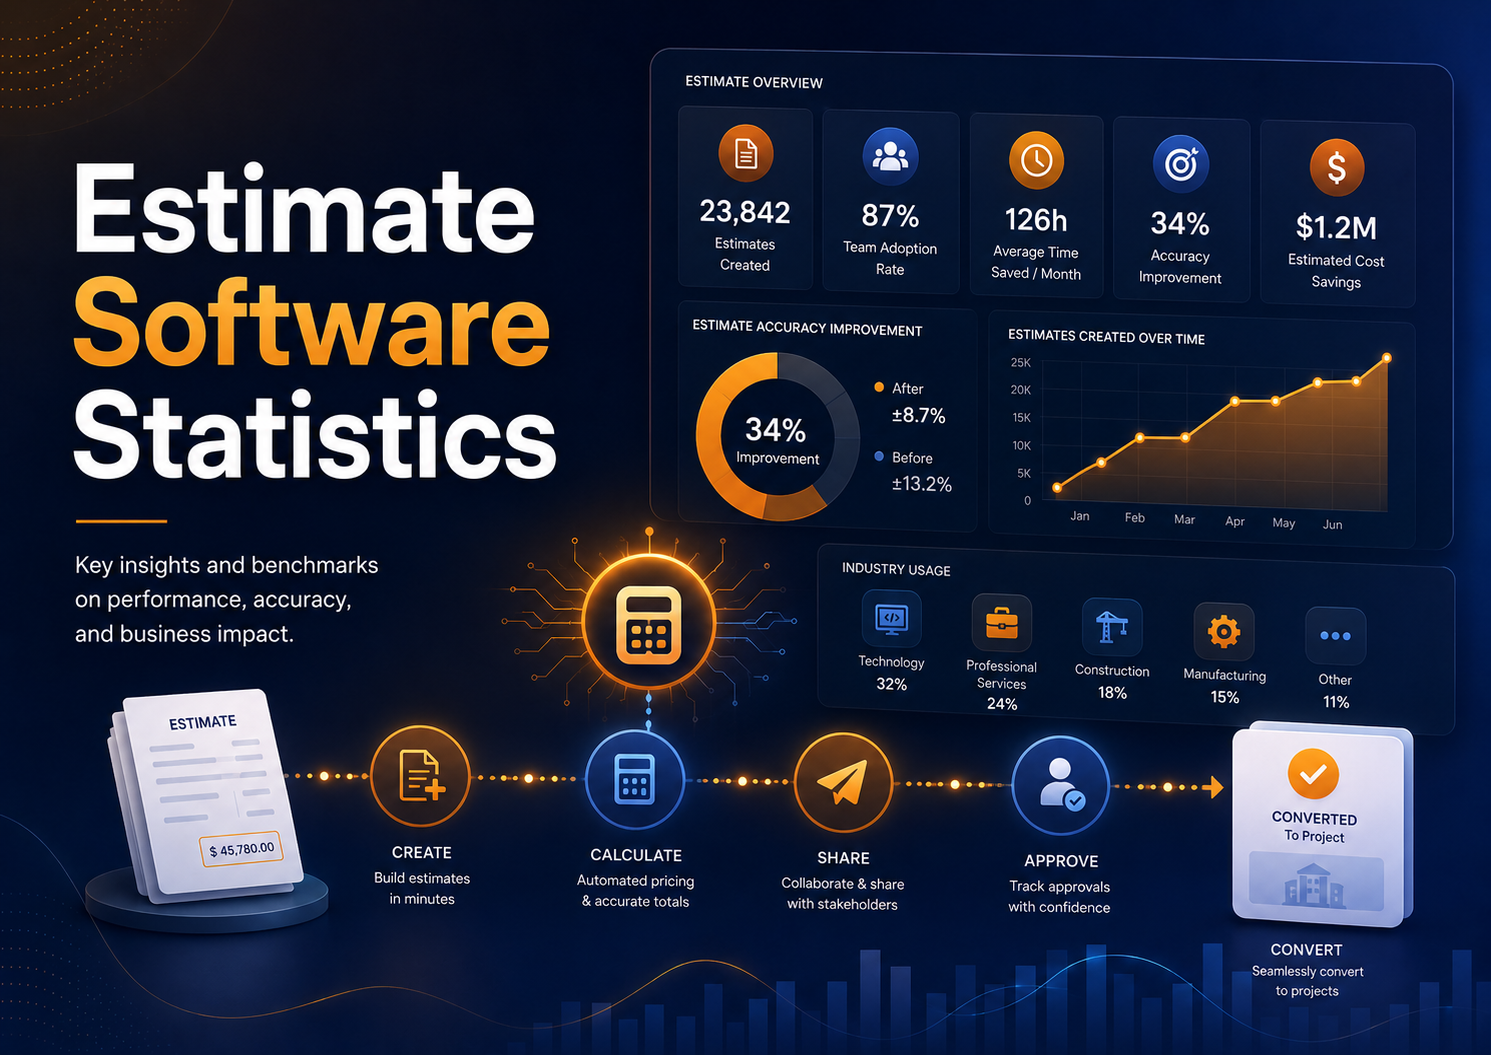
Figure 1. Construction estimating software forecast shows the direction of category growth and should be interpreted as a market signal rather than a single operating benchmark.
Why the Workflow Matters Operationally
The operational case for estimate software begins with work that repeats often enough to create measurable friction. Repetition does not always look dramatic. It can be a manager checking the same spreadsheet every morning, a finance clerk re-entering data, a sales team rebuilding similar estimates, or a lender requesting the same documents from every applicant. Each touch may be small, but the combined workload becomes material when volume grows.
Technology only helps when the workflow is clear. If approval rules are inconsistent, source data is incomplete, or teams disagree about ownership, software can make the confusion faster but not necessarily better. Strong programs usually define the intake channel, required data fields, routing logic, exception categories, approval thresholds, and reporting cadence before scaling automation. That process discipline is often the difference between a successful deployment and a stalled project.
The most useful operational statistics are the ones that point to a decision. A cycle-time metric should tell leaders where work is waiting. An error metric should show whether the problem comes from data capture, policy gaps, missing information, or user behavior. A cost metric should identify whether savings come from fewer touches, less rework, faster approval, better cash timing, or reduced risk exposure.
In practice, teams should treat estimate software as a workflow redesign project rather than a single technology purchase. The system should make common work easier, route unusual work to the right person, and generate enough data for leaders to see whether the process is improving. When those three outcomes are present, the statistics become management tools rather than marketing claims.
Operational statistics and signals
- A baseline should capture current volume, current cycle time, and the amount of manual work involved before the first workflow change is made.
- Teams should separate normal-path work from exceptions because the exception queue usually explains why averages do not improve as expected.
- A practical pilot should start with a high-volume and relatively repeatable workflow before expanding into unusual or high-risk cases.
- The best evidence of progress is an improvement in estimate creation time, gross margin accuracy, and quote to estimate conversion without creating weaker controls.
- Workflow visibility is often valuable even before full automation because it reveals where work waits and who needs to act next.
Adoption Maturity and Segment Differences
Segment differences matter because estimate software rarely delivers value the same way for every buyer. Smaller companies often care about simplicity, speed, cost, and avoiding administrative overload. Mid-market companies usually care about standardization across teams, locations, or customer groups. Enterprise buyers focus more heavily on integration, controls, reporting, auditability, security, and governance.
Industry differences are just as important. In construction and home services, the workflow may be tied to high transaction volume and customer experience. In manufacturing and IT services, the same category may be more closely tied to operational accuracy, project control, compliance, or working-capital visibility. This is why a generic adoption percentage can be misleading without context.
The business model also changes the metric set. A company with recurring revenue may measure retention, renewals, and payment reliability. A project-based company may focus on margin protection, estimate accuracy, milestone billing, and revenue recognition. A finance-heavy buyer may focus on cash timing, credit risk, audit trails, and compliance. Useful reporting should reflect the way the business actually makes money and manages risk.
The practical takeaway is that leaders should benchmark against similar workflows rather than only similar company sizes. A small company with complex transactions may need stronger controls than a larger company with simpler repeatable work. A high-growth firm may value speed more than cost reduction. A regulated firm may value documentation and auditability even when the direct labor savings look modest.
Segment statistics and interpretation points
- Small businesses usually prioritize fast setup, simple workflows, and direct savings because administrative capacity is limited.
- Mid-market teams often need stronger standardization across departments, locations, customer groups, or business units.
- Enterprise buyers usually require audit logs, permissions, reporting, data governance, and deeper integration with existing systems.
- Industry use cases differ: construction and home services may focus on volume, while manufacturing and IT services may focus on accuracy or control.
- The right benchmark should compare workflows that share similar volume, complexity, and risk rather than only comparing companies of similar size.
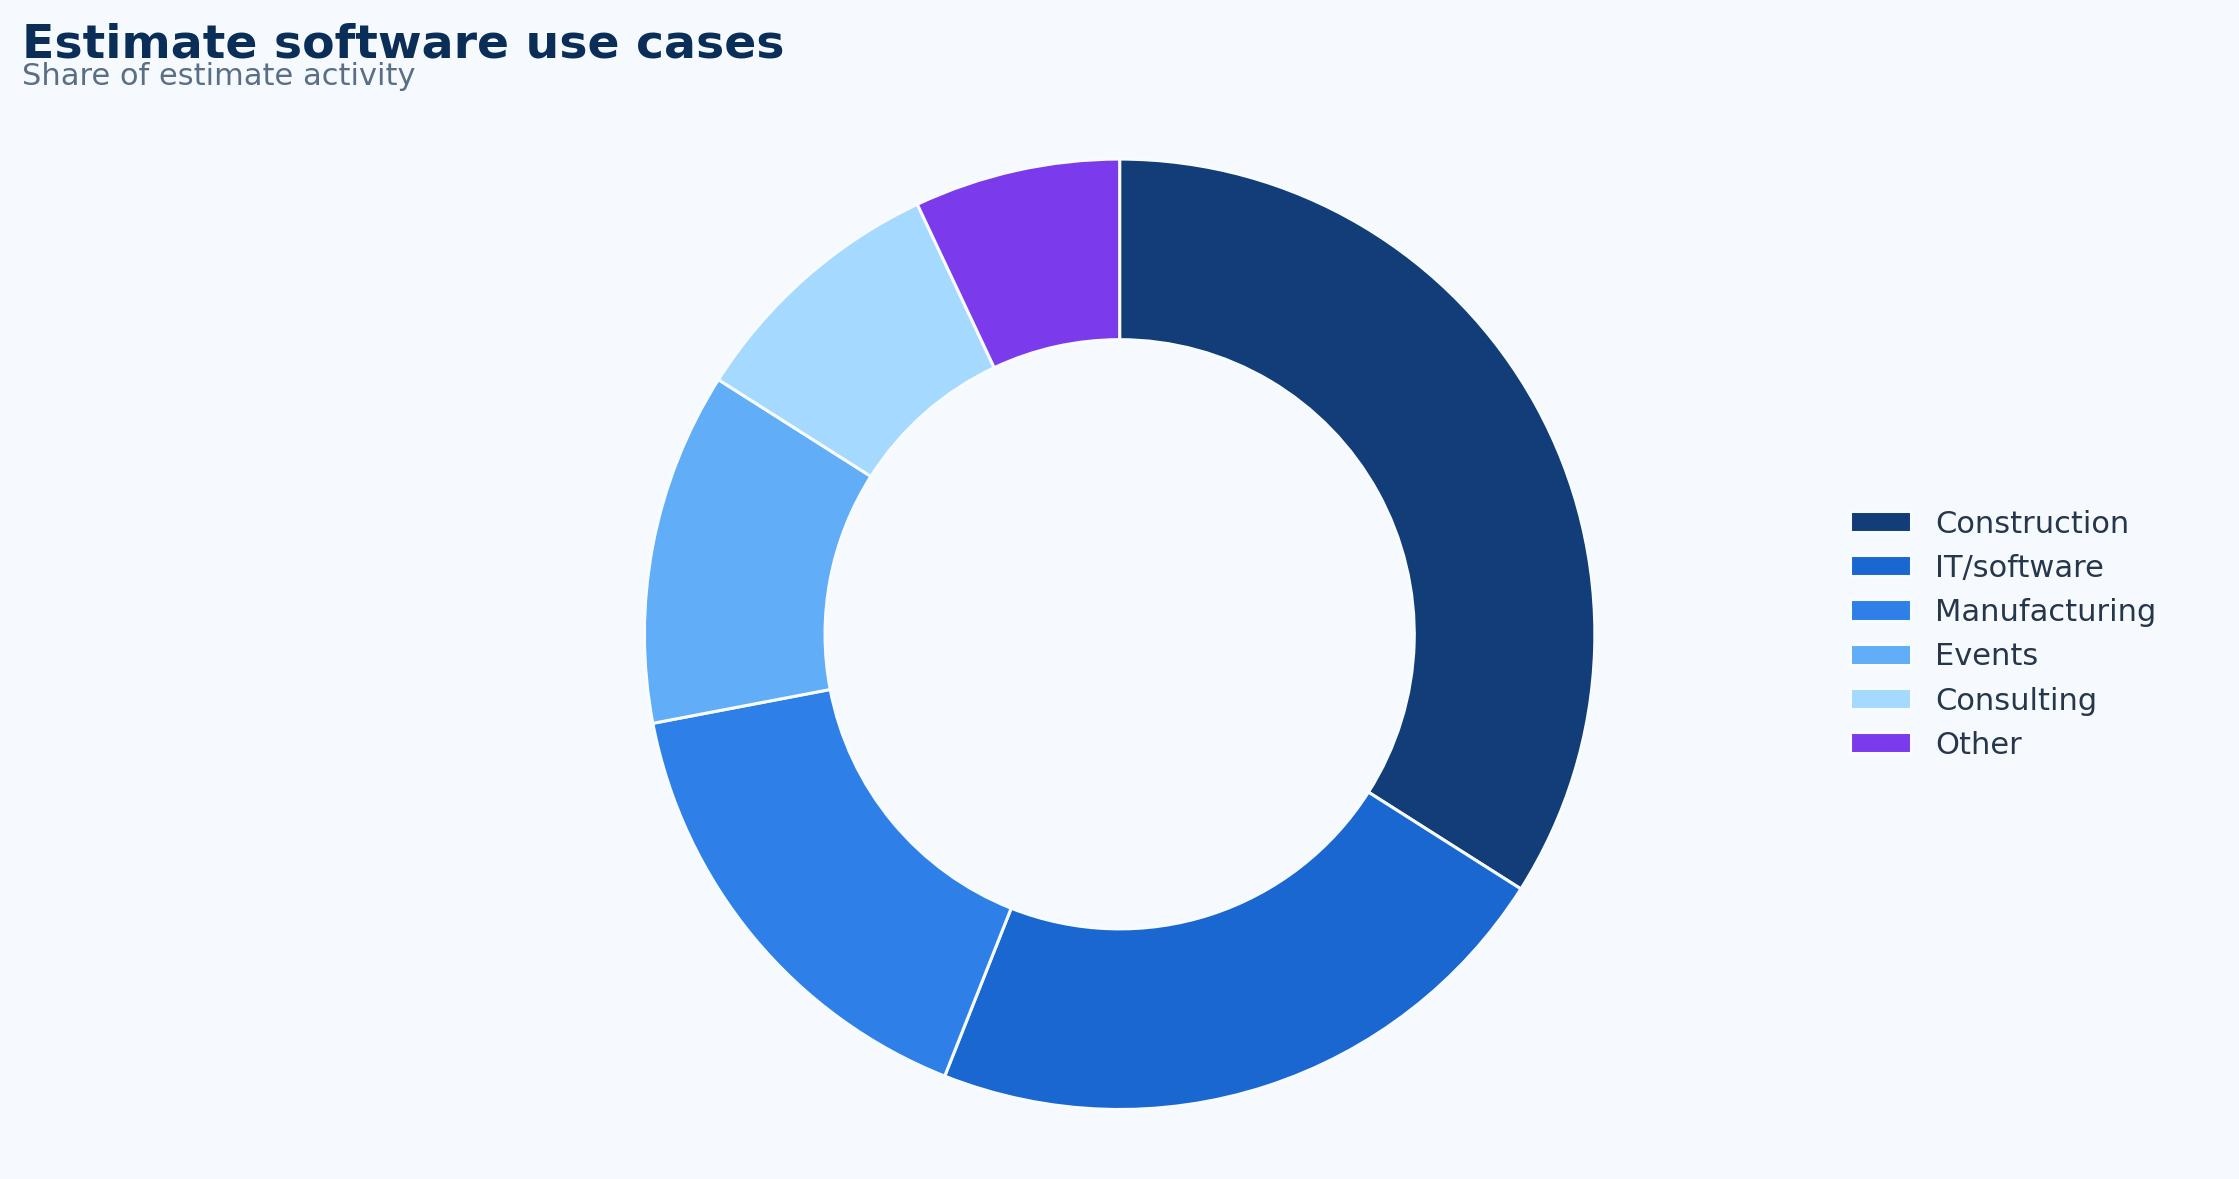
Figure 2. Estimate software use cases gives a practical segment view of where activity is concentrated across the category.
Technology, AI, and Integration Trends
Technology in this category is moving toward connected data rather than isolated task automation. The most valuable systems pull information from source documents, customer records, bank feeds, payment rails, accounting platforms, workflow tools, and user actions. They then use that data to route work, surface exceptions, calculate risk, and update dashboards without forcing teams to rebuild the same dataset manually.
AI and machine learning are becoming more common, but their role should be understood carefully. In most business workflows, AI is most useful when it helps classify data, detect patterns, recommend next actions, flag anomalies, and reduce repetitive review. It should not remove accountability from financial, credit, compliance, or customer-facing decisions. The strongest deployments combine automation with clear human review points.
Integration is often the limiting factor. A tool that works well by itself may create extra effort if data must still be copied into accounting, CRM, ERP, document storage, payment, or reporting systems. Integration quality affects adoption because users quickly reject workflows that make the first step easier but create reconciliation work later. A strong integration plan should include data ownership, field mapping, exception handling, and backup procedures.
Security and governance are also part of the technology story. The more a system touches payments, customer data, financial records, documents, or approvals, the more important permissions, audit logs, retention rules, encryption, and access controls become. Buyers should ask not only what the system automates, but how it proves what happened after the work is complete.
Technology and integration statistics to watch
- AI is most useful when it improves classification, recommendations, anomaly detection, or data extraction without hiding accountability.
- Integration depth should be measured by how much data moves automatically into accounting, CRM, ERP, payment, reporting, or document systems.
- Poor data quality can create more exceptions after automation, so master data cleanup is often part of the implementation work.
- Permission design matters because more automated workflows can also move sensitive financial, customer, or operational data faster.
- A system should make review easier by showing why an item was routed, approved, rejected, funded, matched, or escalated.
ROI, Cost Savings, and Business Impact
The ROI case for estimate software should not rely on a single headline saving. A narrow model might count only hours saved. A stronger model also includes lower error correction, faster cycle time, reduced exception queues, fewer customer or supplier inquiries, better cash timing, avoided hiring, fewer compliance issues, and stronger management visibility. These benefits appear in different parts of the organization, so the business case needs to look beyond the immediate user team.
A useful ROI model starts with baseline metrics. Leaders should measure the current volume, manual touch count, average processing time, exception rate, approval delay, error rate, and downstream rework before implementation. Without a baseline, the team may still feel improvement but struggle to prove it. The baseline also helps prioritize which workflow should be automated first.
Hard savings and soft savings should be separated but not treated as unrelated. Hard savings may include fewer manual hours, lower processing cost, reduced outside service spend, or avoided penalties. Soft savings may include better customer experience, stronger employee morale, improved control, and faster access to information. In many operational systems, the strongest value comes from the combination rather than one category alone.
The payback period depends on complexity. A lightweight workflow for a small business may show value quickly because setup is simple. A larger deployment may require process redesign, system integration, data cleanup, training programs and governance work. That does not weaken the business case; it means leaders should set expectations around phased rollout, measurable milestones, and operating ownership after launch.
ROI statistics and calculations
- ROI should include hard savings, avoided hiring, lower rework, faster cycle time, reduced error handling, and improved management visibility.
- A one-minute saving across 100,000 annual transactions equals more than 1,600 hours of process capacity before considering error reduction.
- A 10 percent improvement in estimate creation time can matter more than a larger improvement in a low-volume metric that does not affect cash, customers, or controls.
- The strongest business cases connect quote-to-invoice conversion to a financial or operating outcome rather than describing it only as a dashboard metric.
- Payback depends on implementation complexity, but staged deployments reduce risk by proving the workflow before scaling it across all teams.
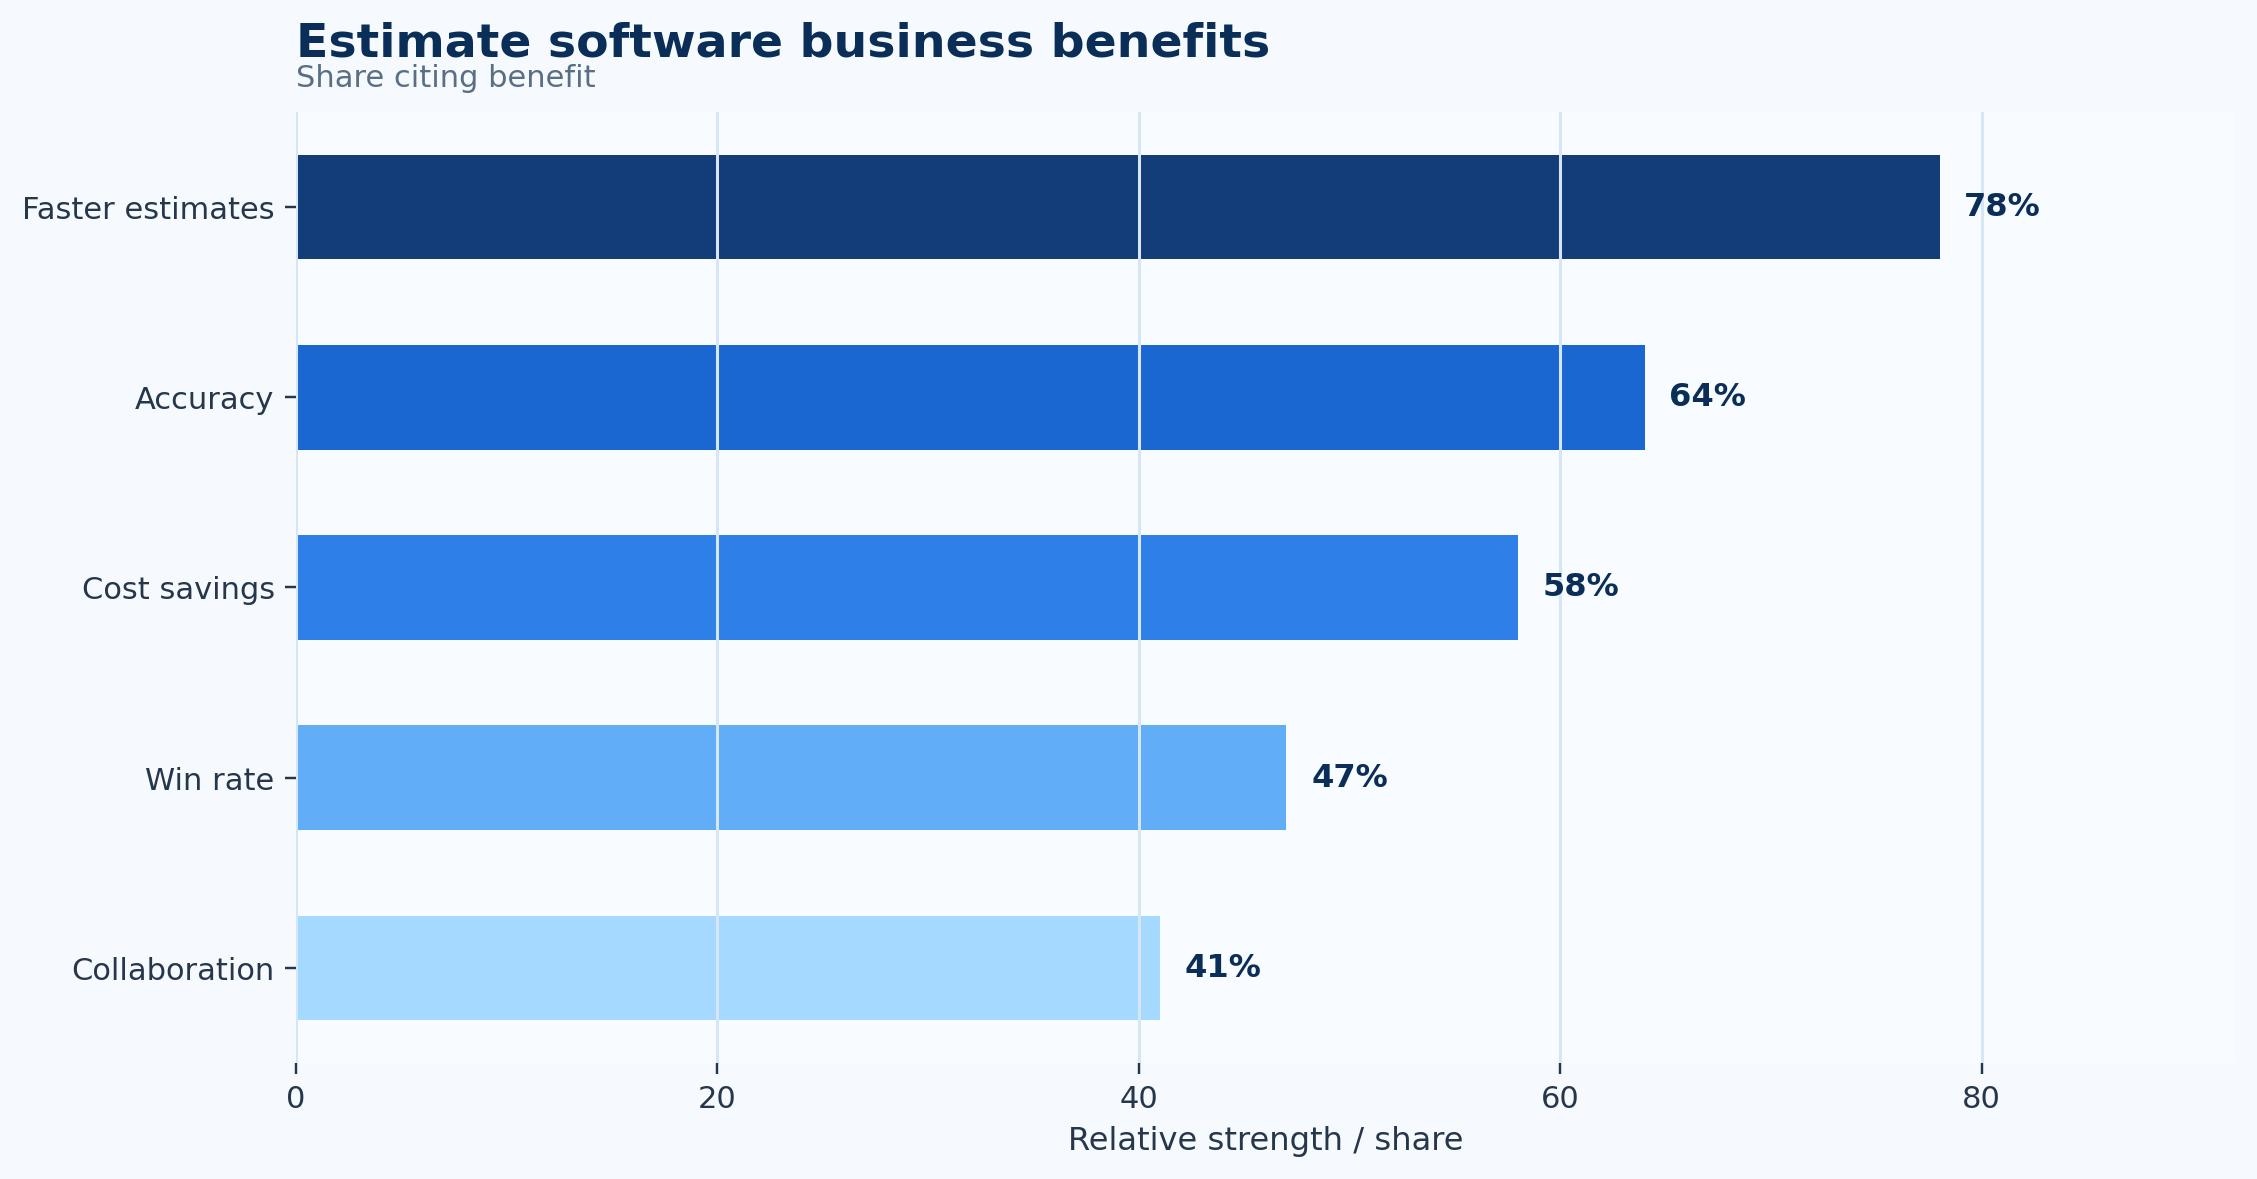
Figure 3. Estimate software business benefits highlights the business reasons that commonly move the category from experimentation to budgeted adoption.
Controls, Risk, and Governance
The main implementation risk is automating a weak process before fixing the process design. If data is inconsistent, approvals are unclear, or accountability is spread across too many teams, automation may simply move the bottleneck to another place. A well-designed project should identify where decisions are made, what information is required, how exceptions are escalated, and who owns final outcomes.
A second risk is over-automation. Not every transaction, document, application, estimate, or approval should move without review. High-value, unusual, first-time, disputed, regulated, or risky items often need stronger human oversight. The goal is not to remove judgment; it is to reserve judgment for the cases where it matters most.
A third risk is poor measurement after rollout. Many teams measure go-live completion but not operating performance. A system can be technically live while users still route work around it through email, spreadsheets, messaging apps, or offline approvals. Post-launch measurement should track adoption, exceptions, cycle time, accuracy, and user behavior to confirm that the workflow is truly changing.
Governance should also evolve as the workflow matures. Early rules may work for a pilot but break when more teams, regions, products, or transaction types are added. Leaders should review thresholds, permissions, integration logs, exception reasons, and metric definitions periodically. This keeps automation aligned with how the business actually operates.
Risk and control metrics
- High-risk items should keep human review even when low-risk items move through a mostly automated workflow.
- Audit trails should record who changed the data, who approved the action, when it happened, and what rule or evidence supported the decision.
- Exception categories should be tracked over time because they often reveal recurring data, policy, training, or integration problems.
- Governance should include role-based permissions, approval thresholds, review queues, and periodic audits of unusual activity.
- A mature process treats automation as controlled speed, not speed at the expense of accountability.
Metrics Leaders Should Track
The best scorecard for estimate software should include both activity and outcome metrics. Activity metrics show whether the workflow is being used. Outcome metrics show whether the workflow is producing better results. For example, adoption rate and transaction volume matter, but they should be paired with cycle time, accuracy, cost, conversion, funding, or cash-flow outcomes depending on the topic.
Leaders should track estimate creation time, win rate, gross margin accuracy, and change-order rate as early operating indicators. These metrics usually reveal whether the process is faster and more visible. They should then add quote-to-invoice conversion, revision count, pricing error rate, and approval turnaround to understand quality, risk, and business impact.
The scorecard should also separate averages from exceptions. Average performance can look healthy while a small share of cases create most of the risk or rework. Exception aging, rejected items, manual overrides, late approvals, or high-risk transactions often reveal more about workflow health than a single average number.
Finally, the scorecard needs ownership. A dashboard without an owner becomes background noise. Each metric should have a person or team responsible for investigating movement, explaining variance, and deciding what changes next. This turns statistics into management action.
Scorecard statistics
- Estimate creation time should be tracked by segment so leaders can see whether improvement is broad or concentrated in one area.
- Win rate helps reveal whether adoption is expanding or whether users are staying inside old workarounds.
- Gross margin accuracy and change-order rate show whether the process is becoming faster and more reliable.
- Quote-to-invoice conversion and revision count connect the workflow to financial value or operating quality.
- Pricing error rate and approval turnaround are important for understanding risk, scale, and long-term maturity.
Implementation Priorities
Implementation should begin with a narrow but meaningful use case. Teams often get better results by automating a repeatable workflow with clear rules than by trying to redesign every process at once. The first use case should be large enough to measure, simple enough to stabilize, and important enough for leadership to care about the results.
Data preparation is usually more important than expected. The team should review field definitions, source systems, duplicate records, approval rules, customer or supplier records, historical exceptions, and reporting requirements before rollout. This work can feel slower than software configuration, but it prevents avoidable problems later.
Training should focus on new responsibilities, not only new screens. Users need to understand what the system will do automatically, what they must still review, how to handle exceptions, and which metrics will be used after launch. This reduces resistance because people can see how the workflow will change their daily work.
After launch, leaders should hold a short operating review every month. The review should cover adoption, exceptions, cycle time, errors, user feedback, integration issues, and metric movement. This turns the system into a continuous improvement tool rather than a one-time deployment.
Implementation statistics and checkpoints
- Start with the workflow where estimate creation time, gross margin accuracy, or quote-to-invoice conversion is most visibly underperforming.
- Create a baseline before launch so improvement can be measured without relying on anecdotes.
- Document exception reasons during the pilot because they show where process design needs more work.
- Assign ownership for the post-launch scorecard before the system goes live.
- Expand only after users trust the workflow and the data is clean enough to support decisions.
Future Outlook
The future of estimate software is likely to be more embedded, more intelligent, and more connected to adjacent workflows. Buyers are increasingly unwilling to accept tools that solve only one step while leaving the rest of the process manual. They want systems that capture data, move work, apply rules, surface exceptions, and report outcomes from one coherent workflow.
AI will likely expand first in areas where the risk is manageable and the pattern recognition value is high. That includes classification, data extraction, anomaly detection, routing recommendations, forecasting, and user guidance. More sensitive decisions will still need governance, audit trails, and human accountability. The companies that benefit most will be those that pair AI with strong process ownership rather than treating it as a shortcut.
Data quality will become a bigger differentiator. As more workflows become automated, poor master data, inconsistent field definitions, duplicate records, and weak integration will become more visible. Companies that invest in clean data foundations will be able to automate more confidently and interpret their metrics more accurately.
The practical outlook is positive but not automatic. Market growth shows that demand is real, but operating improvement depends on implementation quality. Businesses that define the workflow, choose metrics carefully, and review results over time will get more value than those that only adopt the newest tool.
Outlook Statistics and Watch Points
-
Global Cost Estimation Market Expansion: The global cost estimation software market reached a valuation of USD 3.38 Billion and is maintaining a strong upward trajectory, projected to reach USD 7.37 Billion by 2035 with a Compound Annual Growth Rate (CAGR) of 10.2%.
-
Mitigating Project Overruns: Approximately 72% of mid-to-large organizations utilize automated cost estimation explicitly to reduce manual calculation errors, which historically accounted for nearly 18% of all project cost overruns.
-
High-Volume Regional Enterprise Deployment: In the United States, adoption rates exceed 76% among construction and infrastructure firms employing more than 500 staff, representing the largest regional deployment footprint globally.
-
The Shift From Manual Spreadsheets: Digital migration is hitting high-velocity milestones; 41% of organizations completely phased out manual spreadsheet calculations in favor of dedicated software tools between 2020 and 2024.
-
Operational Cycle-Time Compression: Enterprises migrating to integrated software options report a standard 22% improvement in estimation accuracy alongside a 31% reduction in total calculation cycle times.
-
Cloud Dominance and Daily Usage: Cloud-based software architectures now command 57% of enterprise estimation deployments, with 61% of cloud-based users accessing their platforms daily, compared to just 39% weekly usage in legacy on-premise environments.
-
Escalating Multi-Project Complexity: Modern estimating platforms are facing massive operational scaling demands; 69% of enterprises currently use their software to manage over 10 concurrent projects simultaneously, while 48% orchestrate more than 20 active cost centers.
-
Drastic Rate Error Compression: Traditional manual estimation approaches sustain inherent error rates ranging from 14% to 19%, whereas deploying modern estimation software successfully compresses project financial discrepancies to under 6%.
-
Accelerated Bid Velocities: Relying on software-driven cost templates and real-time inputs cuts total project bid preparation time by 32%, allowing 73% of construction and manufacturing firms to submit faster, more competitive responses to public and private tenders.
-
Surging Platform AI Capabilities: Artificial intelligence implementation is expanding rapidly, marked by a 36% year-over-year increase in integrated AI features across active platforms, with 34% of tier-one software vendors launching native, AI-driven modules.
-
Predictive Analytics and Risk Containment: Advanced analytics and machine learning can mitigate project cost overruns by up to 26%, prompting 29% of cloud-based software platforms to embed automated risk evaluations directly into their workflows.
-
The Legacy Integration Bottleneck: Despite the clear benefits of connected systems, data complexity remains an uphill battle; 39% of enterprises report notable project timeline delays during deployment, citing rigid legacy software and poor initial master data foundations.
-
Accelerated Quote-to-Cash Workflows: By automating pricing engines through integrated software architectures, companies report a 30% faster time-to-quote, which translates to an average 15% increase in total deal profitability via optimization algorithms.
-
Manufacturing Lead in Estimating Tech: Industrial manufacturing commands the largest specific implementation footprint for specialized quoting tools with a 32.12% revenue share, driven heavily by complex engineer-to-order workflows and strict bill-of-materials precision requirements.
-
SME Resource Constraints: High upfront implementation and data engineering costs remain localized bottlenecks, as 45% of small enterprises cite initial deployment expenses as the primary barrier preventing automated estimation software procurement.
-
AI-Enabled Cross-Selling Projections: Machine learning algorithms have advanced enough to actively detect pricing variances, with advanced analytics deployed by 48% of enterprises to provide predictive insights that enhance upselling and cross-selling by more than 20%.
Editorial Interpretation and Decision Quality
The final editorial lens for estimate software is practical decision quality. A statistic is useful only when it helps a business choose a better workflow, set a better target, or avoid a costly blind spot. For example, a market CAGR explains growth momentum, but it does not tell a finance leader which process to fix first. A cycle-time statistic is more actionable when it is tied to a specific bottleneck, owner, and improvement target.
This is why the best report structure combines market data with operating interpretation. Market data explains why the category is expanding. Workflow analysis explains where value is created. Segment analysis explains why different buyers need different roadmaps. Risk analysis explains what should not be automated blindly. Together, these layers make the statistics useful for planning rather than simply interesting to read.
Decision-quality statistics
- Every statistic should answer 1 of 4 questions: scale, adoption, performance, or risk.
- A strong dashboard should show at least 5 operating indicators before leadership relies on it for planning.
- A meaningful improvement target should be time-bound, such as 30, 60, or 90 days after implementation.
- The best benchmark compares before-and-after performance inside the same workflow, not only external averages.
- A useful report should connect market growth to operational choices, not leave market statistics isolated at the top.
Benchmark planning statistics
- Set a 30-day baseline window before launch so volume, cycle time, exceptions, and rework can be compared after rollout.
- Use a 60-day stabilization window after launch before making broad conclusions about ROI or adoption quality.
- Review the top 10 recurring exception reasons and assign owners for the 3 highest-volume causes.
- Track at least 5 operating metrics and 3 business-impact metrics so the scorecard does not become too narrow.
- Compare results across 3 company-size bands and 5 workflow categories before setting long-term targets.
- A mature process should show improvement in at least 2 outcome metrics without increasing risk exceptions by more than 1 review period.
- For high-volume teams, even a 2 percent reduction in rework can matter if the workflow touches thousands of cases per month.
Regional and Company-Size Planning
Regional planning adds another layer to estimate software because business infrastructure, payment behavior, regulation, bank connectivity, cloud adoption, and customer expectations are not the same everywhere. A workflow that depends on instant bank data, automated approvals, or digital document exchange may scale quickly in one market and require more manual fallback steps in another. This is why regional statistics should be interpreted alongside infrastructure readiness, not only buyer interest.
Company size changes the roadmap as well. Microbusinesses and smaller firms often want one practical improvement: faster estimates, better funding access, cleaner documents, easier cash visibility, or fewer manual follow-ups. Mid-market companies need repeatability across teams and locations. Large enterprises usually need policy enforcement, audit trails, identity controls, system integration, and reporting consistency across many entities.
A sensible rollout therefore uses different maturity targets by segment. A small company may be successful when 60 percent of a workflow is standardized and visible. A larger organization may need 85 percent or more of routine work to move through controlled rules before the process feels scalable. Highly regulated workflows may need lower automation thresholds but stronger evidence for every exception.
Regional and segment planning statistics
- A small-business target might be 60 percent workflow visibility within the first 90 days rather than full automation from day one.
- A mid-market target might be 75 percent standardized intake across teams before advanced analytics are introduced.
- An enterprise target might be 85 percent routine-path coverage with documented exception queues and monthly governance review.
- A regulated workflow may intentionally keep 10 percent to 20 percent of cases under human review even after automation matures.
- Regional readiness should be scored across 5 areas: digital data availability, payment infrastructure, regulation, integration options, and user adoption.
- A quarterly review should compare at least 3 segments: small accounts, mid-sized operations, and complex enterprise workflows.
- The implementation plan should avoid using a single benchmark when the business operates across multiple regions or customer segments.
- A practical expansion gate is 2 consecutive review periods with stable cycle time, lower exception volume, and no increase in control issues.
Research Depth and Methodology Notes
A deeper research view of estimate software starts by asking what economic pressure creates demand. In some categories the pressure is liquidity, in others it is labor cost, error risk, compliance exposure, customer experience, or revenue leakage. The same market-size number means different things depending on which pressure is strongest. A buyer that is trying to reduce a two-day approval delay evaluates the category differently from a buyer trying to reduce funding gaps or improve data extraction accuracy.
The second research question is whether the category changes a decision or only changes a task. A task-level tool helps a user complete work faster. A decision-level system changes how the business prices, approves, funds, routes, forecasts, or controls an outcome. Categories that reach decision-level impact usually justify stronger investment because they affect margin, liquidity, customer retention, audit quality, or risk exposure.
A third question is how much of the workflow is measurable after implementation. Better systems leave a data trail around intake, routing, timing, exceptions, approvals, and outcomes. That trail matters because it lets leaders compare teams, identify bottlenecks, and run continuous improvement instead of relying on anecdotal user feedback.
The research also needs to separate durable trends from temporary buying waves. A temporary wave may come from budget cycles, vendor hype, or a narrow regulatory deadline. A durable trend appears when several independent forces point in the same direction: volume growth, buyer pain, measurable ROI, easier integration, stronger data availability, and greater need for control.
Methodology statistics and interpretation rules
- Market estimates should be treated as directional when one source includes services or transaction value and another includes only software revenue.
- Adoption percentages should be read together with maturity indicators such as straight-through processing, exception rate, and integration depth.
- Survey results can overstate maturity when respondents count partial digitization as full workflow automation.
- Operational benchmarks should be normalized for volume because a low-volume process can show different economics from a high-volume process.
- Regional comparisons should account for regulation, banking infrastructure, cloud adoption, and local business-payment behavior.
- Internal baselines should be captured before implementation; otherwise teams may not know whether a 10 percent or 30 percent improvement is realistic.
- A reliable benchmark combines at least 2 external references with the company’s own baseline operating data.
Industry and Use-Case Deep Dive
Industry context changes how estimate software should be evaluated. In construction, the workflow often involves high-frequency activity, many handoffs, and a need for fast visibility. In home services, the same category may be judged by how well it supports margin control, credit timing, or operational capacity. These distinctions matter because one set of statistics cannot explain every business model equally well.
For manufacturing organizations, the most important improvement may be reducing rework and standardizing data. For IT services, the priority may be faster approvals, clearer documentation, or better exception management. For marketing agencies, the strongest value may come from creating a repeatable process that reduces dependence on individual employees remembering every detail.
Industry-specific adoption also depends on data readiness. A sector with structured digital inputs can often automate faster than a sector where the same information arrives through email, PDFs, phone calls, informal notes, or spreadsheets. This does not mean the second sector has less need. It usually means implementation must spend more time on intake rules, document capture, validation, and user training.
A useful industry benchmark should therefore compare both outcomes and constraints. Leaders should ask whether peers have similar transaction volume, similar approval complexity, similar regulation, similar customer behavior, and similar integration requirements. Without those adjustments, a benchmark can push teams toward unrealistic targets or understate the value of incremental improvement.
Industry-specific statistics and signals
- Construction use cases often need faster throughput and clearer handoff visibility.
- Home services use cases often depend on better margin, funding, or operational timing.
- Manufacturing use cases usually need stronger data quality and standardized records.
- It services use cases often require careful approval design and exception ownership.
- Marketing agencies use cases tend to benefit when repeatable tasks are turned into governed workflows.
- The strongest benchmark compares similar workflow complexity, not only similar company revenue.
Operating Example and Practical Business Case
Consider a company that handles 8,000 relevant workflow items each month and still depends on spreadsheet tracking, email approvals, and manual status updates. If each item requires only 4 minutes of avoidable handling, the business is spending more than 530 hours a month on work that does not create additional strategic value. That example is intentionally simple, but it shows why small time savings become meaningful when volume repeats.
Now add quality problems. If 3 percent of those items require rework, 240 cases a month need extra attention. If each rework case takes 20 minutes to investigate, the team loses another 80 hours. If some of those errors affect customers, suppliers, financing decisions, estimates, documents, or compliance evidence, the cost is not only internal labor. It also becomes delay, trust loss, cash uncertainty, or risk exposure.
The same example explains why leaders should not measure only license cost. If a system reduces average handling by 90 seconds, cuts rework from 3 percent to 1.5 percent, and makes exceptions visible earlier, the value may show up across multiple departments. Finance may see cleaner records. Operations may see faster decisions. Sales or service teams may see better customer follow-up. Leadership may see more reliable reporting.
This type of operating example is more useful than a generic ROI claim because it converts statistics into a local baseline. Every organization can replace the volume, time, rework, and cost assumptions with its own numbers. The result is a business case that is grounded in actual workflow economics rather than broad market averages.
Practical operating calculations
- If a team processes 8,000 items per month, every 1 minute of avoidable handling equals about 133 hours of monthly capacity.
- A 3 percent exception rate on 8,000 monthly items creates 240 cases that require investigation before the process can be considered stable.
- Reducing average cycle time by 20 percent can be more valuable than reducing software cost by 5 percent when the workflow affects cash, customers, or compliance.
- A useful target is to review the top 5 exception reasons every month and remove at least 1 recurring root cause each quarter.
- Management dashboards should compare at least 3 views: total volume, exception volume, and business outcome movement.
- For estimate software, the scorecard should connect estimate creation time with quote-to-invoice conversion so leaders can see whether activity translates into value.
- Teams should segment results by at least 4 dimensions: business unit, workflow type, company size, and risk level.
Frequently Asked Questions
What does estimate software measure?
Estimate Software statistics measure market growth, adoption, workflow volume, operating performance, and business impact. The most useful numbers are not only market-size figures. They also show how teams use the tools, where manual work remains, which segments are growing fastest, and which metrics prove that the process is improving.
Why do published estimate software estimates differ?
Estimates differ because research firms define the market differently. Some include only software revenue. Others include services, transaction value, financing volume, implementation, platform fees, or adjacent workflow tools. The best approach is to compare direction, assumptions, and operational relevance rather than treating every estimate as directly interchangeable.
Which metrics matter most for estimate software?
The strongest scorecard includes estimate creation time, win rate, gross margin accuracy, change-order rate. More mature teams also track quote-to-invoice conversion, revision count, pricing error rate, approval turnaround. This combination shows speed, quality, value, and risk rather than only showing whether a tool has been deployed.
How should small businesses use these statistics?
Small businesses should use these statistics as a way to prioritize practical improvements. The goal is not to copy enterprise benchmarks. It is to identify where manual work, payment timing, data quality, approval delays, or customer experience problems are creating avoidable pressure.
How should enterprises use these statistics?
Enterprises should use the statistics to compare process maturity across teams, countries, business units, and systems. At scale, the value often comes from standardization, integration, auditability, and exception management rather than only from time saved by individual users.
What is the most common implementation mistake?
The most common mistake is buying technology before clarifying the workflow. Teams need to define data requirements, approval rules, exception handling, ownership, integrations, and success metrics before expecting the tool to produce consistent results.
How does AI affect estimate software?
AI can improve classification, data extraction, recommendations, anomaly detection, and workflow guidance. It should still operate inside clear controls, especially when the process affects payments, credit decisions, customer data, financial reporting, or contractual commitments.
What should leaders do before investing?
Leaders should document the current baseline: volume, cycle time, cost, error rate, manual touch count, exception reasons, and downstream rework. That baseline makes it easier to choose the right first use case and prove whether the investment actually improves the business.
Final Takeaway
Estimate Software Statistics show a category shaped by the same forces affecting modern finance and operations: demand for faster workflows, better data, stronger controls, and clearer visibility. The market numbers show investment momentum, but the more useful story is operational. Businesses want tools that reduce friction, improve decisions, and make work easier to manage as volume and complexity grow.
The most important lesson is that statistics should lead to better questions. Which workflow is slowest? Which errors create the most rework? Which metric would change a customer, supplier, lender, finance, or operations outcome? Which process can be improved first without weakening control? Companies that answer those questions carefully will get more value from estimate software than companies that only follow market growth headlines.