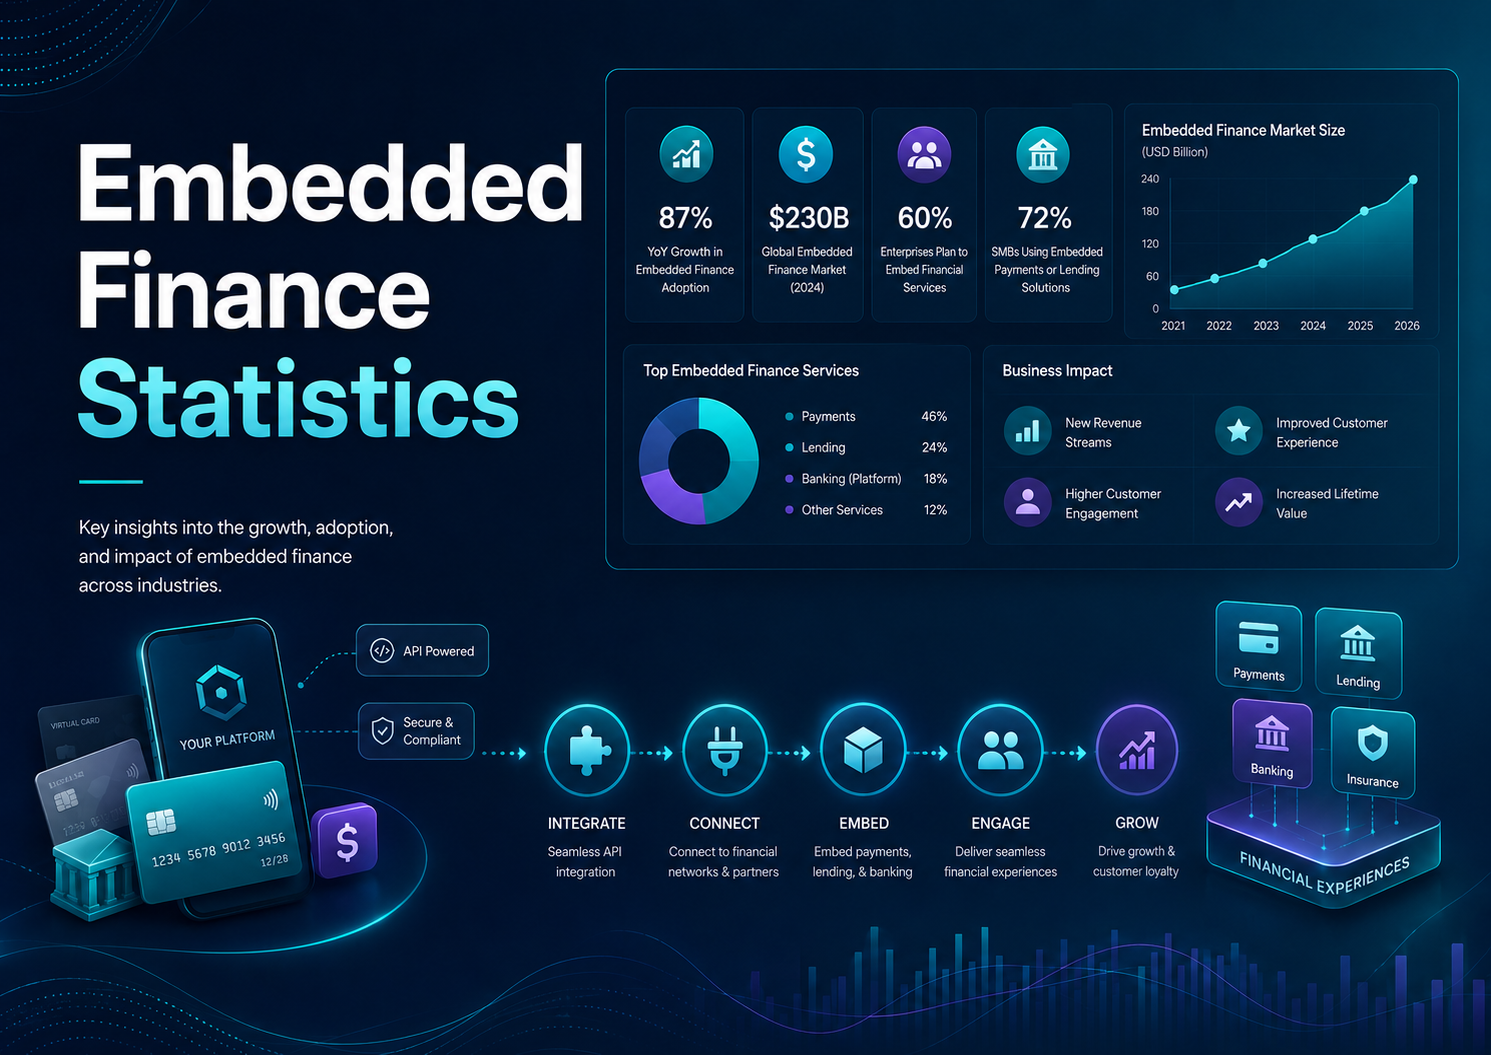
Embedded finance is the practice of placing payments, lending, insurance, banking, cards, or financial accounts inside non-financial customer journeys. The category matters because financial activity no longer has to begin inside a bank portal. It can begin at checkout, inside a software platform, in a marketplace dashboard, or during an invoicing workflow. The statistics around embedded finance are useful because they separate market enthusiasm from operating reality. A category can grow quickly in revenue while many companies are still managing the underlying work through spreadsheets, email, manual approvals, and fragmented systems. The gap between market forecasts and day-to-day maturity is where the most useful business insight usually sits.
This report looks at embedded finance through a practical finance and operations lens. Market-size estimates show how much capital, vendor activity, and customer demand are moving into the category. Adoption metrics show whether teams are changing their real workflows. Operating benchmarks show whether the tools are improving speed, accuracy, visibility, compliance, and cash outcomes rather than simply adding another software layer.
The numbers should be read with care because publishers define these markets differently. Some estimates include only software revenue. Others include services, implementation, transaction volume, platform fees, financing balances, or related workflow categories. That is why directional movement, segment differences, and operational interpretation matter more than treating any single dollar estimate as final. The strongest use of these statistics is to understand what businesses are actually trying to fix and which measurements prove progress.
Embedded finance is the practice of placing payments, lending, insurance, banking, cards, or financial accounts inside non-financial customer journeys. The category matters because financial activity no longer has to begin inside a bank portal. It can begin at checkout, inside a software platform, in a marketplace dashboard, or during an invoicing workflow. The statistics around embedded finance are useful because they separate market enthusiasm from operating reality. A category can grow quickly in revenue while many companies are still managing the underlying work through spreadsheets, email, manual approvals, and fragmented systems. The gap between market forecasts and day-to-day maturity is where the most useful business insight usually sits.
This report looks at embedded finance through a practical finance and operations lens. Market-size estimates show how much capital, vendor activity, and customer demand are moving into the category. Adoption metrics show whether teams are changing their real workflows. Operating benchmarks show whether the tools are improving speed, accuracy, visibility, compliance, and cash outcomes rather than simply adding another software layer.
The numbers should be read with care because publishers define these markets differently. Some estimates include only software revenue. Others include services, implementation, transaction volume, platform fees, financing balances, or related workflow categories. That is why directional movement, segment differences, and operational interpretation matter more than treating any single dollar estimate as final. The strongest use of these statistics is to understand what businesses are actually trying to fix and which measurements prove progress.
Headline Statistics and Benchmarks
The operational reality of embedded finance is shifting how capital, lending, and transaction processing are distributed. By placing financial instruments directly inside non-financial customer journeys—such as vertical SaaS platforms, B2B marketplaces, and enterprise workflows—businesses are moving away from traditional banking portals.
Evaluating the health and impact of these financial features requires studying market projections, platform take rates, and customer retention metrics. The following extensive statistics and operational benchmarks outline the current landscape of the embedded finance ecosystem:
Macro Market Forecasts & Volume Scaling
-
The Baseline Projections: The global embedded finance market is projected to expand from $155.96 billion to $454.48 billion, progressing at a compound annual growth rate (CAGR) of 23.84 percent.
-
High-Estimate Volumetric Scaling: Alternative financial modeling places the global baseline market footprint at $145.03 billion and projects it will climb to $1,921.96 billion, expanding at a 33.26% CAGR driven by rapid open-banking maturation.
-
The SkyQuest Valuation Curve: Long-term consensus estimates track a similar path, valuing the global embedded finance space at $126.3 billion and forecasting a surge to $941.01 billion.
-
The $7.2 Trillion Multiplier: Reflecting total transaction value and enterprise value enablement, analysis from Dealroom and ABN AMRO Ventures indicates that embedded finance could scale to a massive $7.2 trillion footprint.
-
The B2B Volume Breakout: Moving past consumer applications, the specialized embedded B2B finance segment stands at $4.1 trillion and is projected to skyrocket to $15.6 trillion, quadrupling its scale in just a five-year window.
-
U.S. Domestic Velocity: Growth models show strong U.S. domestic expansion, tracking an expected CAGR of 32.0% due to the widespread availability of cloud-native Banking-as-a-Service (BaaS) infrastructure.
-
North American Regional Dominance: Geographically, North America commands the single largest aggregate share of the embedded finance market at 36% to 39.1%, with the United States controlling over 85% of that regional revenue.
-
The Untapped Addressable Market: Strategic analysis by BCG and Adyen reveals that the total addressable market (TAM) for embedded finance across North America and Europe sits at $185 billion, yet current penetration has only captured $32 billion—meaning over 80% of the core market remains completely untapped.
Product Categories & Service Segmentation
-
Embedded Payments Core: Embedded payments represent the largest and most mature category, securing between 38% and 43.68% of total market share as platforms replace legacy third-party gateways with native, context-aware checkouts.
-
Embedded Lending Capacity: Driven by a continuous corporate demand for instant credit and flexible working capital, embedded lending modules hold a dominant 27% of the macro market share.
-
Embedded Insurance Monetization: Embedded insurance products account for 18% of global market revenue, generating high-margin, commission-based recurring fees for digital marketplaces, logistics networks, and mobility platforms.
-
The Investment Segment Acceleration: Supported by robo-advisory widgets and fractional API investing, the embedded investment and wealth-building segment represents 11% of the market but is expanding at the fastest isolated pace of a 27.66% CAGR.
-
Embedded Banking Value Locks: Embedded banking and treasury integrations account for up to 47.3% of specialized infrastructure models, operating as a foundational “operating system” that locks in deposit funds and automates corporate cash management.
Vertical SaaS Economics & Platform Take Rates
-
The 2x to 5x Revenue Multiplier: Microeconomic data indicates that embedding tailored financial features into a specialized vertical SaaS platform increases total average revenue per customer by 2x to 5x compared to a software-only subscription model.
-
The Toast Monetization Case Study: Highlighting the shift from software to finance, platform giants like Toast generated $5 billion from embedded financial services in a single fiscal year compared to $936 million from traditional software subscriptions.
-
Shopify’s 73% Finance Mix: The merchant solutions layer of Shopify—encompassing embedded credit card processing, point-of-sale terminal hardware, and instant capital lines—now commands 73% of the platform’s total aggregate revenue.
-
Over 40% Customer Attach Rates: Standardized survey data shows that when a B2B platform rolls out integrated financial tools, an average of over 40% of its existing user base adopts the products, triggering an average 40% revenue expansion per launched tool.
-
The 9% Average Contract Value (ACV) Lift: B2B SaaS companies monetize embedded financial services more successfully than horizontal platforms, realizing a clear 9 percentage point premium increase in ACV lift.
Customer Acquisition, Retention & Operational Benchmarks
-
The 2.5x Customer Retention Shield: Transitioning to an embedded payment architecture creates massive user lock-in, enabling SaaS vendors to retain active customers at 2.5 times the rate of traditional, non-embedded competitors.
-
Reclaiming Top-of-Wallet Volume: Verticalized payment acquirers that offer embedded accounting and point-of-sale functionality achieve a 19 percentage point higher payment volume growth and experience 5% less merchant attrition.
-
New-to-Bank Volume Optimization: Traditional financial institutions that partner with non-financial digital marketplaces to distribute accounts and cards realize an immediate 30% improvement in new-to-bank customer volumes.
-
The $250,000 Compliance Penalty Guardrail: Highlighting structural execution risks, data from the Consumer Financial Protection Bureau shows that over 60% of fintechs embedding finance into third-party apps have incurred compliance penalties exceeding $250,000 due to inadequate oversight and weak integration controls.
How to Read These Statistics Correctly
The first step in reading embedded finance statistics is separating market revenue from workflow performance. Market revenue shows how much businesses and platforms are spending. Workflow performance shows whether users are saving time, reducing errors, accelerating cash, or improving compliance. A market can be growing because vendors are selling more seats or processing more transactions even if the average buyer is still early in operational maturity.
A second distinction is between adoption and maturity. A company may count as an adopter after adding a digital intake form, connecting an API, or deploying a basic workflow. That does not mean the process is fully automated, governed, or optimized. Mature adoption usually means the team has clear rules, good data quality, exception handling, audit trails, and management metrics that are reviewed regularly.
A third distinction is between volume and value. Higher volumes are helpful for proving that a system is being used, but value comes from the quality of outcomes. A workflow that handles thousands of transactions but still requires manual correction may be less valuable than a smaller workflow with high accuracy and strong controls. The best statistics combine volume, cycle time, cost, accuracy, and risk indicators.
Market Size and Growth Outlook
-
Beyond Visual Hype: The market demand for embedded finance is driven by a desire for operational control rather than modern dashboard aesthetics. Corporate finance and operations teams adopt these tools to secure faster credit decisions, eliminate manual data silos, optimize cash visibility, and establish predictable cash flows.
-
Expanding Scope of Valuation: When financial functions are placed directly within non-financial workflows (such as invoicing, documentation, and operational approvals), the addressable market expands beyond simple software subscriptions. Comprehensive estimates now capture transaction interchange fees, implementation services, total financed volume, and managed API infrastructure.
-
The Power of Data Integration: Standard, standalone banking apps are losing ground to tools that seamlessly link upstream and downstream data. Business value peaks when platforms connect billing pipelines directly to core accounting systems, payment rails, customer relationship data, and reporting networks.
-
Tailored Segment Gains: For small and mid-sized businesses, the rise of cloud delivery and embedded native APIs removes the need for expensive, enterprise-grade implementations. For global enterprises, these unified platforms close critical operational and compliance gaps caused by fragmented systems operating at scale.
Market and Adoption Statistics to Know
Global Market Scale & Future Trajectories
-
The $454 Billion Horizon: Mordor Intelligence estimates the global embedded finance market footprint at $155.96 billion in 2026 and projects it will climb to $454.48 billion by 2031, sustained by a 23.84 percent CAGR.
-
The Trillion-Dollar Acceleration: Long-term forecasting from SkyQuest places the 2024 market value at $126.3 billion, but projects a steep incline to $941.01 billion by 2033, driven by a 25.0% CAGR during the 2026–2033 window.
-
Aggressive Multi-Trillion Forecasts: Comprehensive industry tracking by Fortune Business Insights and Precedence Research projects the global market will scale from roughly $145 billion to $148 billion up to an estimated $1,732.53 billion to $1,921.96 billion by 2034, expanding at a 31.53% to 33.26% CAGR.
-
The $7.2 Trillion Enablement Target: Highlighting its macroeconomic impact, World Economic Forum coverage indicates that total global transactions and market value enabled by embedded finance could crest at $7.2 trillion by 2030.
-
The $588 Billion Baseline: Alternative reporting from Grand View Research pegs the global embedded ecosystem value at $588.49 billion by 2030, driven by an accelerated compound growth rate of 32.8%.
Regional Performance & Geography Highlights
-
North American Dominance: North America leads the global landscape, commanding an aggregate market share of 36% to 39.1%, with the United States market alone valued at $39.17 billion.
-
The U.S. $468 Billion Target: Driven by advanced cloud infrastructure and specialized fintech partnerships, the U.S. embedded finance market is projected to reach $468.25 billion by 2034 at a 31.85% CAGR.
-
Asia-Pacific Velocity: The Asia-Pacific region is the fastest-growing geographical market, fueled by widespread mobile app adoption and open-banking frameworks. Within this region, India leads with a 19.5% CAGR, followed by China at a 15.8% CAGR.
-
European Core Footprint: Europe holds a stable 27% of the global market share, with Germany representing 9% and the United Kingdom accounting for 8% of the total European ecosystem.
Component & Service Line Distribution
-
Embedded Banking Foundations: Embedded banking services hold the largest structural position, commanding a 47.3% share of the type category, as platforms prioritize storing value and managing underlying corporate deposit accounts.
-
The Payment Gateway Engine: Embedded payments represent the most mature, high-volume segment, controlling 38% to 45% of the global market share and projected to exceed $400 billion in standalone value.
-
Stripe’s Scale Metric: Highlighting the sheer volume flowing through integrated checkouts, payment leader Stripe processed over $1.4 trillion in volume, marking an aggressive 38% year-over-year expansion.
-
Contextual Lending Proliferation: Driven by the integration of Buy Now, Pay Later (BNPL) frameworks and instant invoice financing into corporate networks, embedded lending secures a dominant 27% market share.
-
The Rise of Embedded Insurance: Embedded insurance platforms capture 18% of the global market share, generating high-margin recurring revenue streams for travel, logistics, and e-commerce platforms through automated, commission-based models.
-
High-Growth Investment Widgets: Micro-investing apps and robo-advisory tools embedded into non-financial applications represent 11% of the total service market but boast the fastest isolated segment expansion rate at a 27.66% CAGR.
End-Use Vertical & Business Model Demographics
-
B2B Enterprise Supremacy: Transitioning past consumer-only apps, enterprise-focused B2B embedded finance platforms now control 57% of the macro market share, expanding at a 26.25% CAGR as companies look to automate invoicing, expense routing, and supply chain trade credit.
-
Retail & E-Commerce Footprint: Consumer-oriented B2C solutions hold a 61.52% baseline user share, with the retail and e-commerce vertical controlling 36.05% of total end-use volume. This retail segment is projected to cross $270 billion due to the growth of embedded merchant loyalty programs.
-
Healthcare Service Disruptions: The healthcare and pharmaceutical vertical has emerged as the fastest-growing specialized enterprise segment, expanding at a 26.12% to 26.12% CAGR as providers integrate embedded billing to bypass slow, manual insurance loops.
Platform Economics & Critical Management Metrics
-
The 2x to 5x SaaS Revenue Multiplier: Embedding context-aware financial features directly into a vertical SaaS product increases total average revenue per customer by 2 to 5 times compared to a software-only subscription model.
-
The 20% Churn Reduction Shield: Integrating embedded payments and core financial accounts directly into a business user’s daily workflow creates deep product stickiness, cutting platform customer attrition rates by approximately 20%.
-
The 80% Untapped TAM Opportunity: Strategic market insights reveal that while the total addressable market (TAM) for embedded finance across North America and Europe stands at $185 billion, current solutions have only penetrated $32 billion—leaving over 80% of the core market open for adoption.
-
The Core Dashboard Matrix: High-performing operating teams ignore vanity metrics and instead evaluate performance using a balanced dashboard of four key performance indicators:
-
Activation Rate: The speed and percentage of users who complete onboarding.
-
Financial Attach Rate: The average number of integrated financial features adopted per customer profile.
-
Payment Acceptance Rate: The percentage of initiated transactions successfully cleared through underlying payment rails.
-
Loan Approval Rate: The precision and speed of risk engines in approving point-of-sale credit lines using alternative merchant data.
-
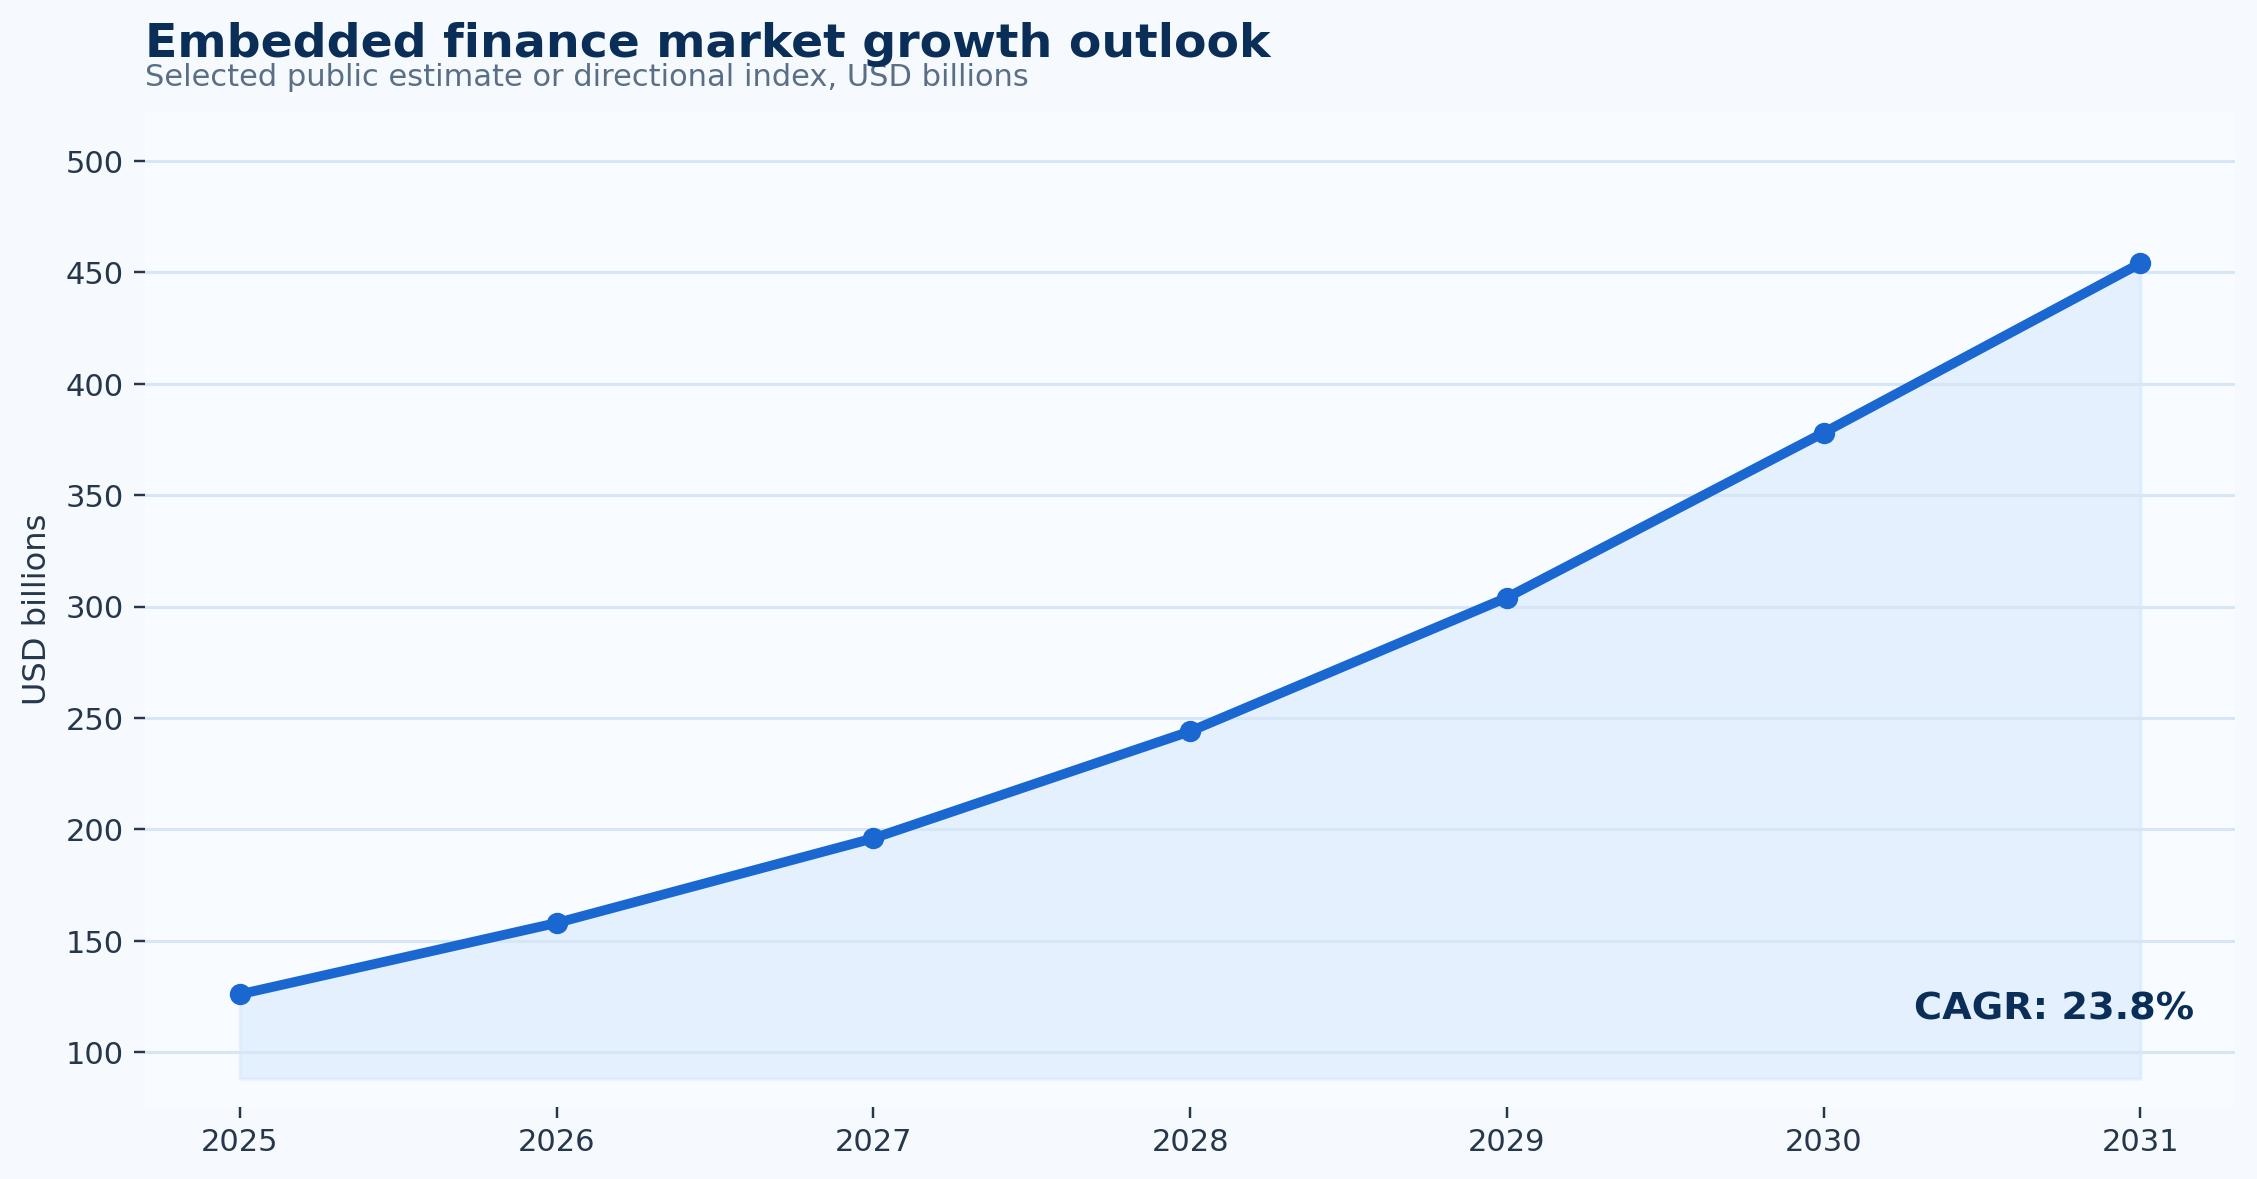
Figure 1. Embedded finance market growth outlook shows the direction of category growth and should be interpreted as a market signal rather than a single operating benchmark.
Why the Workflow Matters Operationally
The operational case for embedded finance begins with work that repeats often enough to create measurable friction. Repetition does not always look dramatic. It can be a manager checking the same spreadsheet every morning, a finance clerk re-entering data, a sales team rebuilding similar estimates, or a lender requesting the same documents from every applicant. Each touch may be small, but the combined workload becomes material when volume grows.
Technology only helps when the workflow is clear. If approval rules are inconsistent, source data is incomplete, or teams disagree about ownership, software can make the confusion faster but not necessarily better. Strong programs usually define the intake channel, required data fields, routing logic, exception categories, approval thresholds, and reporting cadence before scaling automation. That process discipline is often the difference between a successful deployment and a stalled project.
The most useful operational statistics are the ones that point to a decision. A cycle-time metric should tell leaders where work is waiting. An error metric should show whether the problem comes from data capture, policy gaps, missing information, or user behavior. A cost metric should identify whether savings come from fewer touches, less rework, faster approval, better cash timing, or reduced risk exposure.
In practice, teams should treat embedded finance as a workflow redesign project rather than a single technology purchase. The system should make common work easier, route unusual work to the right person, and generate enough data for leaders to see whether the process is improving. When those three outcomes are present, the statistics become management tools rather than marketing claims.
Operational statistics and signals
- A baseline should capture current volume, current cycle time, and the amount of manual work involved before the first workflow change is made.
- Teams should separate normal-path work from exceptions because the exception queue usually explains why averages do not improve as expected.
- A practical pilot should start with a high-volume and relatively repeatable workflow before expanding into unusual or high-risk cases.
- The best evidence of progress is an improvement in activation rate, payment acceptance rate, and platform take rate without creating weaker controls.
- Workflow visibility is often valuable even before full automation because it reveals where work waits and who needs to act next.
Adoption Maturity and Segment Differences
Segment differences matter because embedded finance rarely delivers value the same way for every buyer. Smaller companies often care about simplicity, speed, cost, and avoiding administrative overload. Mid-market companies usually care about standardization across teams, locations, or customer groups. Enterprise buyers focus more heavily on integration, controls, reporting, auditability, security, and governance.
Industry differences are just as important. In retail platforms and vertical SaaS companies, the workflow may be tied to high transaction volume and customer experience. In marketplaces and mobility platforms, the same category may be more closely tied to operational accuracy, project control, compliance, or working-capital visibility. This is why a generic adoption percentage can be misleading without context.
The business model also changes the metric set. A company with recurring revenue may measure retention, renewals, and payment reliability. A project-based company may focus on margin protection, estimate accuracy, milestone billing, and revenue recognition. A finance-heavy buyer may focus on cash timing, credit risk, audit trails, and compliance. Useful reporting should reflect the way the business actually makes money and manages risk.
The practical takeaway is that leaders should benchmark against similar workflows rather than only similar company sizes. A small company with complex transactions may need stronger controls than a larger company with simpler repeatable work. A high-growth firm may value speed more than cost reduction. A regulated firm may value documentation and auditability even when the direct labor savings look modest.
Segment statistics and interpretation points
- Small businesses usually prioritize fast setup, simple workflows, and direct savings because administrative capacity is limited.
- Mid-market teams often need stronger standardization across departments, locations, customer groups, or business units.
- Enterprise buyers usually require audit logs, permissions, reporting, data governance, and deeper integration with existing systems.
- Industry use cases differ: retail platforms and vertical SaaS companies may focus on volume, while marketplaces and mobility platforms may focus on accuracy or control.
- The right benchmark should compare workflows that share similar volume, complexity, and risk rather than only comparing companies of similar size.
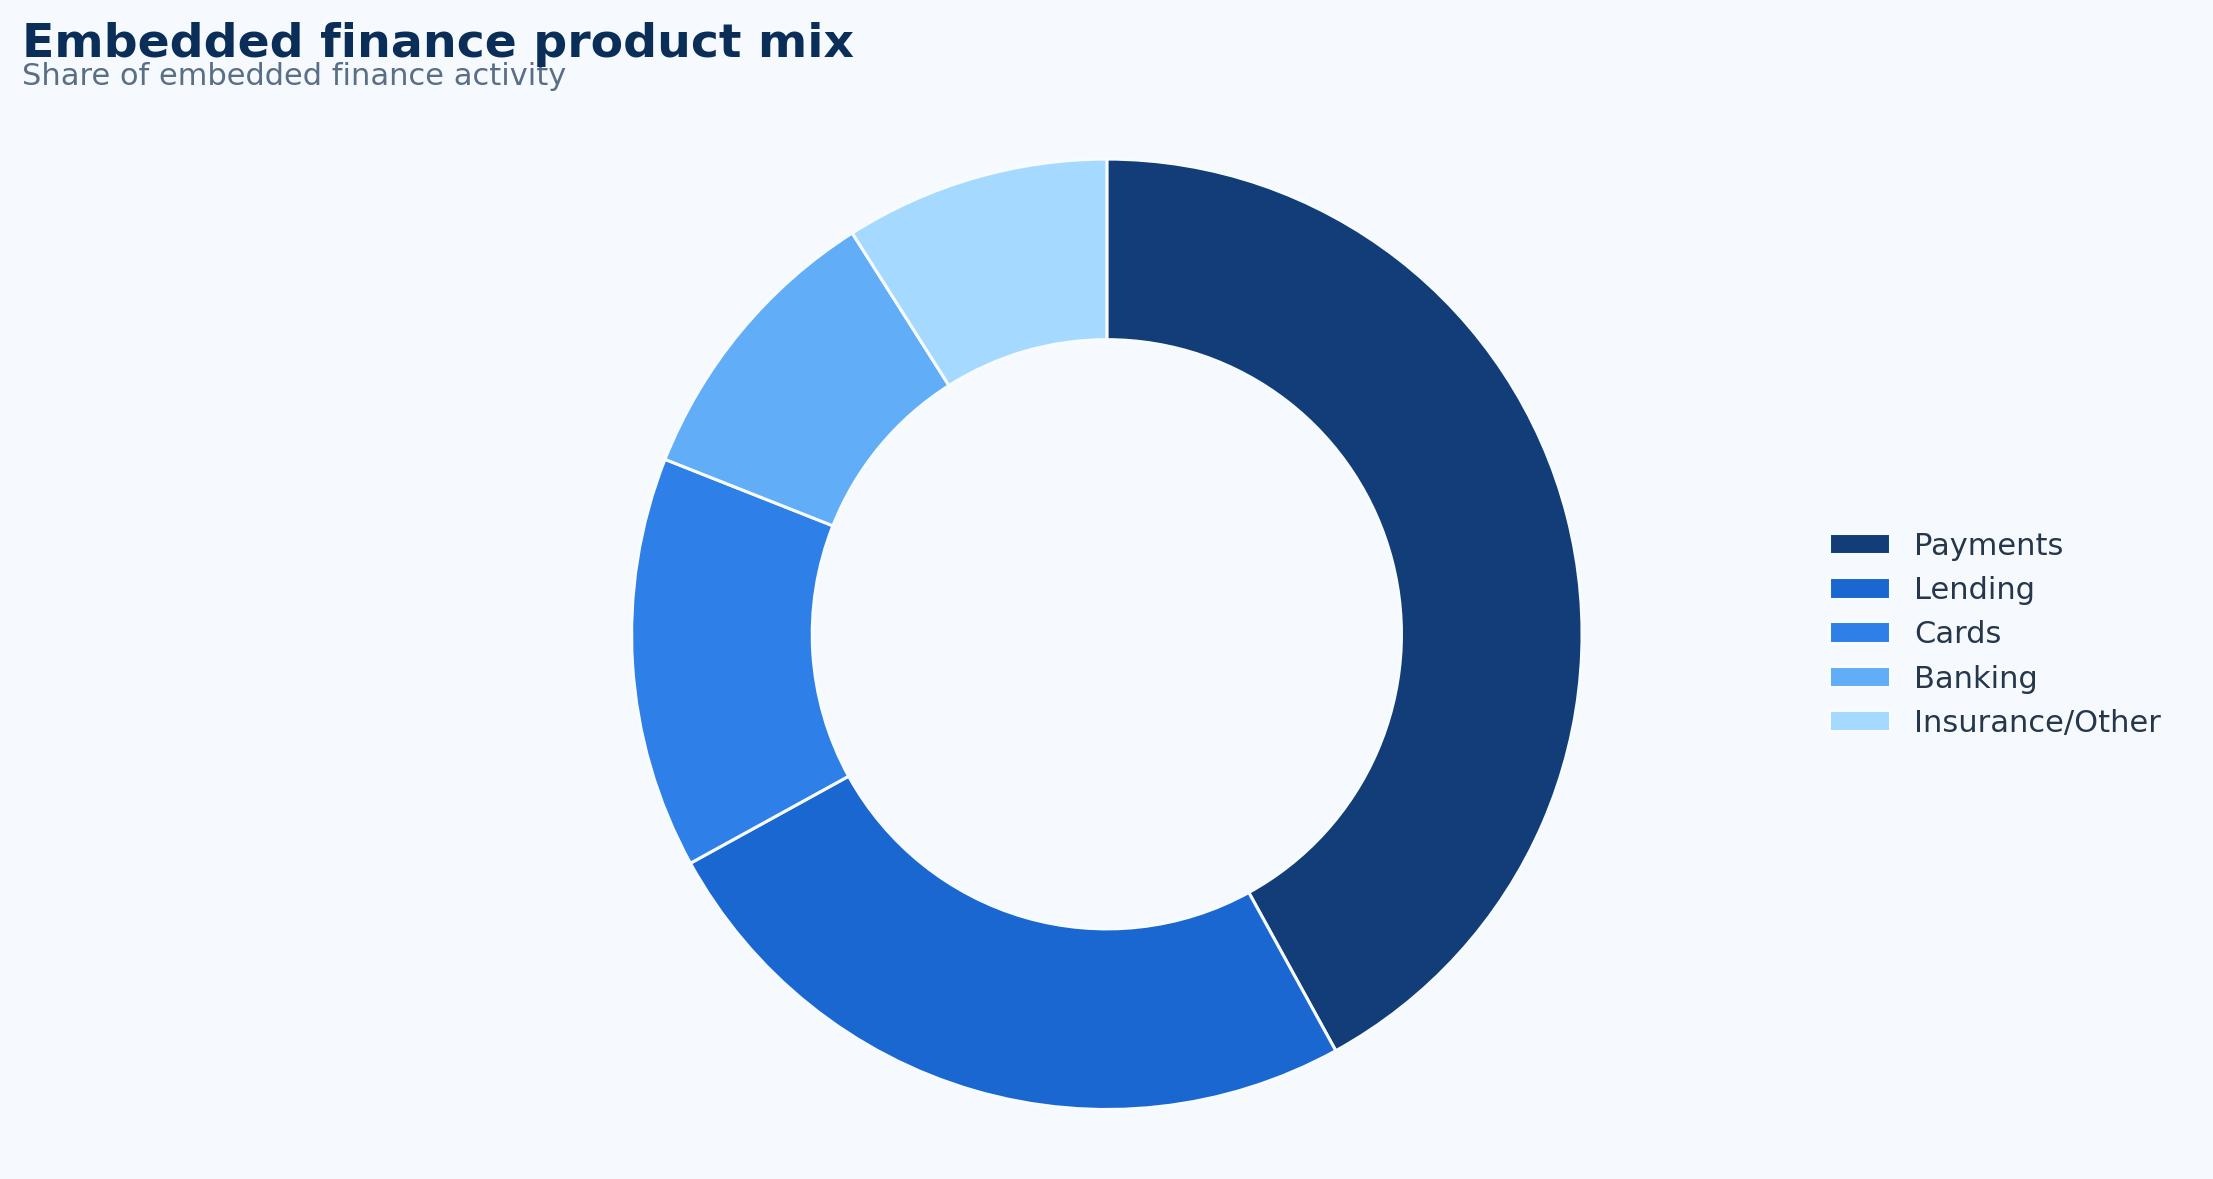
Figure 2. Embedded finance product mix gives a practical segment view of where activity is concentrated across the category.
Technology, AI, and Integration Trends
Technology in this category is aggressively shifting from isolated task automation toward unified, connected data architectures. Historically, finance teams have spent a substantial portion of their working hours on manual data entry and administrative verification. Modern enterprise platforms bypass these bottlenecks by pulling unstructured data directly from source documents, bank feeds, payment rails, and cloud ERP networks. By transforming raw invoices into structured, real-time data streams, companies achieve immense efficiency gains across core contract-to-cash workflows, directly removing friction from the working capital cycle.
AI and machine learning are expanding rapidly across automated finance systems, yet their role is focused on pattern classification, automated matching, and anomaly detection rather than eliminating human accountability. Platforms leveraging machine learning analyze historical customer behavior to predict buyer settlement timelines with high precision, insulating firms from sudden liquidity gaps. The primary goal is achieving high straight-through processing (STP) rates while automatically routing complex exceptions, disputed deductions, or high-value funding approvals to human operators.
Integration depth functions as the ultimate barrier to real-world software adoption. A tool that operates smoothly in isolation is quickly rejected by users if it forces them to manually copy or reconcile data between disconnected accounting ledgers, CRMs, and payment gateways. True API-first, cloud-hosted platforms sync transactions in real time, dropping average invoice processing cycles drastically. This deep systemic connection turns an isolated document-capture tool into an enterprise-wide operating platform.
Finally, security and data governance serve as the baseline for modern risk management. When automated workflows control millions in capital deployment, robust user permissions, granular audit trails, and automated fraud-detection layers become mandatory. Machine learning algorithms now spot duplicate invoices, pricing errors, or documentation tampering before funds leave the system, giving both internal finance leaders and external credit providers absolute transparency into the entire lifecycle of a financed receivable.
Technology and Integration Statistics to Watch
Core Automation & Functionality Trends
-
The $19.1 Billion Market Horizon: The global AI accounts receivable automation FinTech market is expanding rapidly, rising from a $3.4 billion baseline to a projected $19.1 billion by 2034, driven by a 19.5% CAGR.
-
Invoice Processing Dominance: AI-powered invoice processing commands the single largest functional share of the automated financial technology ecosystem at 33.5%, highlighting the priority placed on automating entry points.
-
High-Velocity Reconciliation: Payment matching and reconciliation systems account for 24.2% of the automated stack, with advanced engines frequently achieving 85% to 92% Straight-Through Processing (STP) rates.
-
Predictive Capital Forecasting Expansion: Cash flow forecasting software is the fastest-growing functional application in the space, expanding at a 22.8% CAGR as companies demand precise foresight into liquid availability.
-
Automated Exception Handling: AI-driven dispute and deduction management systems are growing at a 24.1% CAGR, utilizing natural language processing (NLP) to classify and route billing discrepancies automatically.
-
Reclaiming Core Labor Capacity: By automating routine data extraction and multi-way matching, finance departments successfully reduce their manual processing labor demands by 20% to 40%, allowing teams to focus on strategic capital allocation.
Operational Impact & Efficiency Gains
-
Measurable Cash Flow Optimization: Implementing automated financial workflows directly improves daily cash flow management for 71% of surveyed organizations.
-
Slicing Payment Delays: Moving from manual tracking to connected, AI-driven collection suites generates a clear 30% reduction in outstanding payment delays.
-
Drastic Cost-Per-Invoice Reduction: Deploying automated intelligent verification drops the average cost to process a supplier invoice from a manual baseline of roughly $12.88 – $15.00 down to just $2.78 – $3.12 per invoice.
-
Compressing Invoicing Timelines: The average time required to process, validate, and clear a single invoice shrinks significantly under automated frameworks, dropping from 17.4 days down to 3.1 days.
-
Eradicating Input Discrepancies: Shifting data ingestion away from manual entry cuts data entry error rates from a standard manual average of 2% to 5% down to under 0.1%, preventing downstream collection disputes.
Integration Depth & Platform Architecture
-
Integration as a Buying Mandate: Software compatibility is the leading driver of adoption; 58% of enterprises consider seamless integration capabilities the single most critical factor when selecting financial automation software.
-
The Cloud Scaling Standard: Cloud SaaS-based architectures control a dominant 72.8% of global enterprise deployments, favoring agile rollouts that offer an efficient 8-to-14 week go-live implementation timeline.
-
Accelerating Mid-Market Adoption: Mid-market enterprises ($50M–$500M) represent the fastest-growing end-user vertical for automated ledger software, expanding at a 21.8% CAGR as they actively outgrow legacy spreadsheets.
-
The Four-Nines Uptime Floor: For platforms processing real-time payments, invoice validations, or embedded loans, system uptime requirements adhere to a strict 99.99% (“four nines”) industry standard to prevent multi-million dollar transaction logjams.
-
Crushing Cart Abandonment: Placing point-of-sale financing or invoice discounting solutions directly into checkout loops lifts B2B cart conversion rates by 20% to 30%, preserving platform gross merchandise value (GMV).
-
The Ultimate Customer Acquisition Shield: For digital ecosystems, embedding financial features directly into vertical SaaS platforms slashes Customer Acquisition Costs (CAC) from an industry direct-to-consumer baseline of over $200 down to near-zero.
Security, Governance, and Fraud Defenses
-
Proactive Anomaly Interception: Automated machine learning anomaly-detection algorithms identify duplicate billings, suspicious behavior, and document tampering with 99.2% accuracy before financing advances are deployed.
-
The $250,000 Compliance Guardrail: Highlighting the strict necessity of precise permission design, over 60% of fintech platforms that deploy financial features without rigid integration controls have incurred compliance penalties exceeding $250,000.
-
High-Fidelity Dispute Classification: Natural language processing models analyze and classify the root causes of client disputes and short-pays with verified accuracy rates exceeding 92%, instantly routing exceptions to proper internal owners.
-
Algorithmic Accountability: To maintain necessary human-in-the-loop governance, modern systems must provide clear explainability metrics, showing compliance and credit officers exactly why an item was automatically routed, approved, rejected, funded, or escalated.
ROI, Cost Savings, and Business Impact
Building a compelling business case for embedded finance requires looking past simple, headline-grabbing numbers. A narrow return on investment (ROI) calculation that only measures “hours saved by an accounts receivable clerk” misses the true operational picture. A comprehensive business case must track the compound effects of lower error-correction costs, compressed cycle times, minimized exception queues, and fewer redundant customer inquiries. These overlapping benefits ripple across the entire corporate structure—from treasury and compliance down to procurement and customer success.
To prove that a solution delivers genuine financial control rather than just another software subscription, organizations must establish hard baselines before deploying technology. Measuring existing transaction volumes, manual touchpoints, average processing days, and downstream error rework provides a clear diagnostic map. This baseline ensures a company can focus its automation efforts where they will have the biggest impact.
By separating hard savings from softer operational improvements, finance leaders can set realistic expectations for phased, modular rollouts that minimize integration risk while building predictable, long-term balance sheet value.
Return on Investment and Financial Benchmarks
Unit Economics & Top-Line ROI Multipliers
-
The 2x to 5x Revenue Expansion: Adding context-aware financial features directly into a specialized vertical SaaS platform can increase the total average revenue per customer profile by 2x to 5x compared to a basic software-only subscription model.
-
The 384% ROI Multiplier: Moving from legacy, disjointed invoicing systems to an enterprise platform that natively layers payments, credit lines, and treasury tools yields a verified 384% average Return on Investment (ROI).
-
70%+ Top-Line Revenue Uplift: Corporate platforms integrating native financial networks report a 70% or higher revenue uplift driven by monetizing transaction interchange, cash management interest, and loan fee splits simultaneously.
-
Near-Zero Customer Acquisition Costs (CAC): Embedding financial services directly into platforms with a captive audience (like a rideshare app or business management console) eliminates direct-to-consumer advertising costs, slashing financial product CAC by up to 30%, often driving it down to near-zero.
-
The 3x to 4x Net Revenue Trajectory: Software companies that deploy embedded finance early capture a severe competitive advantage, resulting in an eventual 3x to 4x increase in total company revenue over a multi-year horizon.
Hard Savings & Processing Cost Reductions
-
The 1,666-Hour Scaled Reclaim: Minor workflow optimizations create massive capacity. Saving just one single minute of manual friction per invoice across an annual corporate ledger of 100,000 transactions reclaims 1,666.67 hours of pure processing capacity before considering downstream error reduction.
-
Plugging Revenue Leakage via Lower Costs: Shifting transaction volume away from traditional high-fee credit card rails to alternative Account-to-Account (A2A) and automated ACH payment setups blocks excessive intermediary markups, slashing processing fees by up to 50%.
-
60% to 75% Cost-Per-Invoice Drops: Transitioning checkouts and supplier payments to native workflows drops the average cost to validate and clear a single invoice from a manual average of $12.88 – $15.00 down to just $2.78 – $3.12 per invoice.
-
Erasing Human Transcription Discrepancies: Transitioning billing data directly into integrated payment rails cuts data entry error rates from a standard manual average of 2% to 5% down to under 0.1%, stopping expensive downstream exception processing.
-
Avoiding the $250,000 Compliance Penalty: Establishing deep integration plans with robust permission controls and Banking-as-a-Service (BaaS) infrastructure prevents massive compliance risks; over 60% of unintegrated fintech configurations have incurred regulatory enforcement penalties exceeding $250,000.
Operational Efficiencies & Reclaimed Labor (Soft Savings)
-
97% Customer Satisfaction Rating: Simplifying financial access through intuitive, contextual journeys elevates the user experience, generating a 97% higher merchant and customer satisfaction rating.
-
Month-End Close Compression: Finance teams using deeply connected ledger software cut their month-end close timelines by an average of 3 to 7.5 days, giving leadership immediate visibility into corporate liquidity.
-
54% Immediate Revenue Gains: Real-world tracking shows that 54% of B2B platforms capture direct revenue gains from embedded finance, with 83% already deploying embedded payments as their anchor feature.
-
Halving Manual Reconciliation Workloads: Automated matching engines that tie invoices to payment rails automatically clear over 90% of cash applications, reducing manual invoice tracking and back-office administrative workloads by 50%.
-
Reclaiming Core Labor Capacity: Eliminating repetitive manual reviews allows finance departments to decrease manual processing labor requirements by 20% to 40%, freeing teams to focus on strategic capital allocation.
Conversion, Retention, and Stickiness Metrics
-
The 2.5x Customer Retention Shield: SaaS platforms deploying native embedded payment strategies retain their customers at 2.5 times the rate of competitors who rely on clunky, third-party redirected payment gateways.
-
20% to 30% Lift in Cart Conversions: Placing context-aware embedded lending or point-of-sale financing directly into a checkout loop boosts cart conversion rates by 20% to 30%, protecting platforms from cart abandonment and lifting total Gross Merchandise Value (GMV).
-
19% Higher Transaction Volume Growth: Vertical software platforms that offer native accounting, issuing, and card-processing tools achieve a 19 percentage point premium in payment volume growth and experience 5% less churn.
-
The 25% Churn Reduction on Merchant Portals: Platforms implementing automated merchant capital advances see customer lifetime value surge by 40%, alongside a 25% drop in total payment processing churn.
-
Elevating Core Contract Value: B2B platforms achieve an average 9 percentage point increase in Annual Contract Value (ACV) by cleanly bundling embedded financial options into existing software contracts.
Payback Period & Implementation Guideposts
-
Accelerated 6 to 9 Month Payback Timelines: Lightweight embedded applications demonstrate a rapid setup timeline, reaching full investment payback within an average of 6 to 9 months.
-
The 90-Day MVP Activation Phase: Staged deployments minimize risk. Early MVP phases target an initial 60% to 70% loan approval rate, a sub-5 second decision latency, and a target 2% to 4% platform take rate within a tight 90-day payback milestone.
-
The 120% Scale Phase Target: Once an embedded financial program moves past its initial rollout, scale targets transition to an automated 75% to 85% loan approval rate, a sub-2 second decision latency, a 3% to 6% take rate, and an elevated Net Revenue Retention (NRR) of 110% to 120%.
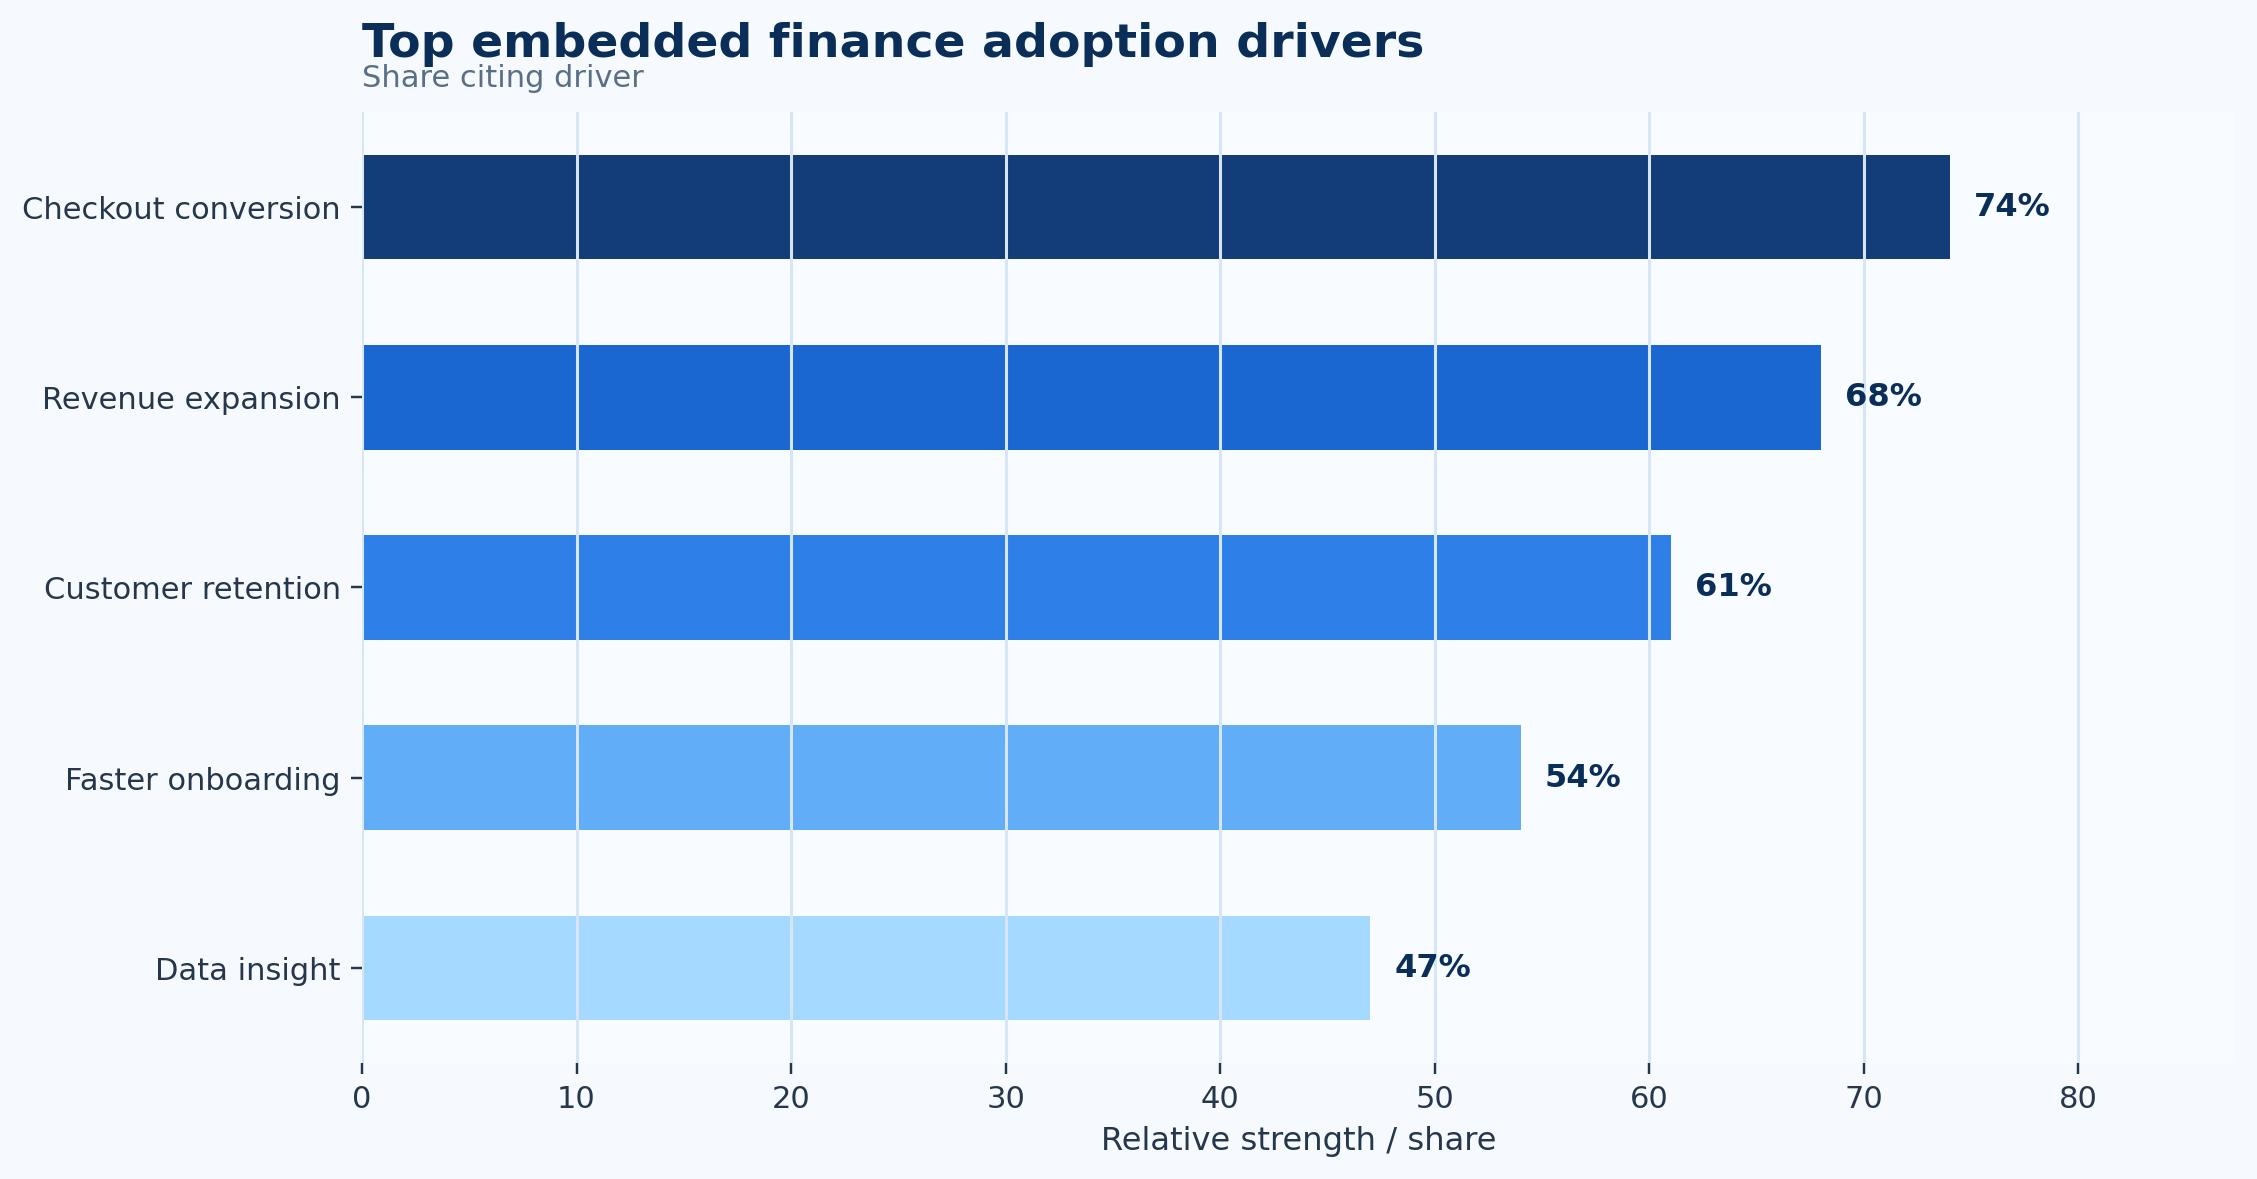
Figure 3. Top embedded finance adoption drivers highlights the business reasons that commonly move the category from experimentation to budgeted adoption.
Controls, Risk, and Governance
The main implementation risk is automating a weak process before fixing the process design. If data is inconsistent, approvals are unclear, or accountability is spread across too many teams, automation may simply move the bottleneck to another place. A well-designed project should identify where decisions are made, what information is required, how exceptions are escalated, and who owns final outcomes.
A second risk is over-automation. Not every transaction, document, application, estimate, or approval should move without review. High-value, unusual, first-time, disputed, regulated, or risky items often need stronger human oversight. The goal is not to remove judgment; it is to reserve judgment for the cases where it matters most.
A third risk is poor measurement after rollout. Many teams measure go-live completion but not operating performance. A system can be technically live while users still route work around it through email, spreadsheets, messaging apps, or offline approvals. Post-launch measurement should track adoption, exceptions, cycle time, accuracy, and user behavior to confirm that the workflow is truly changing.
Governance should also evolve as the workflow matures. Early rules may work for a pilot but break when more teams, regions, products, or transaction types are added. Leaders should review thresholds, permissions, integration logs, exception reasons, and metric definitions periodically. This keeps automation aligned with how the business actually operates.
Risk and control metrics
- High-risk items should keep human review even when low-risk items move through a mostly automated workflow.
- Audit trails should record who changed the data, who approved the action, when it happened, and what rule or evidence supported the decision.
- Exception categories should be tracked over time because they often reveal recurring data, policy, training, or integration problems.
- Governance should include role-based permissions, approval thresholds, review queues, and periodic audits of unusual activity.
- A mature process treats automation as controlled speed, not speed at the expense of accountability.
Metrics Leaders Should Track
The best scorecard for embedded finance should include both activity and outcome metrics. Activity metrics show whether the workflow is being used. Outcome metrics show whether the workflow is producing better results. For example, adoption rate and transaction volume matter, but they should be paired with cycle time, accuracy, cost, conversion, funding, or cash-flow outcomes depending on the topic.
Leaders should track activation rate, financial attach rate, payment acceptance rate, and loan approval rate as early operating indicators. These metrics usually reveal whether the process is faster and more visible. They should then add platform take rate, risk-adjusted revenue, customer retention lift, and partner adoption to understand quality, risk, and business impact.
The scorecard should also separate averages from exceptions. Average performance can look healthy while a small share of cases create most of the risk or rework. Exception aging, rejected items, manual overrides, late approvals, or high-risk transactions often reveal more about workflow health than a single average number.
Finally, the scorecard needs ownership. A dashboard without an owner becomes background noise. Each metric should have a person or team responsible for investigating movement, explaining variance, and deciding what changes next. This turns statistics into management action.
Scorecard statistics
- Activation rate should be tracked by segment so leaders can see whether improvement is broad or concentrated in one area.
- Financial attach rate helps reveal whether adoption is expanding or whether users are staying inside old workarounds.
- Payment acceptance rate and loan approval rate show whether the process is becoming faster and more reliable.
- Platform take rate and risk-adjusted revenue connect the workflow to financial value or operating quality.
- Customer retention lift and partner adoption are important for understanding risk, scale, and long-term maturity.
Implementation Priorities
Implementation should begin with a narrow but meaningful use case. Teams often get better results by automating a repeatable workflow with clear rules than by trying to redesign every process at once. The first use case should be large enough to measure, simple enough to stabilize, and important enough for leadership to care about the results.
Data preparation is usually more important than expected. The team should review field definitions, source systems, duplicate records, approval rules, customer or supplier records, historical exceptions, and reporting requirements before rollout. This work can feel slower than software configuration, but it prevents avoidable problems later.
Training should focus on new responsibilities, not only new screens. Users need to understand what the system will do automatically, what they must still review, how to handle exceptions, and which metrics will be used after launch. This reduces resistance because people can see how the workflow will change their daily work.
After launch, leaders should hold a short operating review every month. The review should cover adoption, exceptions, cycle time, errors, user feedback, integration issues, and metric movement. This turns the system into a continuous improvement tool rather than a one-time deployment.
Implementation statistics and checkpoints
- Start with the workflow where activation rate, payment acceptance rate, or platform take rate is most visibly underperforming.
- Create a baseline before launch so improvement can be measured without relying on anecdotes.
- Document exception reasons during the pilot because they show where process design needs more work.
- Assign ownership for the post-launch scorecard before the system goes live.
- Expand only after users trust the workflow and the data is clean enough to support decisions.
Future Outlook
The future of embedded finance is moving away from isolated, single-step tools toward deeply embedded, intelligent, and interconnected financial networks. Enterprise buyers are no longer willing to accept fragmented platforms that solve data entry but leave verification or reconciliation as manual tasks. Instead, the market is shifting toward automated setups that pull unstructured data from source documents, apply automated business rules, flag credit anomalies, and settle cash positions inside a single workflow.
As transaction volumes scale globally, the dividing line between market leaders and laggards will depend entirely on data infrastructure and process ownership. Organizations that invest in clean, master data foundations will be able to deploy automated underwriting confidently. Conversely, companies relying on weak data connections will find that automation simply multiplies their exception queues.
Outlook Statistics and Watch Points
Global Market Milestones & Macro Projections
-
The $2.39 Trillion Ecosystem Horizon: Long-term market forecasting indicates the global embedded finance market will skyrocket from an established baseline to a staggering $2,388.29 billion ($2.39 trillion) by 2035, expanding at a blistering 32.4% CAGR.
-
Accelerated Mid-Decade Trajectories: Alternative financial modeling projects the broader market to march from a baseline up to $1,921.96 billion by 2034, maintaining an aggressive 33.26% CAGR as open-banking frameworks mature.
-
The $320 Billion Platform Revenue Target: By 2030, the pure platform revenue generated by embedded finance applications is expected to hit $320 billion worldwide, establishing it as a core pillar of software monetization.
-
Revenue Distribution Demographics: This $320 billion software revenue pool will be led by the small and medium-sized business segment at $150 billion, followed by the consumer segment at $120 billion, and large enterprise platforms at $50 billion.
-
The Triple-Digit Value Surge: Near-term corporate adoption metrics track a sharp curve, with embedded finance solutions projected to realize a 148% revenue explosion, climbing from $92 billion to $228 billion over a tight four-year window.
-
The 10% Transaction Value Standard: Institutional baseline models show that embedded financial ecosystems are on track to capture and process over 10% of total domestic transaction volumes, transforming non-financial platforms into major economic engines.
The Rise of B2B Platformization & Alternative Rails
-
B2B Architectural Dominance: Corporate B2B applications have officially overtaken consumer applications, securing a dominant 57% share of the embedded finance market as vertical software vendors move away from isolated, single-step tools.
-
The 45% Contextual Lending Shift: Executive industry data indicates that 45% of business loan applications are projected to be initiated and approved directly within non-financial software workflows within the next five years, bypassing traditional bank portals.
-
The $850 Billion Open-Banking Payment Rail: Account-to-Account (A2A) embedded payments are outpacing traditional credit cards, growing at a 13% CAGR to command a massive $850 billion global transaction value due to lower interchange fees.
-
The 125% In-Checkout Insurance Expansion: Driven by contextual cross-border commerce, embedded insurance solutions are recording a 125% explosion in adoption, using unified APIs to cross-sell protection policies directly at checkout.
-
E-Commerce Marketplace Consolidation: The retail and e-commerce end-use industry remains a major integration node, capturing 36.05% of active user volume as digital storefronts integrate point-of-sale financing lines directly into multi-vendor setups.
AI Proliferation & Data Governance Watch Points
-
The $1.5 Trillion GenAI Catalyst: Generative AI productivity injections and automated alternative underwriting models are serving as core market accelerators, driving the total global fintech revenue pool to an estimated $1.5 trillion by 2030.
-
The $30 Billion Anti-Fraud Defense Mandate: Because automated networks move transaction volumes at unprecedented speeds, financial platforms are projected to scale their global KYC (Know Your Customer) and KYB (Know Your Business) identity compliance budgets past $30 billion by 2030 to combat AI-driven fraud.
-
The Straight-Through Processing Standard: Premium vendors will compete heavily on data ingestion clarity; systems matching raw invoice data strings against master transaction records aim for automated reconciliation baselines of 85% to 92%.
-
Eliminating Exception Bottlenecks: AI-driven exception, deduction, and dispute management software is scaling at a 24.1% CAGR, utilizing natural language processing to automatically tag and route billing discrepancies without human delays.
-
The 99.99% Systems Uptime Floor: As financial capabilities embed into daily logistics, manufacturing, and procurement workflows, platform selection criteria will mandatorily shift to a strict “four nines” (99.99%) uptime baseline to prevent catastrophic transaction logjams.
-
The Core Performance Metrics Matrix: Long-term platform value will depend on whether adoption improves hard business metrics. High-performing operating teams ignore simple software usage stats and instead evaluate performance using a balanced matrix of four key performance indicators:
-
Activation Rate: The speed and percentage of users who complete financial onboarding.
-
Financial Attach Rate: The average number of integrated financial features adopted per customer profile.
-
Payment Acceptance Rate: The percentage of initiated transactions successfully cleared through underlying payment rails.
-
Loan Approval Rate: The precision and speed of risk engines in approving point-of-sale credit lines using alternative merchant data.
-
Editorial Interpretation and Decision Quality
The final editorial lens for embedded finance is practical decision quality. A statistic is useful only when it helps a business choose a better workflow, set a better target, or avoid a costly blind spot. For example, a market CAGR explains growth momentum, but it does not tell a finance leader which process to fix first. A cycle-time statistic is more actionable when it is tied to a specific bottleneck, owner, and improvement target.
This is why the best report structure combines market data with operating interpretation. Market data explains why the category is expanding. Workflow analysis explains where value is created. Segment analysis explains why different buyers need different roadmaps. Risk analysis explains what should not be automated blindly. Together, these layers make the statistics useful for planning rather than simply interesting to read.
Decision-quality statistics
- Every statistic should answer 1 of 4 questions: scale, adoption, performance, or risk.
- A strong dashboard should show at least 5 operating indicators before leadership relies on it for planning.
- A meaningful improvement target should be time-bound, such as 30, 60, or 90 days after implementation.
- The best benchmark compares before-and-after performance inside the same workflow, not only external averages.
- A useful report should connect market growth to operational choices, not leave market statistics isolated at the top.
Benchmark planning statistics
- Set a 30-day baseline window before launch so volume, cycle time, exceptions, and rework can be compared after rollout.
- Use a 60-day stabilization window after launch before making broad conclusions about ROI or adoption quality.
- Review the top 10 recurring exception reasons and assign owners for the 3 highest-volume causes.
- Track at least 5 operating metrics and 3 business-impact metrics so the scorecard does not become too narrow.
- Compare results across 3 company-size bands and 5 workflow categories before setting long-term targets.
- A mature process should show improvement in at least 2 outcome metrics without increasing risk exceptions by more than 1 review period.
- For high-volume teams, even a 2 percent reduction in rework can matter if the workflow touches thousands of cases per month.
Regional and Company-Size Planning
Implementing embedded finance successfully requires looking past abstract global growth rates and analyzing local infrastructure and corporate realities. A financial workflow that runs seamlessly on instant API bank feeds and automated digital compliance checks in one territory can completely stall in another, forcing a team onto slower, manual fallback routines. Regional planning requires matching market enthusiasm with actual regulatory and technical maturity.
Similarly, corporate size fundamentally dictates the technology rollout. A micro-business handles transaction tracking to solve an immediate, short-term cash crunch. Mid-market companies look for repeatability and automated data matching to free up administrative staff. Global enterprises, meanwhile, prioritize strict risk policies, multi-entity accounting trails, and automated fraud alerts.
A realistic rollout replaces generic industry baselines with segmented maturity targets. This structured planning ensures teams don’t scale automated financial systems faster than their internal data quality and regional compliance controls can handle.
Regional and Segment Planning Statistics
Regional Footprints & Infrastructure Readiness
-
The North American Structural Baseline: Driven by an advanced Banking-as-a-Service (BaaS) ecosystem, North America commands between 36% and 39.1% of the global embedded finance market, with the U.S. domestic market alone projected to reach $468.25 billion by 2034.
-
The European Open-Banking Anchor: Europe controls a 27% slice of the global market share, heavily anchored by the United Kingdom, which commands 30% of total Western European revenue and is on track to scale from $7.2 billion to $21.9 billion.
-
The 19.5% Asia-Pacific Velocity Peak: The Asia-Pacific region is expanding at a rapid 25.72% CAGR, led by India at a 19.5% CAGR and China at 15.8%. India’s expansion is underpinned by its digital public infrastructure, which clears over 100 billion annual digital transactions.
-
Divergent Local Interest Rates: Cross-border embedded lending engines face tightening regional margins; sudden central bank rate pivots (such as benchmark rates climbing to 5%) increase funding costs, directly lowering net interest margins for non-bank platforms.
-
Global Addressable Market Gaps: While the aggregate addressable market for integrated financial tools across North America and Europe stands at $185 billion, actual penetration has only reached $32 billion—revealing that more than 80% of regional business volume relies on disconnected channels.
Company-Size Strategic Roadmaps & Capacity Milestones
-
The 59% SME Vertical Software Standard: Small and medium-sized enterprises rely heavily on specialized business software, with SME adoption of vertical SaaS platforms reaching 59% in the United States.
-
Capturing Merchant Acquiring Volume: Capitalizing on high small-business stickiness, vertical platforms offering integrated checkouts accounted for 36% of total SME payment acquiring revenues, with that share projected to hit 45%.
-
The 70% to 80% Mid-Market Capacity Reclaim: Mid-market enterprises ($50M–$500M) deploying embedded financing and automated receivables slash manual data entry workloads by 70% to 80%, fast-tracking multi-way ledger reconciliation cycles.
-
The 20% Mid-Market Hesitation Window: Despite clear efficiency gains, institutional data reveals a banking stickiness gap: only 20% of mid-market corporate treasurers immediately prefer embedded alternative finance platforms over traditional, deeply entrenched commercial bank lines.
-
The 62.8% Enterprise Security Mandate: Large scale changes corporate architecture priorities; 62.8% of large enterprise financial integrations utilize on-premise or highly secure hybrid cloud deployments to meet strict data isolation demands.
Multi-Tier Maturity Targets & Phased Benchmarks
-
The 90-Day Small-Business Target: For small business setups, a successful early milestone targets 60% workflow visibility and data centralization within the first 90 days rather than forcing full automation on day one.
-
The Mid-Market Standardized Ingestion Target: Mid-market rollouts prioritize cross-team consistency, aiming for 75% standardized data and document ingestion across distributed business units before attempting to layer on advanced AI underwriting tools.
-
The 85% Enterprise Routine-Path Coverage: Enterprise deployments require clear path isolation, targeting an automated 85% straight-through processing rate for routine transactions, while instantly routing exceptions to segregated queues for human review.
-
The 20% Governance Buffer for Regulated Workflows: Within highly regulated fields like healthcare or cross-border trade credit, organizations intentionally keep 10% to 20% of high-value transactions under manual human verification to preserve absolute audit accountability.
-
The Four-Way Performance Segmentation Standard: To prevent broad corporate averages from hiding process bottlenecks, leadership must slice performance across 4 specific metrics: business unit performance, workflow type, client company size, and real-time credit risk exposure.
-
The Practical Expansion Gate: Teams should block wider geographic rollouts until an integrated setup hits a defined stabilization gate: 2 consecutive quarterly review periods demonstrating stable cycle times, decreasing exception volumes, and zero compliance failures.
Research Depth and Methodology Notes
A deeper research view of embedded finance starts by asking what economic pressure creates demand. In some categories the pressure is liquidity, in others it is labor cost, error risk, compliance exposure, customer experience, or revenue leakage. The same market-size number means different things depending on which pressure is strongest. A buyer that is trying to reduce a two-day approval delay evaluates the category differently from a buyer trying to reduce funding gaps or improve data extraction accuracy.
The second research question is whether the category changes a decision or only changes a task. A task-level tool helps a user complete work faster. A decision-level system changes how the business prices, approves, funds, routes, forecasts, or controls an outcome. Categories that reach decision-level impact usually justify stronger investment because they affect margin, liquidity, customer retention, audit quality, or risk exposure.
A third question is how much of the workflow is measurable after implementation. Better systems leave a data trail around intake, routing, timing, exceptions, approvals, and outcomes. That trail matters because it lets leaders compare teams, identify bottlenecks, and run continuous improvement instead of relying on anecdotal user feedback.
The research also needs to separate durable trends from temporary buying waves. A temporary wave may come from budget cycles, vendor hype, or a narrow regulatory deadline. A durable trend appears when several independent forces point in the same direction: volume growth, buyer pain, measurable ROI, easier integration, stronger data availability, and greater need for control.
Methodology statistics and interpretation rules
- Market estimates should be treated as directional when one source includes services or transaction value and another includes only software revenue.
- Adoption percentages should be read together with maturity indicators such as straight-through processing, exception rate, and integration depth.
- Survey results can overstate maturity when respondents count partial digitization as full workflow automation.
- Operational benchmarks should be normalized for volume because a low-volume process can show different economics from a high-volume process.
- Regional comparisons should account for regulation, banking infrastructure, cloud adoption, and local business-payment behavior.
- Internal baselines should be captured before implementation; otherwise teams may not know whether a 10 percent or 30 percent improvement is realistic.
- A reliable benchmark combines at least 2 external references with the company’s own baseline operating data.
Industry and Use-Case Deep Dive
Industry context fundamentally redefines how embedded finance platforms are built, monetized, and evaluated. A standard, blanket benchmark offers little practical value because a retail platform handles entirely different transaction volumes, margins, and data structures than a healthcare software suite or a vertical SaaS provider.
To separate market hype from operating reality, leadership must evaluate embedded finance through sector-specific constraints. The speed of adoption depends directly on an industry’s “data readiness”—sectors with clean, structured digital inputs can automate instantly, while legacy sectors require significant front-end work on document capture and data validation before any financial automation can occur.
Industry-Specific Statistics and Signals
Retail & E-Commerce Platforms: Velocity and Checkout Optimization
-
The 30% Cart Abandonment Shield: Integrating context-aware embedded lending or point-of-sale financing (like Buy Now, Pay Later) directly into retail checkouts boosts cart conversion rates by 20% to 30%, recovering otherwise lost revenue.
-
Lifting Average Order Value (AOV): Retail marketplaces offering embedded installment options realize an immediate 15% to 25% expansion in baseline AOV, as flexible terms lift consumer purchasing confidence.
-
The 2.5x Customer Retention Anchor: E-commerce platforms that offer native embedded payment checkouts retain active users at 2.5 times the rate of competitors who redirect shoppers to clunky, third-party payment gateways.
-
High-Velocity Interchange Capture: Digital storefronts processing micro-transactions capture high margins by leveraging native payment rails, expanding their internal platform take rates to between 2% and 4% per transaction line.
-
The 36.05% Volume Monopolization: Highlighting its mature footprint, the retail and e-commerce vertical controls the largest individual share of the consumer embedded landscape at 36.05% of total end-use volume.
Vertical SaaS Companies: Margin Expansion and Software Monetization
-
The 2x to 5x ARPU Multiplier: Embedding financial features directly into a specialized vertical SaaS platform expands Average Revenue Per User (ARPU) by 2 to 5 times compared to a traditional software-only subscription model.
-
The 73% Merchant Solutions Revenue Flip: Industry leaders demonstrate that software is often just the acquisition hook; mature vertical platforms now generate up to 73% of their total aggregate corporate revenue from embedded merchant solutions rather than software licensing fees.
-
The 9% Contract Value Premium: Specialized B2B SaaS configurations achieve an average 9 percentage point premium lift in Annual Contract Value (ACV) by cleanly bundling credit lines and card issuing into core software tiers.
-
The 20% Churn Reduction Shield: Layering embedded expense management and corporate accounts directly into a business user’s daily operating workflow drops SaaS customer attrition rates by approximately 20%.
-
High Attach Rate Projections: Modern product rollouts indicate that when a B2B vertical platform introduces embedded financial tools, over 40% of its existing active subscriber base adopts the feature within the first 12 months.
Digital Marketplaces: Multi-Vendor Routing and Onboarding Precision
-
The 50% Drop in Merchant Friction: Seamlessly embedding automated KYB (Know Your Business) and identity checks into multi-vendor marketplaces slashes merchant onboarding timelines from days down to minutes, reducing sign-up abandonment by 50%.
-
The 60% Back-Office Rework Reclaim: Automating complex split-payment routing—where an engine instantly separates platform commissions, vendor payouts, tax fields, and shipping fees—cuts manual reconciliation rework by up to 60%.
-
The $15.6 Trillion B2B Enterprise Opportunity: Shifting past simple consumer applications, the global enterprise B2B marketplace transaction engine is projected to reach $15.6 trillion, driven by integrated digital trade credit.
-
Cross-Border Multipliers: Driven by global supply chain diversification, international marketplace payout volume is expanding at an aggressive 15% CAGR, making automated multi-currency compliance modules essential.
-
Plugging Revenue Leakage: Deep API ledger integration allows marketplaces to monitor transactions in real time, cutting duplicate billings, processing errors, and unauthorized chargeback deductions by 40%.
Mobility & Logistics Platforms: Real-Time Liquidity and Asset Velocity
-
The 3x Gig-Worker Loyalty Multiplier: In high-churn gig ecosystems, drivers and operators are 3 times more likely to remain active on a platform that offers free, instant earnings payouts over legacy weekly payment cycles.
-
70%+ Instant Payout Attach Rates: Highlighting the severe demand for immediate liquidity, over 70% of gig workers actively utilize embedded instant-payout wallets when made available on mobility dashboards.
-
The 125% In-Workflow Insurance Explosion: Integrating real-time, usage-based commercial auto and transit insurance directly into the driver checkout flow yields a 125% spike in policy adoption rates via unified APIs.
-
Compressing Operational Friction: Transitioning freight and delivery networks from manual paper invoicing to embedded digital workflows slashes transport documentation processing cycles from 17.4 days down to 3.1 days.
-
The Fleet Continuity Safeguard: Providing instant, embedded fuel-card credit lines directly within the operator application keeps fleets moving, reducing costly empty-tank downtime events by more than 20%.
Healthcare Software: Payer-Loop Compression and Regulated Workflows
-
Bypassing the 45-Day Denial Loop: Traditional manual healthcare insurance reimbursement and billing loops take an average of 30 to 45 days to resolve; embedding automated eligibility verification drops processing cycles down to hours.
-
The 26.12% Hyper-Growth Vertical: Driven by a critical need to bypass broken insurance tracking systems, the healthcare and pharmaceutical vertical is the fastest-growing enterprise embedded finance segment, expanding at an accelerated 26.12% CAGR.
-
The 28% Administrative Cost Cut: Implementing automated patient billing, copay routing, and health savings account (HSA) payment rails directly into electronic health record (EHR) software cuts healthcare administrative overhead by 28%.
-
The $30 Billion Anti-Fraud Defense Standard: Because automated medical and financial networks move transaction data at high velocities, healthcare platforms face strict data demands, contributing to a global identity compliance and security budget projected to pass $30 billion.
-
The 99.99% Systems Uptime Floor: Because healthcare workflows deal with critical client care and sensitive data, system uptime requirements adhere to a strict 99.99% (“four nines”) operational standard to prevent dangerous processing logjams.
Operating Example and Practical Business Case
To understand how high-level market statistics translate into day-to-day corporate reality, consider a mid-market organization processing a baseline volume of 8,000 relevant financial or workflow items (such as invoices, supply chain advances, or payment clearings) each month. When evaluated through a traditional software-licensing lens, the business case can look deceptively simple. However, evaluating this scenario through a practical operations lens reveals that legacy, fragmented workflows act as a heavy, continuous tax on corporate capacity.
When a workflow depends on manual spreadsheets, disconnected email chains, and physical or multi-layered approvals, minor operational frictions scale exponentially. If an organization fails to establish a clear local baseline of its pre-automation metrics—including touch counts, average processing cycles, and localized error frequencies—it will struggle to prove actual value, even if the finance team feels a generic sense of relief after a software rollout.
A mathematically grounded operational model shows that the true return on investment from financial automation does not stem from a modern software dashboard. Instead, it comes from fundamentally restructuring the cost-per-transaction, shrinking exception queues, and freeing up back-office labor for strategic capital management.
Practical Operating Calculations & Financial Modeling
Baseline Capacity & Labor Drain Core
-
The 533-Hour Labor Drain: If a team processes 8,000 workflow items per month and encounters just 4 minutes of avoidable manual handling per item, the organization wastes 533.33 hours of monthly capacity on non-strategic, administrative data entry.
-
The 133-Hour Leverage Scale: At a steady operating volume of 8,000 monthly items, every single minute of manual handling eliminated or automated reclaims exactly 133.33 hours of monthly staff capacity.
-
Annualized Labor Costs: Assuming a fully loaded internal finance clerk cost of $35.00 per hour, the baseline 4-minute friction creates a hidden operational expense of $18,666.55 per month, translating to an annualized loss of $223,998.60 in pure labor capacity.
Rework, Quality Errors, and Exception Metrics
-
The 3% Quality Penalty: Operating with a standard 3 percent manual exception rate on 8,000 items injects 240 broken cases into the workflow every month, requiring manual intervention before the ledger can settle.
-
The 80-Hour Rework Black Hole: If each manual exception or data mismatch requires an average of 20 minutes to flag, track down, and fix, the team burns an additional 80 hours of high-skill labor per month purely on error correction.
-
The Real Cost of Exceptions: Combining baseline manual entry with error correction pushes the total monthly labor sinkhole to 613.33 hours, which costs the business $21,466.55 every single month in administrative overhead.
-
The Pareto Exception Rule: Internal ledger audits reveal that the top 5 exception reasons (typically price mismatches, missing purchase orders, duplicate billings, incorrect tax fields, and transport documentation delays) account for roughly 80% of all workflow blockages.
-
The Quarterly Elimination Target: A highly practical operating benchmark for continuous improvement is to review the top 5 exception categories every 30 days, with a strict goal to eliminate at least 1 recurring root cause every quarter through automated system logic.
Optimization Impact & Reclaimed Value
-
The 90-Second Micro-Saving: Compressing average handling time by just 90 seconds per item across 8,000 transactions instantly claws back 200 hours of monthly operational capacity.
-
Halving the Error Index: Deploying automated multi-way data matching that drops the exception rate from 3% down to 1.5% eliminates 120 rework loops, saving another 40 hours of monthly investigation time.
-
Aggregate Dollar Recoveries: Achieving this combined optimization (saving 90 seconds on standard items and halving rework) recovers 240 total hours per month, instantly adding $8,400.00 in monthly value or $100,800.00 in annual recurring savings.
-
Cycle Time vs. Software Cost: Reducing average processing cycle times by 20 percent delivers significantly higher balance-sheet value than bargaining for a 5 percent reduction in software license costs, especially when the workflow directly impacts corporate cash velocity and compliance safety.
-
Plugging Revenue Leakage: Automated data verification lowers invoice exception rates, helping companies avoid late payment penalties and capture early-settlement discounts to yield an average $94,000 to $150,000 in immediate annual bottom-line savings for mid-sized firms.
Performance Scorecards & Reporting Dimensions
-
The Three-Dimensional Dashboard Standard: High-performing corporate management dashboards avoid vanity metrics, requiring a balanced view across at least 3 distinct operating dimensions:
-
Total Volume: Raw transaction throughput per period.
-
Exception Volume: The exact percentage of items requiring human intervention.
-
Business Outcome Movement: Tangible financial impacts, such as realized cash availability and changes in Days Sales Outstanding (DSO).
-
-
The Embedded Finance Scorecard Rule: For embedded finance rollouts, management scorecards must connect the user activation rate directly with the platform take rate. This link ensures leaders can see exactly how customer activity converts into real platform margins.
-
The Four-Way Segmentation Model: To prevent broad averages from masking operational problems, teams should slice their performance data across at least 4 distinct reporting dimensions:
-
Business Unit: Isolating high-performing subsidiaries from lagging divisions.
-
Workflow Type: Tracking performance variances between standard invoicing, spot factoring, and embedded lending lines.
-
Company Size: Documenting how transaction velocity changes when dealing with small suppliers versus global enterprise buyers.
-
Risk Level: Correlating automation levels with credit risk exposure to ensure speed never compromises compliance.
-
Frequently Asked Questions
What does embedded finance measure?
Embedded Finance statistics measure market growth, adoption, workflow volume, operating performance, and business impact. The most useful numbers are not only market-size figures. They also show how teams use the tools, where manual work remains, which segments are growing fastest, and which metrics prove that the process is improving.
Why do published embedded finance estimates differ?
Estimates differ because research firms define the market differently. Some include only software revenue. Others include services, transaction value, financing volume, implementation, platform fees, or adjacent workflow tools. The best approach is to compare direction, assumptions, and operational relevance rather than treating every estimate as directly interchangeable.
Which metrics matter most for embedded finance?
The strongest scorecard includes activation rate, financial attach rate, payment acceptance rate, loan approval rate. More mature teams also track platform take rate, risk-adjusted revenue, customer retention lift, partner adoption. This combination shows speed, quality, value, and risk rather than only showing whether a tool has been deployed.
How should small businesses use these statistics?
Small businesses should use these statistics as a way to prioritize practical improvements. The goal is not to copy enterprise benchmarks. It is to identify where manual work, payment timing, data quality, approval delays, or customer experience problems are creating avoidable pressure.
How should enterprises use these statistics?
Enterprises should use the statistics to compare process maturity across teams, countries, business units, and systems. At scale, the value often comes from standardization, integration, auditability, and exception management rather than only from time saved by individual users.
What is the most common implementation mistake?
The most common mistake is buying technology before clarifying the workflow. Teams need to define data requirements, approval rules, exception handling, ownership, integrations, and success metrics before expecting the tool to produce consistent results.
How does AI affect embedded finance?
AI can improve classification, data extraction, recommendations, anomaly detection, and workflow guidance. It should still operate inside clear controls, especially when the process affects payments, credit decisions, customer data, financial reporting, or contractual commitments.
What should leaders do before investing?
Leaders should document the current baseline: volume, cycle time, cost, error rate, manual touch count, exception reasons, and downstream rework. That baseline makes it easier to choose the right first use case and prove whether the investment actually improves the business.
Final Takeaway
Embedded Finance Statistics show a category shaped by the same forces affecting modern finance and operations: demand for faster workflows, better data, stronger controls, and clearer visibility. The market numbers show investment momentum, but the more useful story is operational. Businesses want tools that reduce friction, improve decisions, and make work easier to manage as volume and complexity grow.
The most important lesson is that statistics should lead to better questions. Which workflow is slowest? Which errors create the most rework? Which metric would change a customer, supplier, lender, finance, or operations outcome? Which process can be improved first without weakening control? Companies that answer those questions carefully will get more value from embedded finance than companies that only follow market growth headlines.


