Coffee is one of the world’s most important beverage markets because it behaves like a daily consumer habit and a traded agricultural commodity at the same time. A single cup can connect a smallholder farmer, an origin-country exporter, a shipping route, a roaster, a supermarket shelf, a café counter, an office machine, or a ready-to-drink beverage brand. That is why coffee market statistics are most useful when they separate production, consumption, trade, format mix, price pressure, sustainability risk, and regional demand.
The headline numbers show the scale. World green coffee production reached 11,064,205 tones in 2023, equal to about 184.4 million 60-kg bags. The global coffee market was estimated at USD 249.34 billion in 2025 and is forecast to reach USD 380.28 billion by 2033, while another retail-focused forecast places worldwide coffee revenue at USD 107.91 billion in 2026. Brazil alone produced 3,405,267 tones in 2023, Viet Nam produced 1,956,782 tones, and Indonesia produced 760,192 tones. On the demand side, 67% of American adults reported drinking coffee in the past day in 2024, and 75% had coffee in the past week.
Executive Coffee Market Benchmarks
The numbers that define the coffee market
The executive benchmark view puts the coffee market into one compact dashboard. These figures show production scale, market value, country concentration, daily consumption, and specialty coffee momentum. They should be read together because coffee demand depends on consumer habit while supply depends on a concentrated group of producing countries.
• World green coffee production reached 11,064,205 tones in 2023, or about 184.4 million 60-kg bags.
• The global coffee market was estimated at USD 249.34 billion in 2025.
• The global coffee market is projected to reach USD 380.28 billion by 2033.
• A leading forecast places coffee market growth at a 5.4% CAGR from 2026 to 2033.
• Worldwide coffee revenue is forecast at USD 107.91 billion in 2026.
• Another global market forecast points to a 3.46% CAGR for 2026–2030.
• Up to 25 million farming households globally account for coffee output.
• Smallholders account for about 80% of world coffee output.
• Global coffee production amounts to more than USD 20 billion annually.
• Total coffee trade is estimated above USD 25 billion annually.
• Brazil and Viet Nam together account for nearly 50% of world coffee production.
• Brazil produced 3,405,267 tones of green coffee in 2023, equal to 30.78% of world output.
• Viet Nam produced 1,956,782 tones in 2023, equal to 17.69% of world output.
• 67% of U.S. adults had coffee in the past day in 2024, while 75% had it in the past week.
• 45% of U.S. adults had specialty coffee in the past day in 2024, slightly above the 44% traditional coffee benchmark.
Coffee market readout
The market is not one simple beverage category. It is a connected system of origin-country production, commodity prices, global trade, retail formats, café traffic, specialty demand, convenience products, and daily consumer routines. The strongest coffee analysis separates production, consumption, trade, price, channel, and format data.
Why Coffee Carries Global Beverage and Commodity Stakes
Market-size and growth benchmarks
Coffee carries market stakes because it sits at the intersection of beverage spending, farming livelihoods, global trade, and commodity pricing. Growth can come from premium products and new formats, but the supply base remains exposed to weather and price cycles.
• The global coffee market value benchmark of USD 249.34 billion in 2025 shows the economic scale behind a daily beverage habit.
• The forecast of USD 380.28 billion by 2033 shows that value growth is expected to continue even as mature markets are already highly penetrated.
• World coffee production of 11.06 million tones in 2023 shows that coffee growth remains tied to agricultural supply capacity.
• The 184.4 million 60-kg bag equivalent is the production base that roasters and traders watch when evaluating availability.
• Coffee farming touches up to 25 million households globally, giving the market a strong smallholder and rural-income dimension.
• Smallholders produce about 80% of world coffee output, which makes farm economics central to long-term supply stability.
• Coffee production is valued at more than USD 20 billion annually, while coffee trade is estimated above USD 25 billion annually.
• World coffee exports reached 12.05 million bags in April 2026, compared with 12.17 million bags in April 2025.
• Exports in the first seven months of coffee year 2025/26 reached 82.27 million bags, almost flat against 82.25 million bags one year earlier.
• The ICO composite price averaged 273.70 US cents/lb in March 2026 and increased 2.3% month over month.
• In August 2025, the ICO composite price averaged 297.05 US cents/lb after a 14.6% month-over-month increase.
• U.S. retail coffee prices rose from USD 6.78/lb in December 2024 to USD 8.87/lb in August 2025.
Table 1. Global Coffee Market Signal Map
| Signal | Benchmark | Market meaning |
|---|---|---|
| Global market size | USD 249.34B in 2025 | Coffee as a large global beverage category |
| Forecast value | USD 380.28B by 2033 | Continuing value expansion |
| Market CAGR | 5.4% from 2026-2033 | Medium-term growth pace |
| World production | 11.06M tones in 2023 | Agricultural supply base |
| Coffee farming households | Up to 25M households | Rural income linkage |
| Smallholder output | 80% of world output | Farm-level vulnerability |
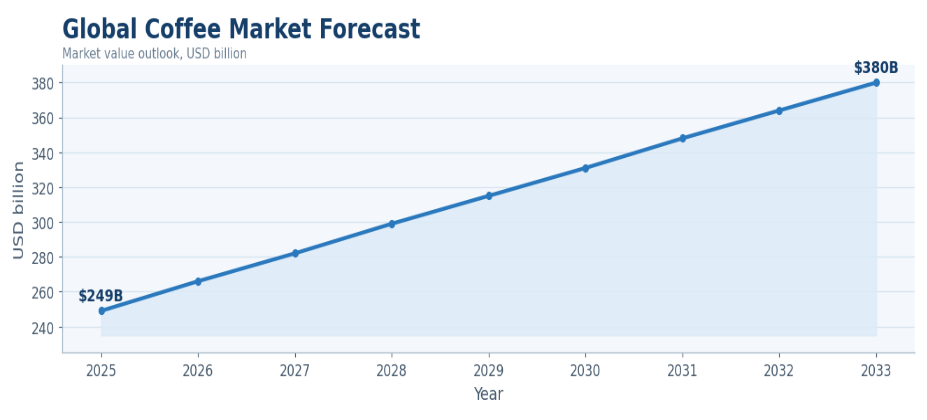
Figure 1. Coffee market value growth should be read alongside production, trade, retail demand, and price pressure.
Market-size readout
Coffee market growth is driven by value, not only by more cups. Premiumization, specialty coffee, capsules, instant coffee, RTD beverages, café culture, and emerging-market adoption can all increase market value while supply remains exposed to crop cycles and price volatility.
Global Coffee Production Statistics
Production-volume benchmarks
Production statistics explain the supply side of the coffee market. The most important point is concentration: a small number of countries produce a large share of the coffee used by roasters, cafés, retailers, and instant coffee brands around the world.
• Brazil ranked #1 among tracked coffee producers in 2023 with 3,405,267 tones of green coffee.
• Brazil accounted for 30.78% of world green coffee production and 56.75 million 60-kg bags in 2023.
• Viet Nam ranked #2 with 1,956,782 tones, representing 17.69% of world production and 32.61 million bags.
• Indonesia ranked #3 with 760,192 tones, or 6.87% of world output.
• Colombia produced 680,858 tone, equal to 6.15% of world output and about 11.35 million bags.
• Ethiopia produced 559,291 tones, equal to 5.06% of world output and about 9.32 million bags.
• Uganda produced 376,638 tone, equal to 3.40% of world output and about 6.28 million bags.
• Peru produced 352,645 tone, equal to 3.19% of world output.
• India produced 338,300 tone, equal to 3.06% of world output.
• Honduras produced 311,160 tone, equal to 2.81% of world output.
• Guatemala produced 225,000 tone, and Mexico produced 224,619 tone.
• Brazil’s 2023 output was about 31.53 times Kenya’s tracked output, which shows the extreme scale difference between the largest and smaller specialty origins.
• The Americas accounted for about 49.98% of world output in the regional summary, while Asia-Pacific accounted for about 30.93%.
• Africa accounted for about 11.27% of world green coffee production in the tracked regional summary.
Top Coffee-Producing Countries
| Rank | Country | Production | World Share |
|---|---|---|---|
| 1 | Brazil | 3,405,267 tones | 30.78% |
| 2 | Vietnam | 1,956,782 tones | 17.69% |
| 3 | Indonesia | 760,192 tones | 6.87% |
| 4 | Colombia | 680,858 tones | 6.15% |
| 5 | Ethiopia | 559,400 tones | 5.06% |
| 6 | Uganda | 384,361 tones | 3.47% |
| 7 | India | 384,000 tones | 3.47% |
| 8 | Honduras | 369,551 tones | 3.34% |
| 9 | Peru | 332,848 tones | 3.01% |
| 10 | Guatemala | 316,108 tones | 2.86% |
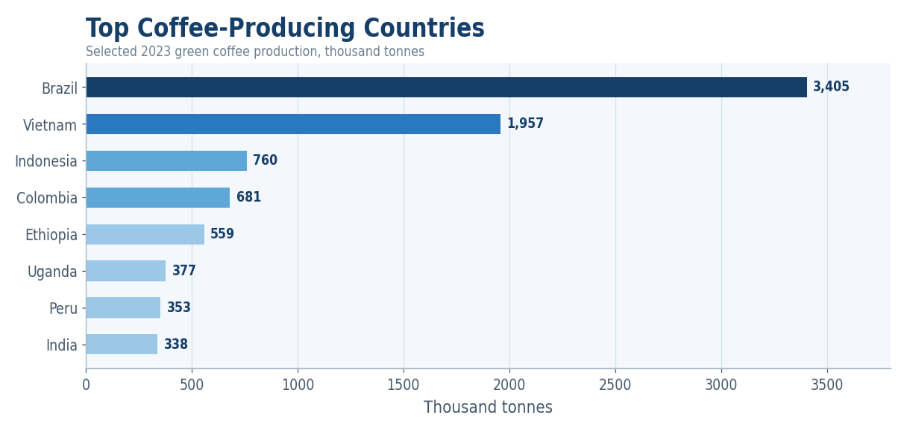
Figure 2. Coffee production is concentrated across a few high-output origin countries.
Production readout
Coffee production is concentrated in a limited group of origin countries. Brazil and Viet Nam shape global supply, Colombia supports premium Arabica trade, Ethiopia carries origin and specialty importance, and countries such as Uganda, Indonesia, Honduras, Peru, India, Guatemala, and Mexico influence regional balance.
Coffee Consumption Statistics
Consumption and demand benchmarks
Consumption statistics explain why coffee retains value even in mature markets. In developed markets, growth often comes from specialty beverages, premium beans, and café experiences. In emerging markets, growth often comes from urban adoption, instant coffee, and branded formats.
• 67% of American adults had coffee in the past day in 2024.
• The U.S. past-day drinking benchmark was 49% in 2004, showing an 18-point increase by 2024.
• 75% of American adults had coffee in the past week in 2024.
• 45% of American adults had specialty coffee in the past day in 2024.
• Traditional coffee past-day consumption stood at 44%, meaning specialty coffee slightly exceeded traditional coffee in the 2024 U.S. benchmark.
• Specialty coffee past-day consumption in the U.S. was up 80% from 2011 to 2024.
• The United Kingdom drinks approximately 98 million cups of coffee per day.
• The UK coffee industry contributed an estimated GBP 9.1 billion in GVA in 2017.
• The UK coffee industry output contribution was estimated at GBP 17.7 billion in 2017.
• The UK coffee industry supports more than 210,000 jobs.
• Brazil survey data showed 24% of respondents reducing coffee intake in 2025, compared with 3% in 2023.
• In Brazil, daily consumption above six cups fell from 29% of respondents in 2023 to 26% in 2025.
• European companies imported 96.6% of coffee directly from producing-country suppliers in 2024.
• Only 3.4% of European coffee imports came through non-producing countries in 2024.
Table 3. Coffee Consumption and Demand Benchmarks
| Market | Benchmark | Interpretation |
|---|---|---|
| United States | 67% past-day coffee in 2024 | Large daily-demand base |
| United States | 75% past-week coffee in 2024 | Broad household penetration |
| United States | 45% specialty past-day consumption | Premiumization has mainstream reach |
| United Kingdom | 98M cups/day | High routine consumption |
| Brazil | 24% reducing intake in 2025 | Price sensitivity signal |
| Europe | 96.6% direct imports from origins | Strong source-to-Europe trade link |
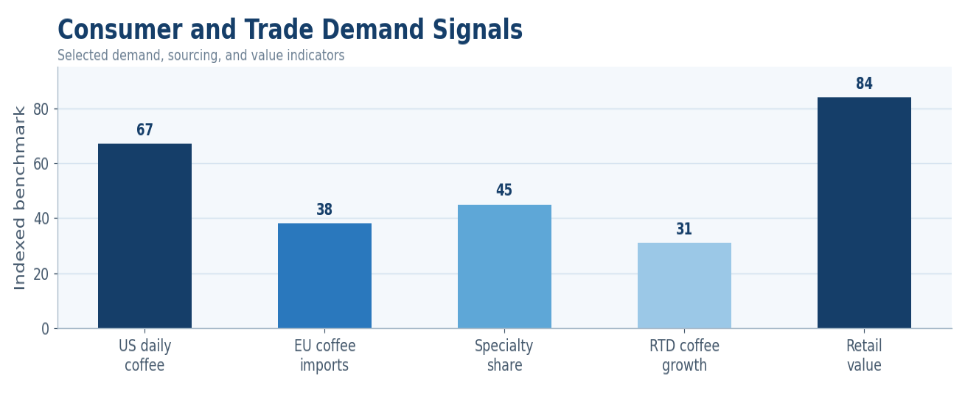
Figure 3. U.S. coffee habits and European sourcing patterns show how demand and trade connect.
Consumption readout
Coffee demand is shaped by habit in mature markets and lifestyle adoption in emerging markets. Mature markets often grow through premiumization and specialty coffee, while emerging markets grow through urban cafés, RTD coffee, instant coffee, and branded retail formats.
Coffee Trade, Exports, and Imports Statistics
Export and import benchmarks
Trade statistics show how coffee moves from origin countries to roasting hubs and consumer markets. They also show why green coffee volume and retail coffee value should not be treated as the same signal.
• Brazil led tracked export leaders with 41,375,604 ICO export bags and 2,482,536 ICO export tone.
• Brazil also recorded about USD 7.351 billion in tracked coffee export value.
• Viet Nam exported 28,600,300 ICO bags and 1,716,018 ICO export tone.
• Colombia exported 10,897,760 ICO bags and 653,866 ICO export tone.
• India exported 6,484,415 ICO bags and 389,065 ICO export tone.
• Indonesia exported 6,200,363 ICO bags and 372,022 ICO export tone.
• Uganda exported 6,006,182 ICO bags and 360,371 ICO export tone.
• Ethiopia exported 4,488,729 ICO bags and 269,324 ICO export tone.
• Honduras exported 5,337,205 ICO bags and 320,232 ICO export tone.
• Brazil accounted for 32.35% of tracked export bags in the export leaders table.
• Viet Nam accounted for 22.36% of tracked export bags.
• Colombia accounted for 8.52% of tracked export bags.
• European coffee import data shows that 15.9% of imports were redistributed to other European countries.
• Germany accounted for 36.6% of EU green coffee imports in 2024.
Table 4. Coffee Export Leaders
| Rank | Country | ICO Export Bags | Tracked Share |
|---|---|---|---|
| 1 | Brazil | 41,375,604 | 32.35% |
| 2 | Vietnam | 28,600,300 | 22.36% |
| 3 | Colombia | 10,897,760 | 8.52% |
| 4 | India | 6,484,415 | 5.07% |
| 5 | Indonesia | 6,200,363 | 4.85% |
| 6 | Uganda | 6,057,793 | 4.74% |
| 7 | Honduras | 5,182,124 | 4.05% |
| 8 | Peru | 3,805,060 | 2.98% |
Trade readout
Coffee trade separates production from value capture. Many producing countries export green coffee, while importing and re-exporting markets often capture value through roasting, packaging, branding, private label, café supply, and distribution.
Coffee Type Statistics
Product-format benchmarks
Coffee type data is important because not every coffee product grows for the same reason. Arabica, Robusta, instant coffee, RTD coffee, pods, whole bean, ground coffee, and private label each answer a different consumer need.
• Arabica remains central to specialty, single-origin, and premium roast positioning, while Robusta is critical for instant coffee, espresso blends, and value-oriented formats.
• World output of 184.4 million 60-kg bags gives roasters a supply base that must be split by origin, species, quality, and processing method.
• Brazil’s 56.75 million bag equivalent makes it essential for both Arabica and blended coffee supply chains.
• Viet Nam’s 32.61 million bag equivalent makes it a key benchmark for Robusta-heavy products, instant coffee, and value blends.
• Indonesia’s 12.67 million bag equivalent supports both mainstream and origin-specific coffee demand.
• Colombia’s 11.35 million bag equivalent supports premium Arabica positioning in retail and café channels.
• Ethiopia’s 9.32 million bag equivalent gives the specialty market an origin story and flavor-profile benchmark.
• U.S. specialty coffee past-day consumption of 45% shows that premium formats have moved beyond niche drinkers.
• RTD coffee, cold brew, pods, capsules, whole bean, ground coffee, and instant coffee should be tracked separately because they serve different use occasions.
• Instant coffee remains important for affordability and convenience in markets where branded cafés and premium beans are still developing.
• Pods and capsules compete on convenience and portion control, while whole bean and single-origin formats compete on quality and home brewing experience.
• Private-label coffee becomes more important when retail coffee prices rise and consumers seek value without abandoning daily coffee habits.
Table 5. Coffee Format Comparison
| Format | Growth Role | Why it matters |
|---|---|---|
| Arabica | Premium and specialty base | Supports quality, origin, and café positioning |
| Robusta | Instant and value blend base | Affordability and espresso blend strength |
| Ground coffee | Core retail format | Protects daily home consumption |
| Whole bean | Premium home brewing | Supports loyalty and freshness claims |
| Pods/capsules | Convenience and portion control | Raises value per serving |
| RTD/cold brew | On-the-go and youth demand | Expands coffee into convenience occasions |
| Private label | Value protection | Grows when retail prices pressure households |
Format readout
Coffee market growth depends heavily on format mix. Specialty beans, whole-bean coffee, pods, capsules, cold brew, RTD coffee, and premium roast formats can increase market value even when total cup volume grows slowly.
Specialty Coffee and Premiumization Statistics
Specialty and premium benchmarks
Specialty coffee is the part of the market where taste, origin, brewing method, café culture, and sustainability become part of the value proposition. It is not only a product format; it is a premiumization pathway.
• 45% of U.S. adults had specialty coffee in the past day in 2024.
• Traditional coffee past-day consumption stood at 44%, making specialty slightly larger in that benchmark.
• Specialty coffee past-day consumption was up 80% from 2011 to 2024.
• Colombia produced 680,858 tone in 2023, supporting premium Arabica supply and brand-recognized origin claims.
• Ethiopia produced 559,291 tone in 2023 and remains one of the strongest origin stories for specialty coffee.
• Kenya produced 107,980 tone in 2023, much smaller than Brazil but important for differentiated specialty profiles.
• Organic, Fairtrade, Rainforest Alliance, traceable, and single-origin products are important because consumers increasingly link premium coffee with origin and trust.
• Specialty drinks in cafés help lift ticket size because espresso-based beverages, cold brew, and flavored options are sold as experiences rather than commodity cups.
• Home-brewing equipment supports premiumization by encouraging whole bean, fresh grinding, roast education, and subscription buying.
• Premiumization works best when brands explain taste, origin, roast level, producer story, sustainability, and brewing method.
Table 6. Specialty Coffee Diagnostic
| Specialty Signal | Benchmark | Market meaning |
|---|---|---|
| U.S. specialty past-day | 45% of adults | Specialty is mainstream |
| Traditional past-day | 44% of adults | Slightly exceeded traditional |
| Specialty growth | Up 80% since 2011 | Shows long-term premiumization |
| Colombia production | 680,858 tones | Premium Arabica supply base |
| Ethiopia production | 559,291 tones | Origin and specialty identity |
| Kenya production | 107,980 tones | Smaller volume, strong specialty profile |
Specialty coffee readout
Specialty coffee turns coffee from a commodity beverage into an experience category. It increases the importance of origin, roast quality, brewing method, sustainability, café experience, and brand trust.
Retail, Café, and Foodservice Coffee Statistics
Channel benchmarks
Channel data separates where coffee is consumed and how money is captured. The same consumer may drink retail coffee at home, buy a latte at a café, pick up RTD coffee from a convenience store, and use office coffee during the workday.
• At-home coffee remains the backbone of daily frequency because consumers can keep drinking coffee even when café prices rise.
• Cafés convert coffee into an experience channel where premium beverages, espresso drinks, cold brew, and social occasions raise ticket value.
• Convenience stores and RTD coffee capture on-the-go demand from commuters, younger consumers, and impulse buyers.
• Office coffee and vending coffee remain important because routine consumption often happens during workdays.
• Online subscriptions help brands build loyalty by turning repeat purchases into direct relationships.
• UK coffee demand illustrates the employment and service-channel role, with more than 210,000 jobs connected to the coffee industry.
• European redistribution of 15.9% of coffee imports highlights the importance of warehousing, roasting, packaging, and trade hubs.
• Brazilian consumption pressure in 2025 shows that affordability can change daily routines when retail prices move sharply.
• U.S. daily coffee penetration of 67% shows why retail brands compete heavily for morning occasions.
• U.S. past-week penetration of 75% shows that coffee remains a broad household product, not only a café category.
Table 7. Coffee Channel Comparison
| Channel | Core Demand Signal | Market Role |
|---|---|---|
| At-home retail | Daily household routine | Protects frequency |
| Cafés | Premium and social consumption | Raises ticket value |
| Convenience/RTD | On-the-go demand | Captures impulse occasions |
| Office/vending | Workday routine | Supports recurring cups |
| Online subscription | Repeat buying | Builds direct loyalty |
| Foodservice | Travel and hospitality | Expands institutional demand |
Channel readout
Coffee demand runs through different habits. At-home coffee protects daily frequency, cafés create premium experiences, convenience retail supports on-the-go consumption, and online subscriptions build loyalty.
Regional Coffee Market Statistics
Regional and country-level benchmarks
Regional statistics make the market easier to interpret because coffee regions play different roles. Some regions produce coffee, some import and roast coffee, and some do both while building fast-growing consumer demand.
• The Americas produced 5,529,959 tracked tone of coffee in 2023, equal to about 92.17 million 60-kg bags.
• The Americas represented about 49.98% of world production in the regional summary and 54.22% of tracked production.
• Asia-Pacific produced 3,421,973 tracked tone, equal to about 57.03 million bags.
• Asia-Pacific represented about 30.93% of world production and 33.55% of tracked production.
• Africa produced 1,246,677 tracked tone, equal to about 20.78 million bags.
• Africa represented about 11.27% of world output and 12.22% of tracked production.
• Brazil, Colombia, Peru, Honduras, Guatemala, Mexico, Nicaragua, Costa Rica, and El Salvador anchor the Americas coffee production base.
• Viet Nam, Indonesia, India, Papua New Guinea, and Laos anchor the Asia-Pacific production base.
• Ethiopia, Uganda, Kenya, Tanzania, and Côte d’Ivoire anchor the Africa production base in the tracked dataset.
• Europe plays a different role because it is not a production hub but is a major import, roasting, and redistribution market.
• European companies sourced 96.6% of coffee imports directly from producing countries in 2024.
• Germany accounted for 36.6% of EU green coffee imports in 2024, making it a key European coffee hub.
Table 8. Regional Coffee Production Snapshot
| Region | Tracked Production | Share of World |
|---|---|---|
| Americas | 5,529,959 tones | 49.98% |
| Asia-Pacific | 3,421,973 tones | 30.93% |
| Africa | 1,246,677 tones | 11.27% |
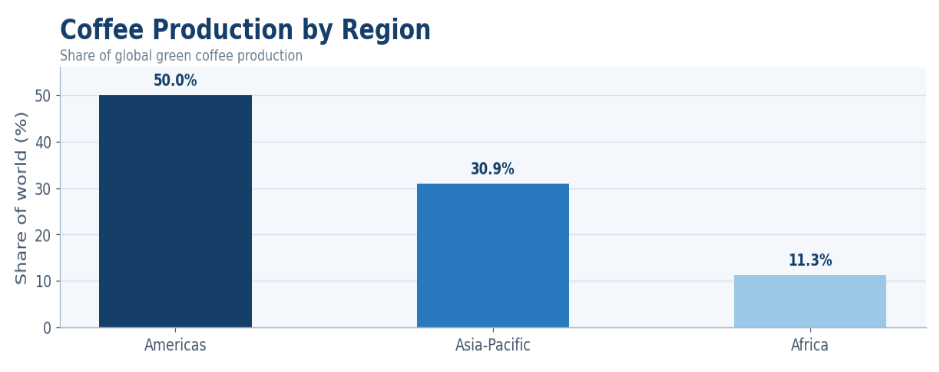
Figure 4. Regional production data shows how strongly the coffee supply base leans toward the Americas and Asia-Pacific.
Regional readout
Coffee is global, but regional patterns are different. Europe is an import and consumption hub, North America is a specialty and retail-value market, Asia-Pacific is a production and consumption growth engine, Latin America is both origin and demand base, and Africa contributes origin diversity and specialty value.
Country-Level Coffee Production Intelligence
Producer-country benchmarks
Country-level production intelligence is essential for sourcing, pricing, and market-risk planning. The largest origins create volume stability, while smaller origins create differentiation and specialty value.
• Brazil’s 3.41 million tone in 2023 made it the largest coffee-producing country in the tracked FAOSTAT data.
• Viet Nam’s 1.96 million tone made it the second-largest producer and a key benchmark for Robusta supply.
• Indonesia’s 760,192 tone made it the third-largest producer in the tracked 2023 table.
• Colombia’s 680,858 tone made it a leading premium Arabica origin.
• Ethiopia’s 559,291 tone made it the largest tracked African origin in the production table.
• Uganda’s 376,638 tone made it a major African exporter and an increasingly visible origin.
• Peru’s 352,645 tone made it a significant South American producer.
• India’s 338,300 tone gave Asia-Pacific a diversified production base beyond Viet Nam and Indonesia.
• Honduras’s 311,160 tone kept Central America relevant to the origin map.
• Guatemala’s 225,000 tone and Mexico’s 224,619 tone were close in scale in 2023.
• Nicaragua produced 180,000 tone, while Côte d’Ivoire produced 150,584 tone.
• Costa Rica produced 85,090 tone, a smaller volume but a strong origin identity.
• Tanzania produced 68,049 tone, and Papua New Guinea produced 66,084 tone.
• Laos produced 105,000 tone, showing that smaller Asian origins also matter in regional sourcing.
Table 9. Country-Level Production Intelligence
| Country | Role | Why it matters |
|---|---|---|
| Brazil | Largest producer | Sets global supply tone |
| Vietnam | Second-largest producer | Anchors Robusta and instant supply |
| Indonesia | Large Asia-Pacific origin | Diversifies regional supply |
| Colombia | Premium Arabica origin | Supports quality and brand identity |
| Ethiopia | African origin leader | Supports specialty differentiation |
| Uganda | African export growth | Adds Robusta and Arabica diversity |
Producer-country readout
Coffee supply risk is country-specific. Weather in Brazil, Robusta output in Viet Nam, disease pressure in Latin America, and export conditions in Africa can change availability and pricing for the global market.
Coffee Prices, Inflation, and Commodity Risk Statistics
Price and cost benchmarks
Price statistics connect the commodity market to the retail shelf and café menu. A small change in green coffee cost can move through roasters, retailers, foodservice buyers, and consumers in different ways.
• The ICO composite indicator price averaged 273.70 US cents/lb in March 2026.
• The March 2026 ICO composite benchmark increased 2.3% from February 2026.
• The ICO composite price averaged 297.05 US cents/lb in August 2025.
• The August 2025 ICO composite benchmark rose 14.6% from July 2025.
• U.S. retail coffee prices reached USD 8.87/lb in August 2025.
• U.S. retail coffee prices were USD 6.78/lb in December 2024.
• Coffee futures reached USD 4.29/lb earlier in 2025.
• Brazilian survey data showed 24% of respondents reducing coffee intake in 2025 compared with 3% in 2023.
• Brazilian daily consumption above six cups fell from 29% in 2023 to 26% in 2025.
• World exports in April 2026 were 12.05 million bags, slightly below 12.17 million bags in April 2025.
• Flat export movement in the first seven months of coffee year 2025/26 shows that price changes can occur even when trade volume looks stable.
• Price pressure affects farmers, traders, roasters, retailers, cafés, and consumers differently.
Table 10. Coffee Price-Risk Diagnostic
| Risk Signal | Benchmark | Market Impact |
|---|---|---|
| ICO composite price | 273.70 US cents/lb in Mar 2026 | Commodity cost pressure |
| ICO composite price | 297.05 US cents/lb in Aug 2025 | Price volatility signal |
| U.S. retail price | USD 8.87/lb in Aug 2025 | Consumer affordability pressure |
| U.S. retail price | USD 6.78/lb in Dec 2024 | Shows retail price increase |
| Coffee futures | USD 4.29/lb peak in 2025 | Roaster cost risk |
| Brazil intake reduction | 24% in 2025 survey | Demand response to prices |
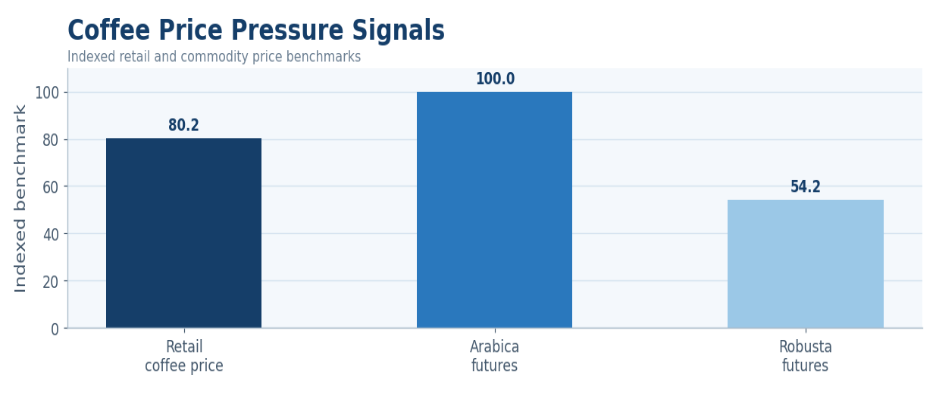
Figure 5. Retail and futures benchmarks show how price pressure reaches consumers and roasters.
Price readout
Coffee prices affect farmers, traders, roasters, retailers, cafés, and consumers differently. The best price analysis separates commodity costs, retail prices, café menu prices, and consumer willingness to pay.
Sustainability, Climate, and Supply-Chain Risk Statistics
Climate and supply-chain benchmarks
Sustainability statistics matter because coffee is exposed to farmer economics, temperature shifts, water stress, crop disease, land-use rules, and certification costs. These issues can affect both brand trust and physical supply.
• Up to 25 million farming households globally are connected to coffee output.
• Smallholders account for about 80% of world coffee output.
• The top five coffee-producing nations had an average of 57 extra days per year above 30°C from 2021 to 2025.
• El Salvador recorded 99 additional hot days in the 2021–2025 climate benchmark.
• Brazil recorded 70 additional hot days in the same climate-risk benchmark.
• Ethiopia recorded 34 additional hot days in the same benchmark.
• Climate pressure matters because coffee quality, flowering, yield, pest risk, and harvest timing are sensitive to temperature and rainfall.
• Coffee leaf rust, drought, frost, and extreme rainfall can reduce output or change quality in key origins.
• Traceability requirements matter because buyers increasingly need to prove origin, sourcing standards, and land-use compliance.
• Certification costs can pressure farmers if premiums do not cover the cost of compliance.
• Sustainability programs are strongest when they connect farm economics, yield stability, water management, shade, soil health, and buyer commitments.
• Climate risk is a market risk because it can reduce availability, raise prices, and shift sourcing away from vulnerable origins.
Table 11. Sustainability and Supply Risk Diagnostic
| Risk Area | Core Signal | Why it matters |
|---|---|---|
| Smallholder dependence | 80% of output | Adaptation finance matters |
| Farming households | Up to 25M | Livelihood and supply stability |
| Extra hot days | 57 days/year in top five producers | Climate stress benchmark |
| Brazil heat exposure | 70 extra hot days | Risk in largest origin |
| Ethiopia heat exposure | 34 extra hot days | Specialty origin risk |
| Traceability | Rising buyer requirements | Compliance and market access |
Sustainability readout
Sustainability in coffee is not only branding. It is a supply-risk issue. Climate shifts, low farmer income, disease pressure, certification requirements, and traceability rules can all affect long-term coffee availability.
Coffee Market Challenges and Growth Risks
Market risks worth separating
The coffee market faces several risks at the same time. These risks should be separated by supply, demand, price, climate, channel, and compliance because each one requires a different response.
• Production concentration creates risk because Brazil and Viet Nam together account for nearly 50% of world coffee output.
• Price volatility creates risk because commodity prices and retail coffee prices can move faster than household budgets.
• Climate volatility creates risk because extra hot days, drought, frost, and rainfall shifts can affect yield and quality.
• Smallholder economics create risk because 80% of output comes from smallholders who may lack capital for adaptation.
• Consumer affordability creates risk when prices rise, as shown by Brazilian survey data on reduced intake.
• Channel risk matters because cafés depend on foot traffic, consumer confidence, and discretionary spending.
• Alternative beverages create competition for younger consumers and convenience occasions.
• Certification and traceability costs can create barriers for smaller producers and exporters.
• Packaging, energy, labor, and shipping costs can compress margins for roasters and retailers.
• Long-term supply risk can support premium prices but also create demand destruction if consumers trade down.
Table 12. Coffee Market Risk Diagnostic
| Risk Area | Core Metric | Likely Owner |
|---|---|---|
| Crop risk | Yield and weather indicators | Producers and traders |
| Price risk | Arabica, Robusta, retail price indices | Roasters and retailers |
| Demand risk | Consumption frequency and price sensitivity | Brands and cafés |
| Channel risk | Café traffic and retail sales | Operators and distributors |
| Compliance risk | Traceability and certification | Exporters and retailers |
| Competitive risk | Alternative beverages and RTD formats | Coffee brands |
Risk interpretation
Coffee market risks are connected. Climate pressure can reduce supply, lower supply can increase prices, higher prices can pressure consumers, and affordability pressure can shift demand between cafés, retail coffee, instant coffee, and private label.
Coffee Market Diagnostic Framework
A coffee market review becomes useful when each number answers a business question. The framework below keeps the article from becoming a statistics dump by tying every benchmark to production, consumption, trade, format, channel, price, or sustainability analysis.
Table 13. Diagnostic Framework
| Problem Area | Core signals | Benchmark type |
|---|---|---|
| Market scale | Market value, CAGR, retail sales | Global and regional market data |
| Production | Crop volume, yield, top origins | FAOSTAT and USDA data |
| Consumption | Cups, frequency, per-capita demand | Consumer and association data |
| Trade | Exports, imports, origin flow | ICO and trade data |
| Format mix | Arabica, Robusta, instant, RTD | Product-format data |
| Channel mix | Retail, café, online, foodservice | Channel sales data |
| Price risk | Commodity and retail prices | Price-index data |
| Sustainability | Certification, climate, traceability | ESG and supply-risk data |
90-Day Coffee Market Benchmark Plan
Coffee market teams can use a 90-day benchmark plan to convert raw data into strategy. The first month should build the baseline, the second month should compare opportunities and risks, and the third month should turn insights into sourcing, product, pricing, and channel decisions.
Table 14. 90-Day Coffee Market Benchmark Plan
| Timing | What to Do | Output |
|---|---|---|
| Days 1-30 | Build baseline for size, production, consumption, trade, format, and region | Market-size map |
| Days 31-60 | Compare producers, consumers, price pressure, and channel growth | Opportunity scorecard |
| Days 61-90 | Review specialty, RTD, sustainability, and climate-risk signals | Growth/resilience plan |
Metrics Coffee Market Leaders Should Track
Coffee leaders should not track only global market size. They need a scorecard that reflects supply, demand, channel behavior, consumer price sensitivity, and climate risk. The following metrics form the practical dashboard for a coffee market review.
Table 15. Coffee Market Metrics Scorecard
| Metric | Why it matters |
|---|---|
| Global coffee market value | Market scale |
| CAGR | Growth speed |
| World production | Supply base |
| Brazil production | Largest-origin risk |
| Viet Nam production | Robusta supply strength |
| Global consumption | Demand base |
| Coffee exports | Trade flow |
| Coffee imports | Roasting and demand hubs |
| ICO composite price | Commodity cost pressure |
| Retail coffee price | Consumer affordability |
| Specialty coffee share | Premiumization |
| RTD coffee growth | Convenience demand |
| Café traffic | Out-of-home strength |
| Sustainability certification | Compliance and trust |
| Climate risk | Long-term supply pressure |
Coffee Market Statistics FAQ
Common questions
How large is the global coffee market?
The global coffee market was estimated at USD 249.34 billion in 2025 and is projected to reach USD 380.28 billion by 2033. Another worldwide revenue forecast places coffee revenue at USD 107.91 billion in 2026, which shows how market estimates vary depending on whether the source measures total market value, retail revenue, or narrower packaged coffee categories.
Which country produces the most coffee?
Brazil is the largest coffee producer in the tracked 2023 production data. It produced 3,405,267 tone of green coffee, equal to 30.78% of world production and about 56.75 million 60-kg bags. That scale makes Brazil the most important origin to watch for crop risk, supply availability, and price movement.
Which country is the second-largest coffee producer?
Viet Nam is the second-largest coffee producer in the tracked 2023 data. It produced 1,956,782 tone, equal to 17.69% of world production and about 32.61 million 60-kg bags. Viet Nam is especially important for Robusta, instant coffee, and value-oriented coffee blends.
What is the difference between Arabica and Robusta coffee?
Arabica is generally associated with premium, specialty, and single-origin positioning, while Robusta is important for instant coffee, espresso blends, and value formats. The difference matters because roasters, retailers, and cafés use Arabica and Robusta differently depending on taste profile, cost, caffeine, crema, and target price point.
Why is specialty coffee growing?
Specialty coffee is growing because consumers increasingly value origin, roast quality, brewing method, café experience, sustainability, and flavor variety. In the United States, 45% of adults had specialty coffee in the past day in 2024, while traditional coffee stood at 44%, and specialty coffee past-day consumption was up 80% from 2011 to 2024.
How important is coffee trade?
Coffee trade is central to the market because production and consumption are geographically separated. Producing countries such as Brazil, Viet Nam, Colombia, Uganda, Ethiopia, Honduras, India, and Indonesia export large volumes, while import and roasting hubs capture value through processing, packaging, branding, and distribution.
How do coffee prices affect the market?
Coffee prices affect every layer of the value chain. The ICO composite price averaged 297.05 US cents/lb in August 2025, and U.S. retail coffee prices reached USD 8.87/lb in August 2025. Rising prices can pressure roaster margins, café menus, household budgets, and consumer demand.
Which regions matter most in coffee production?
The Americas and Asia-Pacific matter most in production volume. The Americas produced about 5.53 million tracked tone in 2023, while Asia-Pacific produced about 3.42 million tracked tone. Africa produced about 1.25 million tracked tone but remains especially important for origin diversity and specialty coffee.
What metrics matter most for coffee market analysis?
The most important metrics are market value, CAGR, world production, top producer-country output, consumption frequency, exports, imports, Arabica and Robusta price indicators, specialty coffee share, retail price pressure, channel sales, sustainability certification, and climate risk indicators.
Final Takeaway
Coffee market statistics point to one conclusion: coffee is both a daily consumer ritual and a globally traded agricultural commodity. Its performance depends on origin-country production, mature and emerging-market consumption, product-format shifts, café and retail channels, price pressure, and climate resilience.
For readers, the practical lesson is simple: a coffee statistic is strongest when it is tied to a market decision. Production data explains supply exposure, consumption data explains demand depth, channel data explains where revenue is captured, and sustainability data explains whether future growth can remain resilient.
The strongest supply signal is concentration. Brazil and Viet Nam together account for nearly 50% of world coffee production, and Brazil alone produced 3,405,267 tone in 2023. That creates efficiency, but it also creates exposure. Weather, disease, labor pressure, or policy changes in key origins can affect availability and pricing around the world. Smaller origins such as Ethiopia, Kenya, Costa Rica, Guatemala, and Tanzania may not always lead by volume, but they matter because they support flavor differentiation, specialty storytelling, and premium positioning.
The strongest demand signal is habit. Coffee remains deeply embedded in daily routines, especially in mature markets where 67% of U.S. adults had coffee in the past day in 2024 and 75% had it in the past week. Yet the value opportunity increasingly comes from specialty coffee, premium beans, RTD coffee, cold brew, capsules, café beverages, and convenience formats. That means brands should not only ask how many people drink coffee; they should ask what kind of coffee they drink, where they buy it, how much they pay, and which occasions they are trying to satisfy.
The strongest risk signal is resilience. Price pressure, extra hot days, smallholder economics, traceability requirements, certification costs, and retail inflation all influence the future of the coffee market. The winners will be the companies that understand supply risk before it reaches the shelf, use format innovation to protect value, and maintain consumer trust even when prices are volatile. The strongest coffee strategy is not simply to sell more cups. It is to understand where demand is growing, which formats carry premium value, which countries control supply, how prices affect consumers, and which sustainability risks could reshape long-term availability.