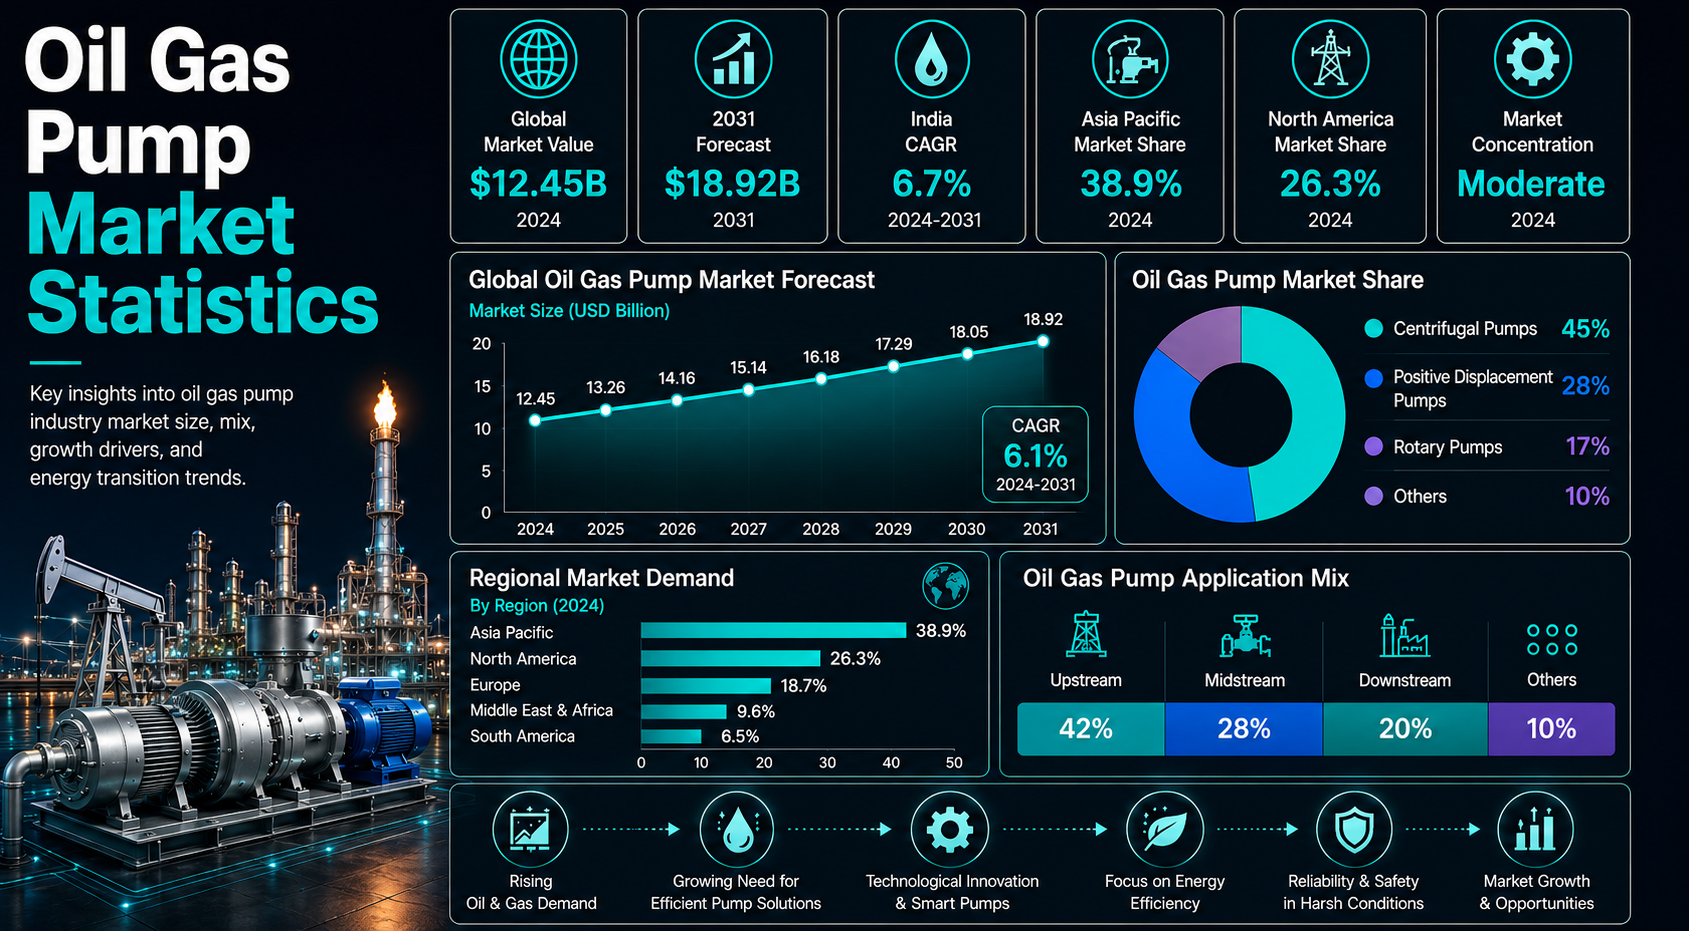
Oil and gas pumps are one of the quiet infrastructure layers behind production, pipeline movement, refining, LNG processing, petrochemicals, and storage. They move crude, condensate, water, chemicals, fuels, slurries, utilities, and cryogenic liquids through systems where uptime, safety, pressure control, and fluid integrity matter every hour. Because of that, the pump market does not behave like a simple equipment category. It follows drilling activity, midstream buildout, refinery utilization, LNG investment, offshore project timing, installed-base age, maintenance cycles, and efficiency upgrades at the same time.
The strongest statistics show why the market deserves a dedicated scorecard. Fortune Business Insights places the global oil and gas pump market at USD 9.22 billion in 2025, USD 9.59 billion in 2026, and USD 13.32 billion by 2034. MarketsandMarkets provides a second market anchor, estimating USD 8.7 billion in 2023 and USD 10.9 billion by 2028. Regional data also shows why the market is uneven: Middle East and Africa leads the 2025 share, North America remains important for shale, pipelines, LNG, and refining, while Asia-Pacific is driven by downstream and petrochemical demand.
Each section is organized for scanning. A short explanation introduces the issue, benchmark statistics show the market signal, and compact tables or readout boxes explain what the numbers mean for pump suppliers, EPCs, operators, distributors, and service teams.
Executive Oil Gas Pump Benchmarks
These are the statistics that frame the article. They show the scale of the pump market, the difference between new project demand and replacement demand, and the role of regional investment, pump type, and application mix.
The numbers that define the pump market
- Fortune Business Insights estimates the global oil and gas pump market at USD 9.22 billion in 2025.
- The same forecast places the 2026 market at USD 9.59 billion, creating a clear near-term base for market sizing.
- The long-range market forecast reaches USD 13.32 billion by 2034, with a 4.2% CAGR across 2026-2034.
- MarketsandMarkets estimates the market at USD 8.7 billion in 2023 and USD 10.9 billion by 2028, equal to roughly 4.7% CAGR.
- Middle East and Africa holds 37.54% of 2025 market share, making it the largest regional demand base in the dataset.
- North America reaches USD 1.83 billion in 2025 and USD 1.90 billion in 2026, supported by shale, refining, pipelines, LNG, and aftermarket demand.
- Asia-Pacific accounts for 19.05% of 2025 share and remains important for refining, petrochemical, LNG, and domestic production projects.
- Europe accounts for 16.46% of 2025 share, with demand tied to offshore maintenance, mature refineries, gas infrastructure, and efficiency retrofits.
- Latin America accounts for 7.06% of 2025 share, but project opportunity is stronger in Brazil, Guyana, Argentina, Suriname, and Mexico.
- The midstream application segment is listed at 37.82% share in 2026, showing the importance of pipelines, terminals, boosting, transfer, and storage.
- The United States oil and gas pump market is estimated at USD 1.45 billion in 2026 and forecast at USD 1.81 billion by 2032.
- China reaches USD 0.84 billion in 2026, making it one of the largest country-level pump markets in the Asia-Pacific section.
- India reaches USD 0.19 billion in 2026, reflecting refining, downstream, gas, and infrastructure-led pump demand.
- Refining throughput is listed at 83.8 million barrels per day in the driver dataset, supporting process, transfer, cooling, and utility pump demand.
- Oil supply is listed at 106.4 million barrels per day in the driver dataset, supporting upstream, midstream, storage, and processing pump requirements.
|
Editorial readout Oil and gas pump statistics point to a market shaped by both new infrastructure and installed-base reliability. Growth does not come only from drilling activity. It also comes from refinery upgrades, pipeline boosting, LNG systems, offshore projects, corrosion replacement, spare parts, seals, retrofits, and energy-efficiency improvements. A useful pump-market analysis separates pump type, application, region, operating environment, and project cycle before drawing conclusions about future demand. |
Why Oil and Gas Pumps Carry Market Weight
Pump demand signals worth separating
Pump demand rises when operators build new assets, maintain old systems, and improve reliability across harsh fluid-handling environments. The market therefore reacts to upstream production, midstream transport, refining throughput, LNG growth, offshore activity, petrochemical expansion, and aftermarket maintenance. It is also sensitive to failures because a pump problem can reduce throughput, create safety risk, delay maintenance plans, or force an unscheduled shutdown.
- Production pumps support crude, condensate, produced water, and chemical movement in the field.
- Water-injection pumps help maintain reservoir pressure and support recovery plans in mature fields.
- Chemical-injection and metering pumps support corrosion control, flow assurance, and production chemistry.
- Pipeline booster pumps keep crude, refined products, and liquids moving through midstream networks.
- Refinery circulation and transfer pumps protect throughput during crude processing and product handling.
- Petrochemical pumps support feedstock movement, process circulation, cooling, and utility systems.
- Cryogenic pumps follow LNG liquefaction, regasification, storage, and low-temperature handling needs.
- Offshore assets require pumps built for compact spaces, vibration, harsh service, and limited maintenance access.
- Aftermarket demand includes seals, bearings, spares, refurbishment, retrofits, and service contracts.
- Efficiency upgrades can shift demand toward VFDs, optimized hydraulics, and better motor systems.
| Pump area | What it supports | Market meaning |
|---|---|---|
| Upstream production | Crude, water, chemicals, injection | Supports field output |
| Midstream pipelines | Boosting, transfer, storage | Keeps hydrocarbons moving |
| Downstream refining | Cooling, circulation, transfer | Protects throughput |
| LNG and gas | Cryogenic liquids, condensate, utilities | Supports gas infrastructure |
| Offshore assets | Utilities, injection, drainage | Enables harsh-service operation |
| Aftermarket | Spares, seals, repairs, retrofits | Protects uptime |
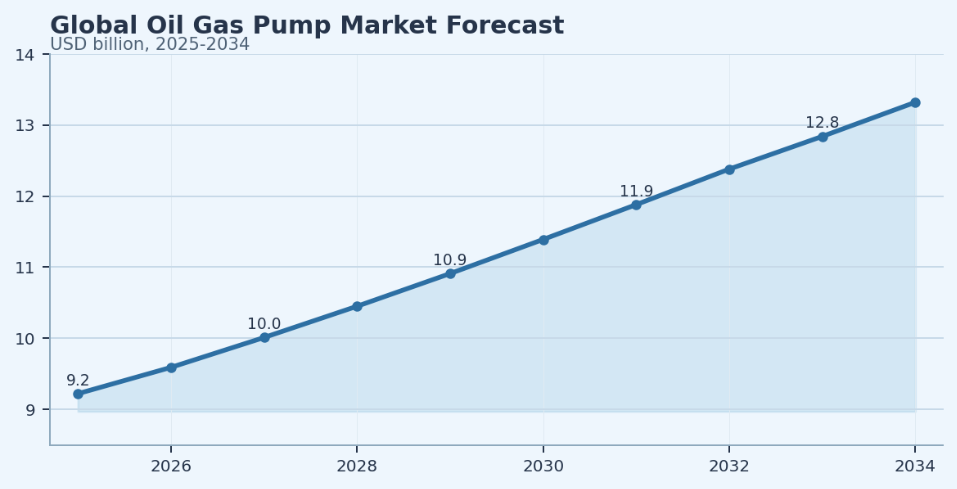
Figure 1. Oil and gas pump demand should be reviewed through project activity, installed-base maintenance, fluid-handling needs, and reliability risk rather than one blended equipment number.
Global Oil Gas Pump Market Size and Growth Outlook
Market-size and forecast benchmarks
Market size is the first anchor for the pump industry, but it should not be read as one simple equipment number. Pump revenue can increase because of more units, stricter specifications, higher material costs, more service content, or greater demand for engineered systems.
- The global market is estimated at USD 9.22 billion in 2025 and USD 9.59 billion in 2026.
- The 2034 forecast reaches USD 13.32 billion, creating a long-term growth path for the category.
- The 2026-2034 CAGR is 4.2% in the Fortune Business Insights forecast.
- The MarketsandMarkets forecast starts at USD 8.7 billion in 2023 and reaches USD 10.9 billion by 2028.
- The 2023-2028 CAGR from MarketsandMarkets is 4.7%, slightly above the longer-range Fortune trajectory.
- Middle East and Africa leads regional share at 37.54% in 2025, indicating a large project and national-oil-company demand base.
- North America reaches USD 1.83 billion in 2025, helped by shale basins, LNG export projects, refineries, pipelines, and installed-base replacement.
- Midstream demand remains important because pipelines, terminals, storage, and booster stations require large volumes of transfer and booster pumps.
- LNG and offshore projects support specialty and high-specification pump demand, especially where cryogenic, corrosion, or reliability requirements are strict.
- Downstream activity remains a stabilizer because refineries and petrochemical plants require continuous process, cooling, transfer, and maintenance pumping.
|
Market-scale interpretation Higher pump-market value does not always mean higher unit shipments. Growth can reflect replacement demand, refinery maintenance, pipeline integrity, LNG systems, corrosion, specification complexity, energy-efficient motors, digital monitoring, and higher material costs. The better analysis compares pump demand with capex cycles, project sanctions, refinery throughput, pipeline additions, and installed-base. |
Pump Type Statistics
Centrifugal, positive displacement, and specialty pump benchmarks
Pump type is where the market becomes operational. Oil and gas operators do not buy pumps as one generic product. They select equipment by fluid, pressure, flow rate, viscosity, temperature, corrosion risk, solids content, safety classification, and maintenance access. That is why the same market includes broad centrifugal transfer pumps, precision positive displacement pumps, high-pressure injection pumps, artificial-lift systems, and cryogenic LNG pumps.
- Centrifugal pumps remain the workhorse category because oil and gas facilities need high-volume transfer, circulation, boosting, and utility service.
- Positive displacement pumps serve high-pressure, viscous, metering, dosing, and injection duties where controlled flow matters more than large volume.
- Reciprocating pumps are important in pressure service, including injection applications and systems that require high discharge pressure.
- Rotary pumps support lubrication, fuel handling, heavy liquids, and steady flow in selected process environments.
- Electric submersible pumps and other artificial-lift systems support production from wells where natural pressure is insufficient.
- Cryogenic pumps are linked closely to LNG liquefaction, regasification, storage, and low-temperature handling.
- Metering and chemical-injection pumps support corrosion control, hydrate management, scale inhibition, and production chemistry.
- Multistage pumps are used when operators need higher pressure while maintaining steady flow across process or transfer systems.
- API-compliant pumps are important in refineries, petrochemical plants, and other critical services where reliability specifications are strict.
- Specialty pump demand often rises when projects involve sour service, offshore platforms, high temperature, abrasive fluids, or cryogenic liquids.
| Pump type | Common use | Why demand matters |
|---|---|---|
| Centrifugal | Transfer, circulation, boosting | High-volume workhorse |
| Positive displacement | Viscous and high-pressure fluids | Supports precise flow |
| Reciprocating | Injection and pressure service | Critical for pressure systems |
| Rotary | Fuels, lubrication, viscous transfer | Useful for steady flow |
| ESP/submersible | Artificial lift and production | Supports field recovery |
|
Pump-type readout Pump type matters because demand follows the job the pump performs. Centrifugal pumps dominate broad transfer and circulation needs, while positive displacement pumps serve high-pressure, metering, and viscous-fluid applications. Cryogenic pumps follow LNG growth, ESPs follow artificial-lift needs, and specialty pumps follow harsh-service projects where failure risk is costly. |
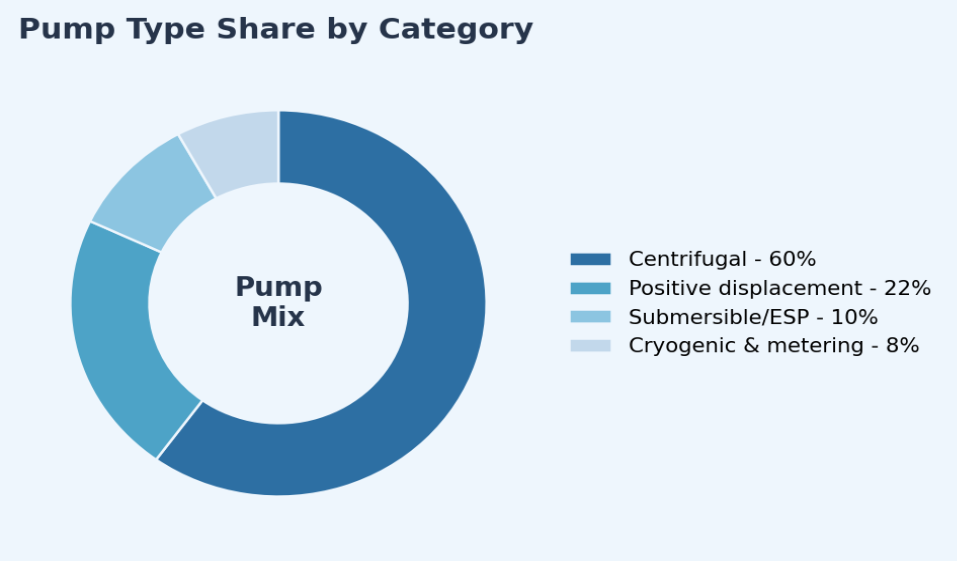
Figure 2. Pump-type demand should be reviewed by pressure, flow rate, fluid composition, and service environment rather than market share alone.
Application-Level Pump Demand
Where pump demand appears across the oil and gas value chain
Application-level analysis keeps the market practical. A pump sold into a refinery has different demand drivers from an artificial-lift pump, pipeline booster, LNG cryogenic pump, or offshore utility pump. The strongest view separates new project demand from replacement demand and harsh-service demand from standard transfer applications.
- Upstream applications use pumps for crude transfer, water injection, chemical injection, artificial lift, produced water handling, and field utilities.
- Water handling remains a major driver because mature fields often require injection, separation, produced-water transfer, and treatment support.
- Midstream applications use pumps in pipelines, storage terminals, tank farms, loading systems, booster stations, and product-transfer networks.
- Downstream refineries use pumps for crude units, process circulation, cooling water, product transfer, fuel movement, and maintenance turnarounds.
- Petrochemical plants use pumps across feedstock handling, process loops, utilities, cooling, specialty chemicals, and product movement.
- LNG applications create demand for cryogenic pumps, utilities, condensate handling, loading systems, and regasification support.
- Offshore production relies on compact, high-reliability systems because access, weight, safety, and downtime constraints are more severe.
- Aftermarket applications include seal changes, bearing replacement, refurbishments, monitoring upgrades, and emergency repairs.
| Application | Pump demand driver | Strategic implication |
|---|---|---|
| Upstream | Production, injection, lift | Tied to field activity |
| Midstream | Pipelines, terminals, storage | Tied to infrastructure buildout |
| Downstream | Refining, cooling, transfer | Tied to throughput and upgrades |
| LNG | Cryogenic handling and utilities | Tied to gas trade |
| Offshore | Harsh-environment systems | Tied to long-cycle projects |
| Aftermarket | Spares, seals, repairs | Tied to reliability |
|
Application readout Application is often more useful than total market value. Refinery pumps follow turnaround cycles and throughput reliability. Pipeline pumps follow route additions, terminal upgrades, and storage use. LNG pumps follow liquefaction and regasification projects. Offshore pumps follow project sanctions and platform maintenance, while aftermarket demand follows the installed base. |
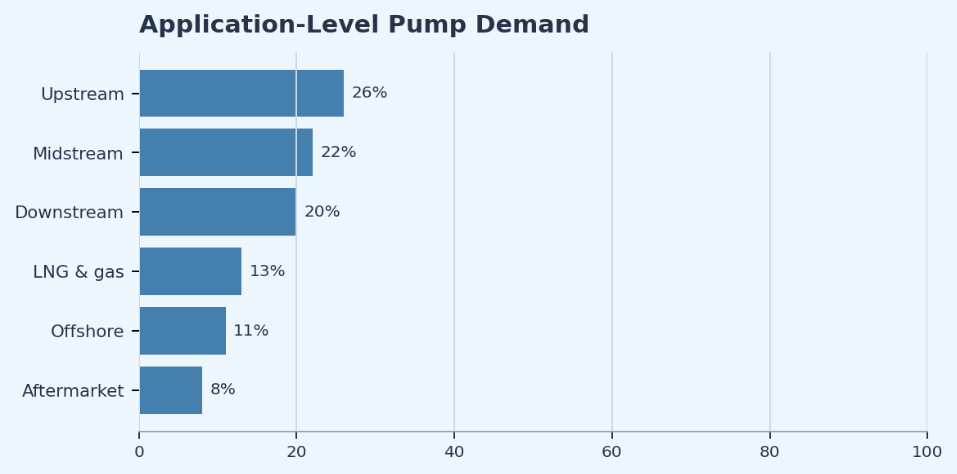
Figure 3. Application-level pump demand changes by project cycle, maintenance cycle, and service severity across upstream, midstream, downstream, LNG, offshore, and aftermarket use.
Regional Oil Gas Pump Intelligence
Regional pump demand does not move evenly. It follows where oil and gas infrastructure is being built, maintained, expanded, or upgraded. The same global market can include fast-growing LNG programs in Qatar, refinery expansion in India, shale and pipeline maintenance in North America, pre-salt offshore systems in Brazil, mature offshore replacement in Europe, and national oil company projects across the Middle East and Africa.
Middle East and Africa
- Middle East and Africa holds the largest 2025 regional share at 37.54% in the Fortune-based split.
- Saudi Arabia, UAE, Qatar, Kuwait, Oman, and Iraq support demand through upstream capacity, refining, gas, and petrochemical projects.
- NOC-led spending can create multi-year pump demand because national producers often invest through long-cycle field, refinery, and gas infrastructure plans.
- Qatar’s LNG expansion supports cryogenic, utility, condensate, and gas-infrastructure pump requirements.
- Africa adds project-linked demand through Nigeria, Angola, Algeria, Egypt, and Mozambique, especially in offshore, gas, and LNG-related assets.
North America
- North America reaches USD 1.83 billion in 2025 and USD 1.90 billion in 2026 in the dataset.
- The United States combines shale, refining, pipelines, LNG exports, petrochemicals, and Gulf of Mexico offshore demand.
- Canada adds oil sands, gas processing, midstream infrastructure, refining, and LNG Canada-linked opportunities.
- Mexico adds refinery modernization, upstream recovery efforts, pipelines, and industrial fuel demand.
- Aftermarket demand is strong because the region has a large installed base of refineries, terminals, pump stations, and production assets.
Asia-Pacific
- Asia-Pacific accounts for 19.05% of 2025 market share in the regional split.
- China reaches USD 0.84 billion in 2026 and remains a major pump market because of refining, petrochemicals, domestic production, and gas infrastructure.
- India reaches USD 0.19 billion in 2026 and is linked to refining expansion, downstream demand, terminals, and gas infrastructure.
- Australia supports LNG and gas-related pump demand, while Southeast Asian markets add smaller upstream, LNG, refining, and terminal opportunities.
- Japan and South Korea are less upstream-heavy but remain connected to LNG import, storage, regasification, and downstream systems.
Europe
- Europe accounts for 16.46% of 2025 market share in the dataset.
- Norway remains a key offshore market where pumps are tied to platforms, subsea-linked systems, brownfield work, and asset integrity.
- The UK North Sea adds maintenance and replacement demand even as the basin matures.
- European refineries support process pumps, energy-efficiency upgrades, seals, spare parts, and maintenance programs.
- Gas security and storage projects can create additional demand for transfer, utility, and midstream pump systems.
Latin America
- Latin America accounts for 7.06% of 2025 market share, but several countries have project-linked upside.
- Brazil’s pre-salt and FPSO activity support offshore, utility, injection, and harsh-service pumps.
- Guyana is a fast-growing offshore oil province, creating demand tied to FPSOs and production support systems.
- Argentina’s Vaca Muerta supports shale, gathering, transfer, and midstream-related pump demand.
- Suriname, Trinidad and Tobago, Colombia, and Mexico add smaller but important offshore, gas, refining, and infrastructure opportunities.
| Region | Pump demand theme | Main countries | Strategic implication |
|---|---|---|---|
| Middle East & Africa | Upstream, refining, LNG | Saudi Arabia, UAE, Qatar, Nigeria | Largest demand base |
| North America | Shale, pipelines, LNG | U.S., Canada, Mexico | Strong aftermarket |
| Asia-Pacific | Refining, petrochemicals, LNG | China, India, Australia | Demand-led growth |
| Europe | Offshore, retrofits | Norway, UK, Germany | Maintenance-heavy |
| Latin America | Offshore and shale | Brazil, Guyana, Argentina | Project-linked upside |
|
Regional readout Middle East and Africa is project-heavy and NOC-led. North America combines shale, LNG, midstream, refining, and aftermarket demand. Asia-Pacific is driven by refining, petrochemicals, and gas infrastructure. Latin America is increasingly offshore-linked, while Europe is more mature and retrofit-heavy. A single global pump number hides these very different demand stories. |
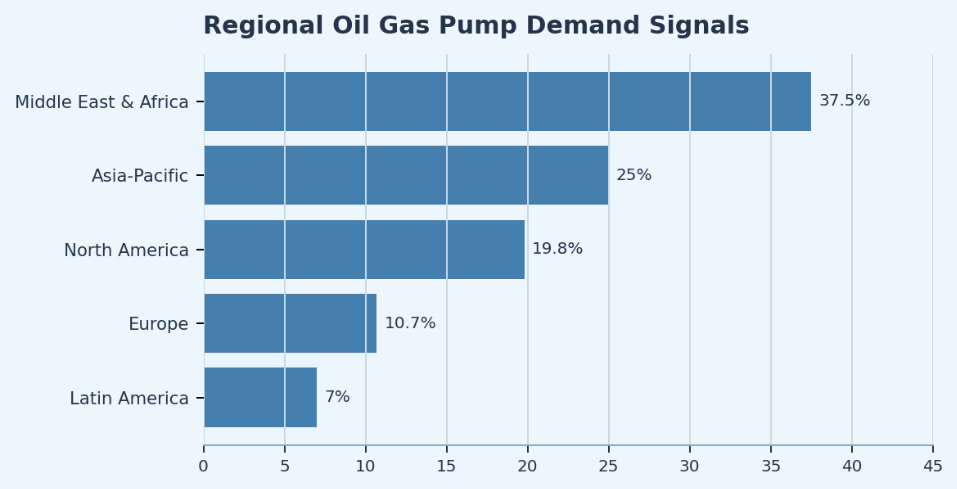
Figure 4. Regional oil and gas pump demand should be reviewed by infrastructure type because project-heavy, mature, and aftermarket-heavy regions follow different buying cycles.
Country-Level Pump Market Hotspots
Country-level analysis is important because pump demand follows physical infrastructure. Qatar is LNG-linked, Brazil and Guyana are offshore-linked, Saudi Arabia and the UAE are NOC-project-linked, the United States is shale, pipeline, refining, and LNG-linked, while Europe is more replacement and retrofit-linked.
| Country | Main pump-market angle | Why it matters |
|---|---|---|
| United States | Shale, pipelines, LNG, refining | Largest North America base |
| Canada | Oil sands, gas, midstream | Harsh service and replacement |
| Mexico | Refining, upstream, pipelines | Modernization demand |
| Saudi Arabia | Aramco, injection, refining | Large NOC project cycle |
| UAE | ADNOC, gas, petrochemicals | Expansion and efficiency |
| Qatar | LNG megaprojects | Cryogenic pump demand |
| China | Refining, petrochemicals | Large Asia-Pacific base |
| India | Refining and downstream | Capacity expansion |
| Brazil | Pre-salt and FPSOs | Offshore pump demand |
| Guyana | Offshore production growth | Fast project expansion |
| Norway | Offshore maintenance | Mature high-spec market |
| Nigeria | Deepwater, gas, refining | Recovery opportunity |
| Australia | LNG and gas | Gas infrastructure demand |
|
Country readout The strongest country-level view links pump demand to infrastructure type. Markets with LNG megaprojects need cryogenic and utility pumps. Offshore provinces need compact, high-reliability systems. Refining-heavy markets need process and turnaround pumps. Mature countries often create steady aftermarket demand, while fast-growing production provinces create project-led opportunity. |
End-User and Project Demand
Who buys oil and gas pumps
Pump sales depend heavily on buyer type. National oil companies, international oil companies, independents, EPC contractors, refineries, pipeline operators, LNG developers, and after market service providers all buy pumps for different reasons. That matters because each group responds to price, budget, procurement rules, and project timing differently.
- National oil companies often create long-cycle demand through national production, refining, gas, and infrastructure plans.
- International oil companies tend to screen pump purchases through project economics, safety, reliability, emissions, and return discipline.
- Independent producers can create short-cycle pump demand when commodity prices support drilling, completions, and production optimization.
- EPC contractors influence equipment selection during new-build projects, terminal expansions, refinery upgrades, and LNG construction.
- Refineries create recurring pump demand through maintenance turnarounds, process reliability, spare parts, and efficiency upgrades.
- Pipeline operators create demand for booster, transfer, station, terminal, and storage pumps.
| Buyer type | Pump demand pattern | Market signal |
|---|---|---|
| NOCs | Large project and replacement programs | Long-cycle demand |
| IOCs | Selective project and maintenance demand | Return-focused spending |
| Independents | Price-sensitive field demand | Short-cycle demand |
| Refineries | Process and maintenance pumps | Throughput reliability |
| Pipeline operators | Transfer and booster pumps | Midstream expansion |
| LNG developers | Cryogenic and utility pumps | Gas infrastructure growth |
|
End-user readout NOCs may buy through long-cycle national plans, while independents respond faster to price cycles. Refineries and pipeline operators often create steady replacement and maintenance demand even when upstream drilling slows. For suppliers, buyer mix can be as important as regional market size. |
Technology, Efficiency, and Smart Pump Trends
Technology benchmarks
Technology is shifting the pump market from equipment replacement to reliability management. Operators are not only buying pumps; they are buying uptime, leak prevention, lower energy use, safer operation, and better asset visibility. This makes smart monitoring, variable frequency drives, advanced seals, and materials part of the market-growth story.
- Condition monitoring helps operators track vibration, temperature, pressure, flow, and abnormal behavior before failure occurs.
- Predictive maintenance tools can reduce unplanned downtime by converting pump data into maintenance signals.
- Variable frequency drives help match pump speed to process demand, which can reduce energy use in suitable applications.
- Advanced seals and seal-support systems help reduce leakage, safety risk, emissions exposure, and maintenance frequency.
- Remote monitoring is valuable for offshore, pipeline, and remote production assets where access is expensive or slow.
- Corrosion-resistant materials become more important in sour service, produced water, chemical injection, offshore, and abrasive-fluid applications.
- Digital twins and analytics can support failure prediction, equipment selection, spare-part planning, and operating optimization.
| Technology | What it improves | Why it matters |
|---|---|---|
| Condition monitoring | Vibration, temperature, pressure | Reduces downtime |
| VFDs | Speed and energy use | Improves efficiency |
| Advanced seals | Leakage and reliability | Reduces safety risk |
| Smart sensors | Remote visibility | Supports predictive maintenance |
| Corrosion-resistant materials | Harsh fluids | Extends asset life |
| Digital twins | Failure prediction | Improves planning |
|
Technology readout The technology story is practical rather than futuristic. Pumps are energy-consuming assets that can fail in costly ways. Smart sensors, better seals, VFDs, and improved materials become valuable when they reduce downtime, protect throughput, improve safety, or lower operating cost over the asset life. |
Maintenance, Replacement, and Aftermarket Pump Demand
Aftermarket benchmarks
Aftermarket demand can make the pump market more stable than new project demand alone. Even when new oil and gas capex slows, operators still need seals, bearings, spare parts, repairs, refurbishments, service contracts, and retrofits to protect throughput and safety. That is why pump suppliers often treat aftermarket as a separate strategic opportunity.
- Seal replacement is one of the most common recurring needs because leakage can create safety, reliability, and environmental risk.
- Bearing wear, vibration, cavitation, and misalignment can create maintenance demand before a full pump replacement is needed.
- Corrosion and erosion shorten pump life in produced water, sour service, sand-prone flows, and chemical-handling applications.
- Refinery turnarounds create scheduled windows for pump inspection, repair, rebuilds, and replacement.
- Offshore maintenance is costly because access limits and logistics raise the value of reliability and spare-part planning.
- Pipeline operators need pump-station reliability because failure can affect throughput, schedules, and product movement.
- Retrofit programs can add monitoring, VFDs, better seals, materials, and efficiency improvements to existing assets.
| Aftermarket driver | What happens | Market impact |
|---|---|---|
| Seal wear | Leakage and downtime risk | Drives parts demand |
| Corrosion | Reduced pump life | Supports material upgrades |
| Refinery turnarounds | Scheduled replacement | Creates periodic demand |
| Offshore access limits | Higher repair cost | Raises reliability value |
| Aging infrastructure | More failures | Supports retrofits |
|
Aftermarket readout Aftermarket is not a side note. It is the part of the market that links installed-base size to recurring revenue. In mature regions, aftermarket demand can be more dependable than new-project demand because production, refining, and pipeline assets must continue operating even when operators delay new capital projects. |
Cost Pressure, Supply Chain, and Materials
Cost and supply-chain benchmarks
Pump-market growth should be read carefully because higher revenue can reflect higher unit costs, not only higher unit shipments. Materials, specifications, offshore requirements, cryogenic service, and supply-chain constraints can lift market value even when project count grows more slowly. This distinction matters when analysts compare revenue forecasts with actual activity levels.
- Steel, alloys, castings, machining, and specialty materials can affect equipment cost and lead times.
- API specifications, offshore requirements, sour service, and cryogenic duty can increase complexity and price.
- Longer lead times can affect EPC schedules, refinery turnarounds, pipeline upgrades, and emergency spare-part planning.
- Local-content requirements can shift supplier selection, manufacturing location, and project procurement strategy.
- Energy-efficient motors, optimized hydraulics, VFDs, and controls can raise upfront cost while reducing operating cost.
- Supplier capacity can become important during LNG, offshore, petrochemical, or refining investment cycles.
- Spare-part availability affects reliability because a low-cost pump can become expensive if critical parts are unavailable during failure.
| Cost pressure | What it affects | Market implication |
|---|---|---|
| Materials | Steel, alloys, castings | Raises equipment cost |
| Specifications | API, offshore, cryogenic service | Increases complexity |
| Lead times | EPC schedules and spares | Delays projects |
| Local content | Manufacturing and sourcing | Changes supplier strategy |
| Efficiency upgrades | Motors, VFDs, controls | Higher upfront, lower operating cost |
|
Cost readout A higher market value can mean more pumps, but it can also mean more complex pumps. Analysts should separate demand created by project activity from revenue growth created by materials, specification, lead-time, or efficiency requirements. That distinction keeps market interpretation from overstating physical volume growth. |
Oil Gas Pump Market Risk and Opportunity Diagnostic
| Opportunity area | Core signals to measure | Why it matters |
|---|---|---|
| Upstream activity | Rig count, completions, field projects | Signals production pump demand |
| Midstream buildout | Pipelines, storage, terminals | Signals booster demand |
| Refining throughput | Utilization, upgrades, turnarounds | Signals process pump demand |
| LNG investment | Liquefaction, regasification, cryogenic systems | Signals specialty pump demand |
| Aftermarket | Installed base, failures, service contracts | Stabilizes revenue |
| Efficiency upgrades | VFDs, monitoring, energy use | Raises retrofit opportunity |
| Regional risk | Sanctions, fiscal terms, local content | Shapes supplier access |
|
Diagnostic readout This model keeps the article from becoming a stat dump. Each pump-market statistic should answer a business question: is demand coming from new production, pipeline expansion, LNG growth, refinery upgrades, aftermarket replacement, efficiency retrofits, or regional project risk? |
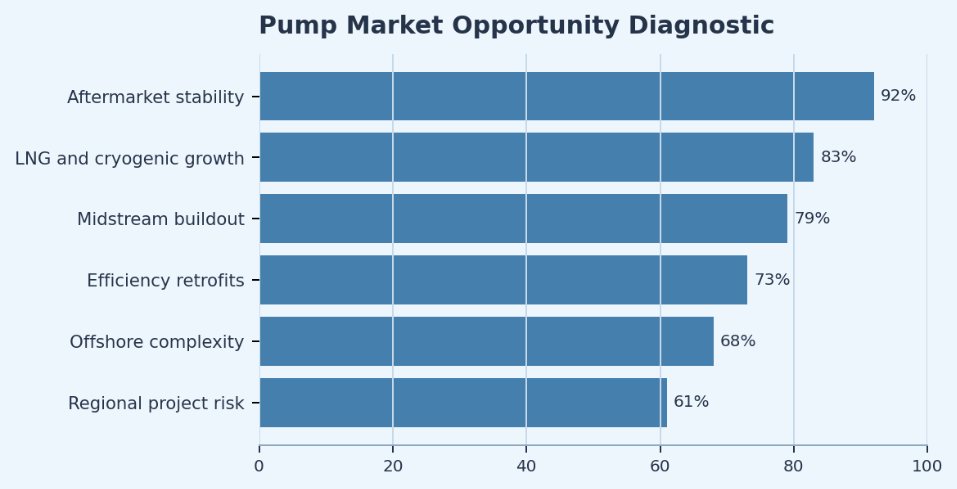
Figure 5. Pump-market opportunity should be mapped by activity signal, application, installed base, and regional risk rather than by revenue forecast alone.
90-Day Oil Gas Pump Market Benchmark Plan
Statistics become useful when they are translated into a review process. A practical pump-market benchmark can be organized into a 90-day cycle that separates new projects, recurring aftermarket, technology upgrades, and regional risk.
| Timing | What to do | Output |
|---|---|---|
| Days 1-30 | Build baseline by region, pump type, application, buyer, project stage | Clear opportunity map |
| Days 31-60 | Separate new-project demand from aftermarket, replacement, and retrofit demand | Better demand interpretation |
| Days 61-90 | Compare demand with capex, LNG projects, pipelines, refinery turnarounds, maintenance schedules | Repeatable market scorecard |
|
Planning principle The best pump-market review does not chase the largest market number. LNG cryogenic pumps, refinery transfer pumps, pipeline boosters, ESPs, and aftermarket seals all belong to the same market, but they follow different buying cycles and different purchasing logic. |
Metrics Industry Leaders Should Track
The final scorecard should be detailed enough to locate the opportunity without becoming a vanity dashboard. These metrics help suppliers, distributors, operators, and investors understand whether demand is project-led, replacement-led, regional, or technology-driven.
| Metric | Why it matters |
|---|---|
| Total pump market value | Overall demand direction |
| Pump type share | Separates centrifugal, PD, cryogenic, ESP demand |
| Regional market share | Where investment is concentrated |
| Application mix | Tracks upstream, midstream, downstream, LNG demand |
| Aftermarket revenue | Shows stability beyond new projects |
| Project backlog | Indicates future equipment demand |
| Pump lead times | Signals supply-chain pressure |
| Failure and maintenance rates | Drives replacement demand |
| Energy-efficiency upgrades | Shows retrofit opportunity |
| Installed base by region | Forecasts spares and services |
Country and Segment Signals That Shape Pump Demand
Country and segment signals help separate project-driven demand from recurring reliability demand. The most useful pump-market view does not treat every region or application as equal; it shows where spending is tied to new infrastructure, mature-asset maintenance, LNG, offshore operations, refining, or midstream reliability.
Country signals that affect pump demand
- United States demand is split across shale production, Gulf Coast refining, petrochemical capacity, pipeline systems, terminals, LNG exports, Gulf of Mexico offshore assets, and a large installed base of pumps that require recurring service.
- Permian Basin activity supports artificial lift, transfer, produced-water handling, chemical injection, and gathering-system demand, but public producers often keep capital discipline in mind when approving new equipment purchases.
- U.S. LNG export expansion supports cryogenic, condensate, utility, cooling, and loading-related pump systems, while terminals also need maintenance and spare-part coverage after startup.
- Canada’s oil sands create harsh-service pump requirements because bitumen, produced water, slurry-like fluids, steam-assisted operations, and corrosion risk can raise the value of material selection and reliability.
- Canada’s gas processing and LNG-linked activity adds demand for utility pumps, process pumps, compressor-station support systems, and terminal infrastructure.
- Mexico’s pump demand is tied to refinery modernization, fuels infrastructure, upstream recovery, pipeline reliability, industrial energy demand, and the need to improve asset uptime across older systems.
- Saudi Arabia remains important because large-scale production, water injection, refining, petrochemicals, gas development, and national project plans create long-cycle pump procurement opportunities.
- The UAE adds demand through ADNOC expansion, gas processing, refining, petrochemical integration, offshore assets, and efficiency upgrades across mature infrastructure.
- Qatar is one of the most important LNG-linked pump markets because North Field expansion creates demand for cryogenic liquid handling, utilities, condensate systems, loading facilities, and high-specification equipment.
- Iraq’s demand is more infrastructure-constrained, but field development, water handling, export systems, and processing projects can still create strong pump requirements when project execution improves.
- China is a large downstream and petrochemical pump market because refining capacity, chemical integration, domestic production, terminals, and gas infrastructure all require process and transfer systems.
- India’s demand is closely tied to refining expansion, fuel consumption, petrochemicals, terminal upgrades, gas infrastructure, and downstream modernization rather than only upstream drilling.
- Brazil is one of the clearest offshore-linked pump markets because pre-salt and FPSO activity require platform utilities, injection systems, seawater handling, produced-fluid systems, and high-reliability support equipment.
- Guyana’s fast offshore production growth creates project-linked demand, but procurement is concentrated around FPSOs, subsea-linked systems, and international operator project schedules.
- Norway and the UK show how mature markets can still support pump revenue through offshore maintenance, brownfield work, energy-efficiency upgrades, seals, spare parts, and asset-integrity programs.
- Nigeria, Angola, Algeria, Egypt, and Mozambique create a mix of deepwater, gas, LNG, refining, and replacement opportunities, but security, financing, fiscal terms, and execution risk can affect order timing.
Segment signals that keep the market practical
The most useful pump segmentation is not only technical. It should show the reader how demand behaves differently by project cycle. New projects create one-time equipment orders, while installed assets create recurring maintenance and service revenue. Specialty applications, such as LNG and offshore, can also lift market value because specifications are stricter and failure risk is higher.
- Centrifugal pumps are the broadest category because they are used in transfer, circulation, cooling, boosting, terminals, utilities, and refining systems.
- Positive displacement pumps become more important when pressure, viscosity, accuracy, dosing, or metering are more important than very high flow volume.
- Chemical injection and metering pumps protect production chemistry, pipeline integrity, corrosion control, scale inhibition, and flow assurance.
- Electric submersible and artificial-lift pumps are tied to field productivity, reservoir decline, and operators’ need to improve recovery from existing wells.
- Cryogenic pumps should be discussed separately because LNG growth creates a more specialized demand profile than conventional transfer applications.
- Refinery pumps can be a stable demand category because turnarounds, process reliability, cooling systems, and product transfer continue even when upstream investment slows.
- Pipeline and terminal pumps depend on midstream utilization, product movement, storage activity, export infrastructure, and booster-station reliability.
- Offshore pumps carry higher reliability value because access is difficult, downtime is expensive, and equipment must often fit compact, vibration-prone, harsh-service environments.
- Aftermarket demand is strongest where the installed base is large, older, harsh-service, or difficult to access, making seals, bearings, spares, and rebuilds recurring market drivers.
- Digital monitoring, VFDs, and advanced seals should be presented as reliability and operating-cost tools rather than generic technology trends.
|
Segment readout The pump market becomes clearer when segments are tied to operating behavior. Centrifugal pumps scale with high-volume transfer and process circulation, while positive displacement and metering pumps rise with pressure, viscosity, dosing, and accuracy requirements. LNG, offshore, and sour-service systems often carry higher value because equipment must meet tougher operating and safety requirements. |
Lifecycle Economics and Installed-Base Demand
Pump purchasing decisions rarely end at the initial equipment price. Operators also weigh energy use, expected downtime, spare-part availability, seal performance, maintenance access, and the cost of failure. That is why installed-base economics matter as much as new-project awards in this market.
Lifecycle signals worth separating
- Energy consumption can become a major operating-cost issue when pumps run continuously in refineries, terminals, pipeline stations, utilities, or production facilities.
- Seal performance matters because leakage can create safety risk, environmental exposure, product loss, and unplanned maintenance.
- Bearing condition, vibration, temperature, and pressure trends are early indicators of reliability risk in high-duty pump systems.
- Spare-part availability can be as important as pump selection because downtime costs rise when remote or offshore assets wait for components.
- Material selection matters in corrosive, sour, abrasive, high-temperature, or cryogenic service because failure risk is not evenly distributed across applications.
- Lifecycle cost is often lower when operators combine better pump sizing, VFDs, monitoring, maintenance planning, and properly specified seals.
| Lifecycle factor | What it affects | Market implication |
|---|---|---|
| Energy use | Power cost and efficiency | Supports VFDs and better sizing |
| Seal reliability | Leakage and safety risk | Supports premium sealing systems |
| Remote access | Repair time and service cost | Raises value of monitoring |
| Material fit | Corrosion, erosion, service life | Supports engineered pumps |
| Parts availability | Downtime and turnaround speed | Supports aftermarket networks |
|
Lifecycle readout The strongest lifecycle view separates pumps that are inexpensive to buy from pumps that are inexpensive to operate. A cheaper pump can be expensive if it consumes more power, fails during a refinery run, leaks in hazardous service, or requires long lead-time parts. This is why the market is shifting toward reliability, monitoring, materials, and services rather than equipment value alone. |
Buyer and Supplier Implications
Pump manufacturers, distributors, EPCs, operators, and service providers do not all benefit from the same demand pocket. Engineered-pump suppliers may gain from LNG, offshore, refining, sour-service, and high-pressure applications. Distributors may see steadier activity in replacement units, seals, spares, and fast-turnaround parts. Service providers may benefit from condition monitoring, rebuilds, vibration analysis, field service, and maintenance contracts.
Commercial signals by market participant
- Engineered-pump manufacturers should track LNG, offshore, petrochemical, refining, and high-pressure injection projects because specification complexity can support stronger order value.
- Aftermarket suppliers should track refinery turnarounds, pipeline maintenance, offshore maintenance windows, mature fields, and aging infrastructure because these create recurring parts and service demand.
- Digital-service providers should track remote assets, high-duty pumps, energy-intensive systems, and operators seeking predictive maintenance rather than only emergency repair.
- Regional distributors should track local-content rules, spare-part lead times, installed-base concentration, and customer response expectations because proximity can influence purchase decisions.
- Operators should compare purchase price with lifecycle cost because energy use, seal life, failure risk, and spare availability often decide the total cost of ownership.
- EPC contractors should monitor pump lead times, API specification requirements, materials availability, and vendor documentation because these can affect project schedules.
| Market participant | What to watch | Why it matters |
|---|---|---|
| OEMs | LNG, offshore, high-spec projects | Higher engineered value |
| Distributors | Installed base, spares, local demand | Faster replacement revenue |
| Service firms | Monitoring, rebuilds, turnarounds | Recurring maintenance demand |
| EPCs | Lead times and specifications | Project schedule control |
| Operators | Lifecycle cost and uptime | Lower failure risk |
|
Buyer readout Buyer behavior gives the statistics more meaning. A national oil company buying pumps for a long-cycle gas or refining program behaves differently from a shale operator replacing field equipment or a refinery planning a turnaround. The market outlook is stronger when buyer type, project stage, and operating environment are viewed together. |
Procurement and Specification Signals to Watch
Procurement data can explain why pump-market revenue moves differently from production or project counts. A market can grow because operators order more pumps, but it can also grow because specifications are tougher, materials are more expensive, or packaged service content is higher.
Specification signals that affect order value
- API-compliant pumps can carry higher value because documentation, testing, materials, and project quality requirements are more demanding.
- Offshore pumps can carry higher value because they must fit compact layouts, resist harsh conditions, and reduce the cost of unplanned access.
- Cryogenic pumps can carry higher value because LNG and low-temperature liquids require specialized design, materials, and operating controls.
- Sour-service and corrosive-fluid applications can lift material requirements, seal requirements, inspection standards, and supplier qualification needs.
- Energy-efficiency upgrades can raise upfront equipment value when operators add VFDs, premium motors, controls, and monitoring systems.
- Packaged systems can increase order size when pumps are sold with controls, skids, instrumentation, spare parts, commissioning, and service support.
| Specification signal | Value driver | Best market use |
|---|---|---|
| API compliance | Testing and documentation | Refining and process duty |
| Cryogenic service | Special design and materials | LNG and gas infrastructure |
| Offshore service | Reliability and compact design | FPSOs and platforms |
| Corrosive fluids | Alloys and seal upgrades | Sour and harsh service |
| Digital package | Sensors, controls, service | Predictive maintenance |
|
Specification readout Specification intensity is one reason market value can rise faster than simple pump counts. A standard transfer pump and a cryogenic LNG pump both belong to the broad equipment market, but they do not carry the same engineering, testing, material, or service profile. That distinction keeps the statistics commercially useful. |
Installed-Base Geography and Service Density
Installed-base geography is one of the most important signals in the oil and gas pump market because service demand follows where pumps are already operating. Mature producing basins, refineries, pipeline corridors, terminals, gas plants, LNG assets, and offshore hubs all create recurring demand after the original equipment sale. A region with slower new project growth can still be commercially attractive if it has a large installed base, high utilization, aging assets, or difficult operating conditions.
Service-density signals worth separating
- Large refinery clusters create recurring demand for process pumps, cooling-water pumps, product-transfer pumps, seal upgrades, rebuilds, and turnaround support.
- Pipeline corridors create demand for booster pumps, terminal pumps, spare units, vibration monitoring, and reliability services tied to throughput and storage activity.
- Offshore hubs create higher service value because access is difficult, maintenance windows are limited, and failure costs are higher than in many onshore applications.
- Mature oil fields create artificial-lift, water-handling, chemical-injection, and replacement opportunities even when new drilling slows.
- LNG terminals create specialized service needs because cryogenic systems, utilities, loading equipment, and safety systems must remain reliable across long operating cycles.
|
Installed-base readout The installed-base view keeps the market from being judged only by headline capex. A new project can create a large equipment order once, while a large installed base can create seals, bearings, rebuilds, upgrades, monitoring, and service demand for years. That is why supplier strategy should compare both new-build opportunity and service density. |
Pump Selection Factors That Shape Market Value
Pump selection is one of the reasons this market should not be treated as a simple volume category. Operators choose equipment based on flow rate, pressure, fluid properties, temperature, corrosion risk, safety requirements, standards, operating duty, maintenance access, and energy use. The more demanding the service, the more the market shifts toward engineered value rather than standard replacement cost.
Selection signals that affect demand quality
- Flow rate and pressure define whether operators need high-volume centrifugal systems, high-pressure positive displacement systems, multistage units, or specialized injection equipment.
- Fluid viscosity, solids content, gas entrainment, sour service, and corrosive chemistry can change material requirements, seal type, motor selection, and maintenance expectations.
- Temperature matters because cryogenic LNG duty, hot refinery service, and normal transfer duty require different materials, tolerances, and safety controls.
- Reliability requirements are higher when pump failure threatens refinery throughput, pipeline movement, offshore production, LNG loading, or safety-critical systems.
- Maintenance access changes value. A pump that is easy to reach in an onshore facility creates a different risk profile from a pump installed offshore or in remote gas infrastructure.
- Energy use matters when pumps run continuously, making VFDs, proper sizing, efficient motors, and monitoring important parts of lifecycle cost.
|
Selection readout The strongest pump-market analysis connects pump type to operating duty. A standard transfer pump and a high-pressure chemical-injection pump may appear in the same broad market, but the buying decision, price sensitivity, specification burden, and service model are different. This is why pump type, application, and fluid conditions should be reviewed together. |
What Suppliers Should Watch Over the Next Cycle
Suppliers should track the signals that usually appear before orders improve. Pump demand often follows final investment decisions, refinery turnaround calendars, pipeline expansions, LNG construction milestones, offshore project awards, and maintenance budgets. It can also follow less obvious signals such as rising failure rates, lead-time pressure, stricter emissions rules, or operators shifting from reactive repair to predictive maintenance.
Forward-looking demand signals
- Final investment decisions for LNG, offshore, refining, petrochemical, pipeline, and gas-processing projects can indicate future engineered pump demand.
- Turnaround schedules can indicate near-term demand for seals, bearings, rebuilds, inspection services, and replacement process pumps.
- Pipeline and terminal utilization can indicate booster, transfer, storage, and loading-system requirements.
- Offshore project awards can indicate future demand for topside utility pumps, seawater systems, produced-fluid systems, and compact high-reliability equipment.
- Maintenance backlog and aging infrastructure can indicate aftermarket demand even before operators commit to new production projects.
- Energy-efficiency programs can indicate demand for VFDs, improved sizing, premium motors, monitoring systems, and lifecycle-cost upgrades.
|
Selection readout The strongest pump-market analysis connects pump type to operating duty. A standard transfer pump and a high-pressure chemical-injection pump may appear in the same broad market, but the buying decision, price sensitivity, specification burden, and service model are different. This is why pump type, application, and fluid conditions should be reviewed together. |
Oil Gas Pump Market Statistics FAQ
Common questions
What is the oil and gas pump market?
It is the market for pumps used across oil and gas production, processing, transportation, refining, LNG, petrochemicals, storage, and aftermarket service. It includes centrifugal, positive displacement, cryogenic, submersible, metering, injection, and specialty pumps.
How large is the global oil and gas pump market?
Fortune Business Insights estimates the market at USD 9.22 billion in 2025 and USD 9.59 billion in 2026, with a forecast of USD 13.32 billion by 2034.
Which pump type leads the market?
Centrifugal pumps are generally the largest workhorse category because they serve high-volume transfer, circulation, boosting, and utility duties across upstream, midstream, and downstream assets.
Which region has the largest share?
Middle East and Africa leads the 2025 regional split in the dataset, supported by upstream projects, refining, petrochemicals, LNG, and national oil company investment programs.
Why are pumps important in upstream oil and gas?
Upstream operators use pumps for crude transfer, water injection, artificial lift, chemical injection, produced-water handling, and field utilities. These systems support output and recovery.
How are pumps used in midstream and pipelines?
Midstream operators use pumps to move crude, refined products, condensate, and liquids through pipelines, terminals, storage assets, booster stations, and loading systems.
How does LNG growth affect pump demand?
LNG projects create demand for cryogenic pumps, condensate systems, loading equipment, utilities, and other specialized low-temperature fluid-handling systems.
Why does aftermarket demand matter?
Aftermarket demand covers seals, bearings, spares, repairs, retrofits, monitoring upgrades, and service contracts. It can stay resilient even when new-project activity slows.
Which metrics matter most?
Key metrics include total market value, pump type share, regional share, application mix, aftermarket revenue, lead times, project backlog, installed base, and efficiency-upgrade activity.
Does higher pump-market value always mean more units?
Not always. Higher value can reflect higher material costs, stricter specifications, offshore or cryogenic complexity, digital monitoring, VFDs, or service packages rather than only unit growth.
Final Takeaway
Oil and gas pump market statistics point to one conclusion: pumps are a critical reliability layer inside the global oil and gas system. The market is growing because operators need to move, inject, circulate, cool, boost, meter, and process fluids across upstream, midstream, downstream, LNG, offshore, and petrochemical assets. That makes pump demand sensitive to both new capital projects and everyday asset integrity.
The most effective analysis distinguishes between demand generated by new projects and that driven by aftermarket requirements. A new LNG train, for example, may require cryogenic and utility pumps, while an aging refinery may generate demand for process pump rebuilds, seal replacements, and efficiency upgrades. Similarly, shale basins can create short-cycle demand for transfer and production equipment, whereas offshore FPSO projects typically require high-specification pump systems designed to meet demanding reliability standards. Although these segments fall within the same broader market, each has its own purchasing patterns and replacement cycles. Clear financial documentation, such as a printable invoice template, can also help suppliers and contractors manage project-related transactions across these different demand areas.
For suppliers and operators, the practical goal is to read pump demand through project timing, fluid type, operating environment, regional infrastructure, and installed-base condition. The strongest outlook connects the numbers to real use cases such as pipeline boosting, water injection, refining throughput, LNG handling, corrosion replacement, VFD upgrades, and predictive maintenance.


