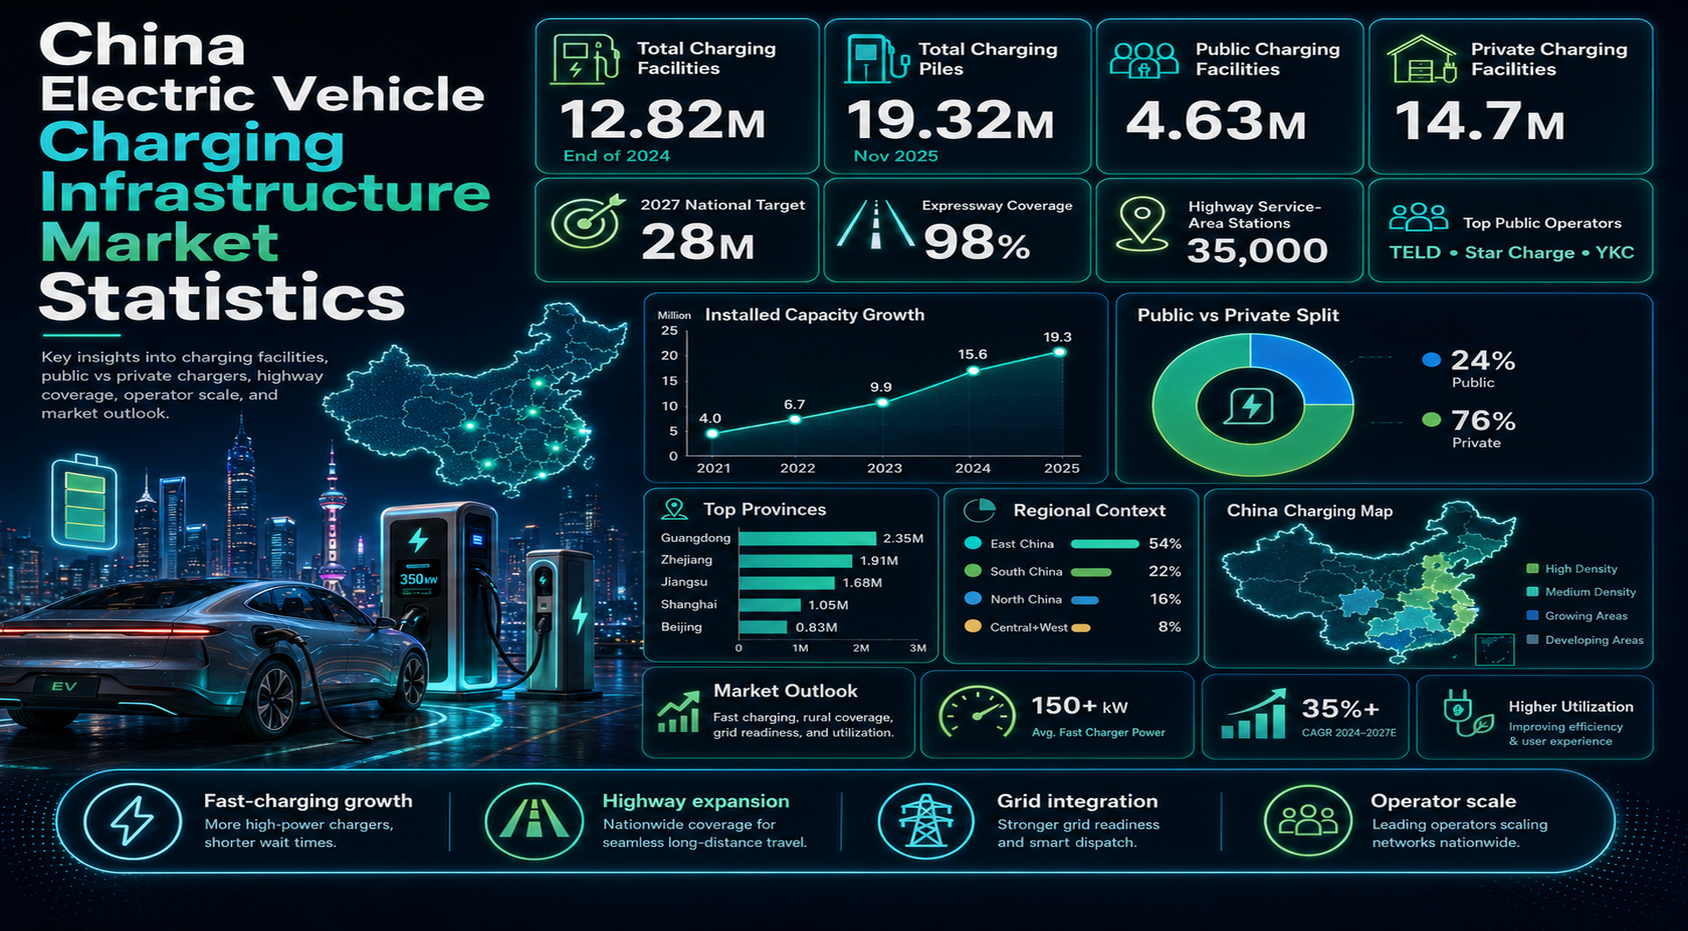
China’s electric vehicle charging network has moved beyond early support equipment. It is now a national transport-energy system connecting passenger cars, buses, taxis, logistics fleets, highway travel, residential parking, distribution grids, energy storage, and digital payment platforms.
The scale is already clear. China reached 12.82 million charging facilities by the end of 2024, up 49% year over year. By November 2025, the network had exceeded 19.32 million charging piles as public and private charging demand continued expanding alongside new-energy vehicle ownership.
The market question is now about quality as much as quantity. Charger access, fast-charging speed, highway coverage, rural reach, station uptime, operator utilization, and grid readiness will decide whether the network can support the next stage of EV adoption.
Executive Charging Infrastructure Benchmarks
These are the statistics that frame the article. They show the size of the network, the public-private split, the pace of deployment, the importance of highway coverage, and the difference between building chargers and building a dependable charging system.
The numbers that define China’s charging infrastructure market
• China reached 12.82 million EV charging facilities by the end of 2024, so charging is now operating as national infrastructure rather than a support feature for early EV buyers.
• More than 4.22 million facilities were added in 2024 alone, showing that deployment is still being built at a pace normally associated with major public-works programs.
• The 2024 network included about 3.58 million public piles and 9.24 million private piles, which means daily home and residential charging carried most of the installed base while public charging supported shared access.
• Charging volume passed 110 billion kWh in 2024, a sign that the network is not only large on paper but already moving meaningful electricity demand through real vehicles.
• By the end of November 2025, the national pile count had climbed beyond 19.32 million, making the 2024 expansion look less like a one-year spike and more like a continuing buildout cycle.
• Public facilities reached roughly 4.63 million by November 2025, while private facilities exceeded 14.7 million, reinforcing how strongly China’s charging model depends on both shared stations and residential installation.
• Private charging represented more than three quarters of the national stock by late 2025, which is important because home charging lowers public-station pressure and improves the economics of EV ownership.
• The national 2027 target of 28 million charging facilities gives the market a clear policy ceiling to plan against, especially for equipment suppliers, operators, utilities, and local governments.
• Public charging capacity is expected to exceed 300 million kW by 2027, so the next phase is about power availability and charging speed as much as the number of plugs.
• Around 35,000 highway service-area charging stations were in place by the end of 2024, covering about 98% of the expressway network and reducing the long-distance confidence gap for EV drivers.
• China held about 65% of global charging points in 2024 and about 60% of global electric light-duty vehicle stock, which is why global EV infrastructure benchmarks are now heavily shaped by Chinese deployment.
• Global public charging additions passed 1.3 million points in 2024, and roughly two-thirds of growth since 2020 came from China, showing how much one market has accelerated the worldwide charging curve.
• Guangdong’s 503,000 public piles in August 2023 show how far leading provinces can move ahead when EV adoption, manufacturing depth, urban density, and policy support line up.
• TELD, Star Charge, and YKC each operated hundreds of thousands of public piles by mid-2025, turning charging from a fragmented equipment market into a platform and utilization business.
• BYD’s 1,000 kW ultra-fast charging platform signals that China’s next competitive frontier is not only charger coverage but also how quickly drivers can recover range.
Why China’s Charging Network Now Has National Infrastructure Scale
Charging infrastructure matters more when EV ownership reaches national scale. A small public network can support early adopters, but it cannot support tens of millions of vehicles, holiday highway demand, taxi fleets, city logistics, or rural EV adoption. China’s charging market is therefore no longer just an accessory market. It is part of transport planning, grid planning, real estate policy, platform competition, and energy security.
The market-size data also changes how improvements should be valued. A single percentage-point improvement in charger uptime, public charger utilization, or charging-session success can affect millions of charging sessions. A small improvement in highway charging speed can reduce queues during peak travel periods. A residential charging approval reform can shift demand away from expensive public chargers and lower ownership friction for drivers.
Market-scale benchmarks and what they show
• Charging stock expanded from an early-stage base to 8.596 million facilities in 2023 and 12.82 million in 2024, which shows how quickly the market moved from pilot deployment to mass infrastructure.
• The network had already passed 18.64 million facilities by October 2025 and 19.32 million by November, giving planners a fresh baseline that is far above the end-2024 level.
• The 2027 target of 28 million facilities matters because it suggests the buildout still has room to grow even after the very large 2024-2025 expansion.
• A public-capacity goal above 300 million kW changes the market conversation from simple pile counts to transformer capacity, grid connections, fast charging, and station-level power management.
• Public charging capacity now has to serve passenger cars, taxis, ride-hailing fleets, logistics vehicles, highway travelers, and destination users at the same time.
• More than 110 billion kWh of charging volume in 2024 puts EV charging into the electricity-system conversation, not just the automotive conversation.
• China’s public charger stock is large enough to set global benchmarks, so international comparisons must account for the country’s unusually fast deployment speed.
• The three-year plan focuses on urban fast charging, expressway service areas, and rural shortages, which shows that coverage quality is replacing simple expansion as the next policy test.
The infrastructure question is therefore shifting. Earlier market analysis could ask whether China had enough chargers. A better question now is whether chargers are located in the right places, connected to enough power, maintained reliably, priced sensibly, and used often enough to support operator economics.
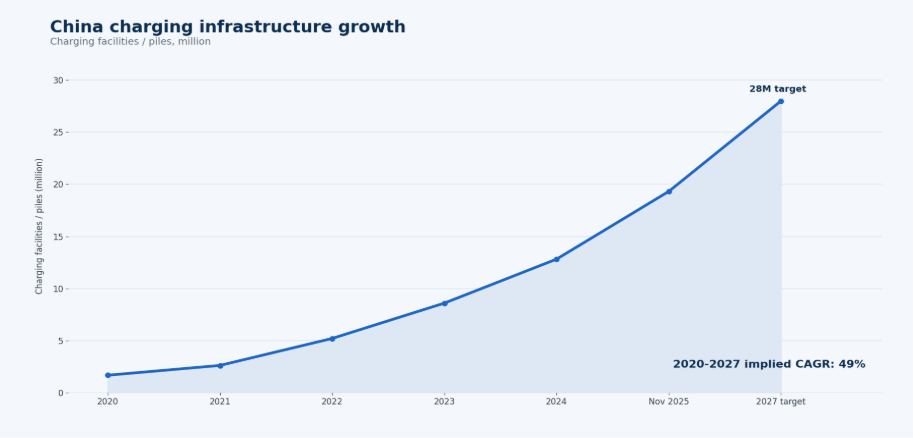
Figure 1. China’s charging infrastructure has shifted from early deployment to national-scale energy and transport infrastructure.
Charging Pile Growth: Public, Private, and Fast-Charging Expansion
The public-private split is one of the most important parts of China’s charging story. Public chargers receive more attention because they are visible in stations, malls, highways, and curbside areas. Private chargers, however, carry much of the daily charging load for owners with parking access. The market needs both.
Public and private charging benchmarks that explain daily use
• At the end of 2024, the split between 3.58 million public piles and 9.24 million private piles showed that China’s charging network is not one market but several connected use cases.
• By November 2025, public facilities had risen to about 4.63 million and private facilities to more than 14.7 million, so residential deployment continued to carry the larger share of national growth.
• Public facilities grew about 36% year over year by November 2025, a strong pace for infrastructure that requires sites, power access, maintenance, and operating platforms.
• Private facilities grew faster at about 57.8% year over year, suggesting that home and community charging is still scaling with EV ownership.
• The late-2025 private-to-public ratio of roughly 3.2 to 1 shows why China’s charging adequacy cannot be judged only by visible public stations.
• Private chargers made up about 76% of the national stock by late 2025, giving many drivers a lower-cost daily charging option and reducing dependence on public networks.
• Public chargers still matter because apartment residents, visitors, ride-hailing drivers, logistics fleets, and highway travelers cannot always rely on private parking.
• Private chargers matter just as much because they keep routine charging convenient, cheaper, and less stressful for the public grid during station peaks.
• Public charging value depends on location, speed, uptime, pricing, and utilization, so a pile in the wrong place is less useful than a smaller number of reliable high-demand chargers.
• Private charging growth depends on parking access, residential approvals, electrical capacity, and property coordination, which makes it a real-estate and community-management issue as well as an EV issue.
| Segment | What it includes | Market role | Main challenge |
|---|---|---|---|
| Public chargers | Urban stations, commercial parking, highway areas | Serves drivers without home charging | Utilization, site economics |
| Private chargers | Home and residential parking chargers | Supports daily low-cost charging | Parking access, approvals |
| Fleet chargers | Bus, taxi, ride-hailing, depots | Creates predictable demand | Peak load, scheduling |
| Highway chargers | Expressway and intercity fast-charging sites | Supports long-distance travel | Holiday queues, power capacity |
| Destination chargers | Retail, hotel, office, parking | Adds parked-time charging | Low utilization, maintenance |
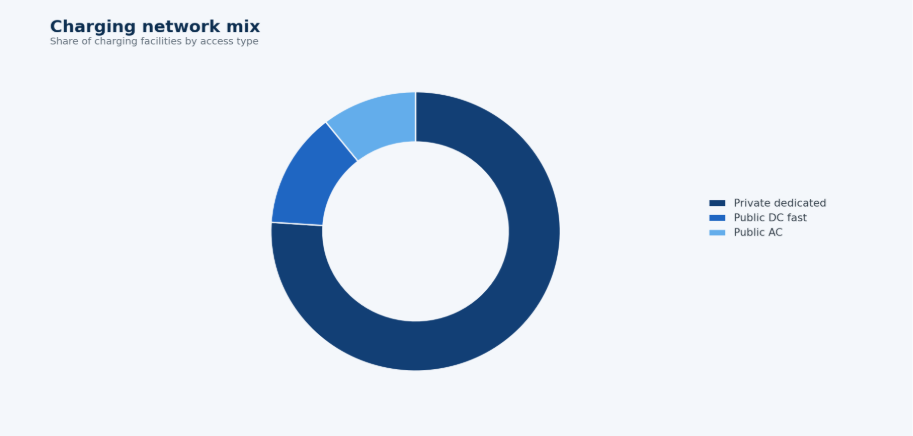
Figure 2. China’s charging network depends on both public-access chargers and private residential charging facilities.
Where China’s Charging Network Is Growing Fastest
National totals hide the biggest market difference: charging infrastructure is uneven by region. Dense coastal provinces, major cities, manufacturing hubs, and high-NEV-adoption markets have built large public networks earlier. Lower-density provinces, rural counties, and western regions face a different task: they need enough coverage to support confidence even where utilization may be weaker at first.
Regional benchmarks that explain where access is strongest
• The top 10 provinces and municipalities held about 70.7% of public piles in February 2024, showing that China’s public network remains highly concentrated in the strongest EV markets.
• A similar August 2023 dataset put the top 10 regions at about 71.2% of public facilities, confirming that concentration was not a one-month anomaly.
• Only 15 cities contained 57% of public charger stock in 2022, which explains why early public charging felt much easier in major urban markets than in smaller cities.
• Guangdong’s 503,000 public piles in August 2023 made it the clear provincial leader, supported by dense cities, manufacturing strength, high NEV demand, and fleet activity.
• Jiangsu’s roughly 168,000 public piles in August 2023 showed how eastern industrial provinces are building strong charging backbones around urban and manufacturing corridors.
• Zhejiang’s roughly 167,000 public piles placed it close to Jiangsu, reflecting the province’s strong private-car market, digital economy, and dense urban network.
• Shanghai’s roughly 148,000 public piles showed how a single high-income municipality can carry a public network comparable to some entire provinces.
• The February 2024 top-ten group – Guangdong, Zhejiang, Jiangsu, Shanghai, Hubei, Shandong, Beijing, Anhui, Henan, and Sichuan – shows that leadership now includes both coastal and inland growth centers.
• East China combines dense cities, manufacturing capacity, and high private-car use, making it one of the most commercially attractive charging regions.
• South China matters because Guangdong links NEV manufacturing, port logistics, city demand, and public charging scale in one market.
• North China benefits from policy-driven deployment and capital-region demand, but winter performance and evening peak load can make network quality harder to manage.
• Central China links large population centers with logistics corridors, so city charging and highway charging need to improve together.
• Southwest China can connect EV charging growth with hydropower-rich electricity, tourism routes, and rising inland EV adoption.
• Northwest China needs corridor-first planning because long distances and lower density make access more important than dense station clusters.
• Northeast China’s colder climate makes charger reliability, battery preconditioning, and winter fast-charging speed central to user trust.
| Region | Charging infrastructure pattern | What it means |
|---|---|---|
| East China | Dense EV adoption and public networks | Good utilization potential; parking and grid limits remain |
| South China | Guangdong-led commercial demand | Fast-charging and fleet opportunity |
| North China | Policy support and winter needs | Winter reliability matters |
| Central China | EV growth and logistics corridors | City and intercity capacity both matter |
| Southwest China | Hydropower and tourism routes | Green corridors can become differentiators |
| Northwest China | Sparse density and long routes | Coverage matters more than density |
| Northeast China | Cold climate and slower EV adoption | Uptime and winter charging are key |
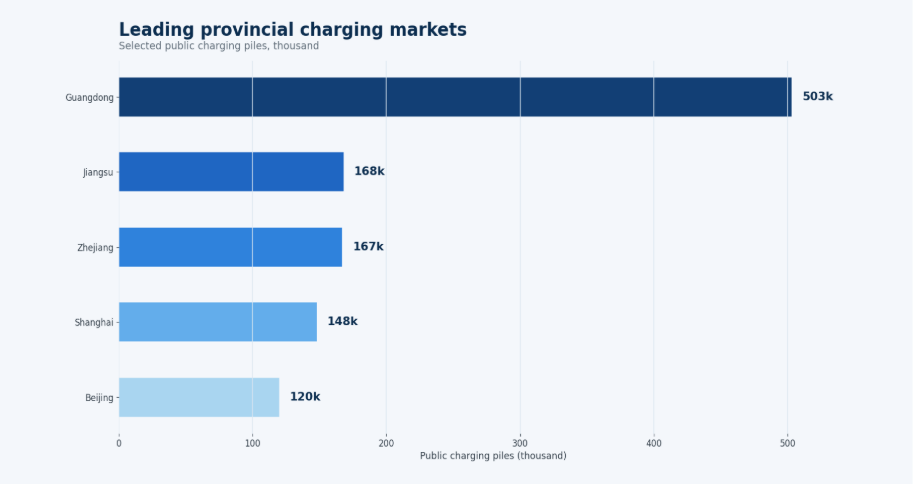
Figure 3. Leading coastal and city markets built large public charging networks earlier, while rural and western coverage is becoming a policy priority.
Highway, Rural, and County-Level Charging Coverage
Highway and rural charging are different from dense urban charging. City chargers can succeed through high daily traffic, shared mobility demand, destination parking, and delivery fleets. Highway chargers face sharper peaks, especially during holiday travel. Rural chargers often need to be built ahead of demand so drivers believe an EV will work outside major cities.
Highway and rural benchmarks that explain coverage quality
• Around 35,000 highway service-area charging stations were installed by the end of 2024, giving long-distance drivers far more coverage than in the early EV market.
• Coverage reached roughly 98% of expressway service areas, so the remaining challenge is less about basic presence and more about capacity, speed, and peak-hour reliability.
• The 2027 action plan emphasizes expressway upgrades, which means policymakers are looking beyond cities toward intercity confidence and holiday-travel pressure.
• Peak travel periods can still create queues even when annual utilization looks reasonable, because highway charging demand arrives in sharp bursts.
• Fast charging is more important on highways than at workplaces or homes because the driver is usually stopping to continue a trip, not parking for hours.
• Rural charging shortages are explicitly named in national planning, showing that the next adoption wave depends on more than Tier 1 and coastal-city coverage.
• County-level charging matters because EV sales are moving into smaller cities where drivers still need proof that daily and emergency charging will be available.
• Lower-tier and rural markets need chargers at county seats, township centers, transport nodes, tourist sites, and public-service facilities, not only at premium urban malls.
• Rural station economics can be weak at first because demand is dispersed and seasonal, so coverage may have to precede strong utilization.
• Public investment, grid planning, and shared-use models can fill early gaps where private operators cannot yet justify the business case alone.
| Challenge | Why it matters | Useful metric |
|---|---|---|
| Holiday peak queues | Drivers experience the network at its busiest moments, not just at annual average demand | Peak wait and queue length |
| Fast-charger availability | Long trips need shorter stops | DC share and high-power count |
| Grid connection | Service areas may need more transformer capacity as EV traffic grows | Available capacity and peak-load headroom |
| Reliability | A broken charger on a highway has a bigger trust cost than a broken urban charger | Uptime and repair time |
| Rural coverage | County and township charging determines whether EV adoption can move beyond big cities | County coverage, chargers per NEV, and station distance |
Fast Charging, Ultra-Fast Charging, and Battery-Swap Infrastructure
The next phase of China’s charging market is not just more piles. It is faster piles, better placed piles, smarter piles, and specialized energy systems for fleets and high-mileage users. Fast charging changes station turnover. Ultra-fast charging changes the comparison with refueling. Battery swapping changes the meaning of a charging stop for certain fleets and brands.
Technology benchmarks that explain charging convenience
• Public slow chargers still have a role in dense cities because many drivers park for long periods but do not have private parking spaces.
• DC fast chargers are essential for commercial stations, highways, taxis, ride-hailing vehicles, and logistics fleets where charging time directly affects earning time.
• Ultra-fast chargers rated at 150 kW and above grew about 50% globally in 2024 and now account for nearly 10% of public fast chargers, indicating that speed is becoming a worldwide differentiator.
• China’s high-power race accelerated as automakers promoted 800V platforms and 4C/5C charging, turning short-stop charging into a brand promise.
• BYD’s 1,000 kW platform is important because it reframes charging anxiety around minutes of range recovery rather than the total number of chargers.
• BYD’s plan for more than 4,000 ultra-fast units shows how automakers are treating charging as part of the vehicle value proposition.
• XPeng and Volkswagen’s network-sharing agreement covers more than 20,000 piles across 420 cities, showing that interoperability can create value without building every charger from scratch.
• Battery swapping remains relevant because NIO and other operators have shown that some drivers and fleets value predictable energy replacement over plug-in waiting time.
• Heavy-duty electric trucks need a different charging profile from passenger cars, creating demand for depot charging, megawatt systems, and stronger grid-storage integration.
• Liquid-cooled cables, station batteries, and smart scheduling become more important as public chargers move into higher power levels and shorter sessions.
| Technology | Typical role | Strength | Limitation |
|---|---|---|---|
| AC slow charging | Home, work, destination sites | Lower cost and grid-friendly | Slow session speed |
| DC fast charging | Public stations, highways, fleets | Faster high-mileage charging | Higher equipment and grid cost |
| Ultra-fast charging | Premium corridors, high-traffic city sites, next-generation EV platforms | Shorter stops and stronger user confidence | High power demand, cooling needs, and higher capex |
| Battery swapping | Brand networks, taxis, fleets, selected passenger vehicles | Very quick energy replacement and battery-service model | Requires standardization, inventory, and high station investment |
| Megawatt charging | Heavy-duty trucks, logistics corridors, depots | Supports electrified freight and high-energy vehicles | Early-stage, grid-intensive, and site-specific |
Technology mix should be interpreted through use case. Slow charging is not outdated when the vehicle is parked overnight. Ultra-fast charging is not automatically profitable if traffic is low and grid costs are high. Battery swapping is not simply a replacement for charging; it is a different infrastructure model with different capital requirements, vehicle compatibility, and operating logic.
Charging Operators, Utilization, and Market Profitability
A charging network can look impressive in pile count and still be difficult commercially. Operators must secure good sites, pay for grid access, maintain equipment, manage electricity costs, attract repeat users, keep apps and payments smooth, and avoid stranded low-utilization assets. This is why utilization and charging volume matter as much as deployment.
Operator and market benchmarks
• TELD managed about 807,000 public piles as of July 2025, giving it one of the largest platform footprints in the Chinese market.
• Star Charge managed about 703,000 public piles by July 2025, making it another scale operator in a market where coverage and software access both matter.
• YKC managed about 656,000 public piles by July 2025, showing that the leading tier is measured in hundreds of thousands of public charging assets.
• Large operators compete on station location, app discovery, charging speed, pricing, fleet contracts, payment experience, and reliability rather than hardware alone.
• Grid-backed operators have infrastructure access and policy alignment, but their commercial incentives may differ from independent charging platforms.
• Automaker networks such as NIO, Tesla, XPeng, and Li Auto use charging experience to protect brand trust and keep drivers inside their ecosystems.
• Fleet and depot charging can produce stronger utilization than some public stations because vehicles return on predictable schedules and charge repeatedly.
• Commercial public stations depend on daily sessions, kWh per session, electricity spread, service fee, uptime, and parking flow, so the best sites behave more like energy retail assets than simple parking equipment.
• Low-utilization rural or destination chargers can still be strategically useful when they remove range anxiety and make a broader route network credible.
• Public fast-charging prices can be materially higher than home charging, so drivers balance convenience, time savings, and cost every time they choose a station.
| Operator type | Examples | Core advantage | Main pressure |
|---|---|---|---|
| Grid-backed operators | State Grid, China Southern Power Grid | Grid access and policy support | Commercial flexibility |
| Independent charging platforms | TELD, Star Charge, YKC, Xiaoju | Large networks and software platforms | Utilization and margin pressure |
| Automaker networks | NIO, Tesla, XPeng, Li Auto, BYD-linked systems | Brand experience, loyal users, and route confidence | High capex and uneven non-owner access |
| Fleet and depot operators | Bus, taxi, delivery, logistics charging providers | High repeat use and predictable demand | Peak-load management and depot power upgrades |
| Property and parking operators | Malls, offices, hotels, communities, public parking lots | Location control and destination traffic | Revenue sharing, repair responsibility, and low idle demand |
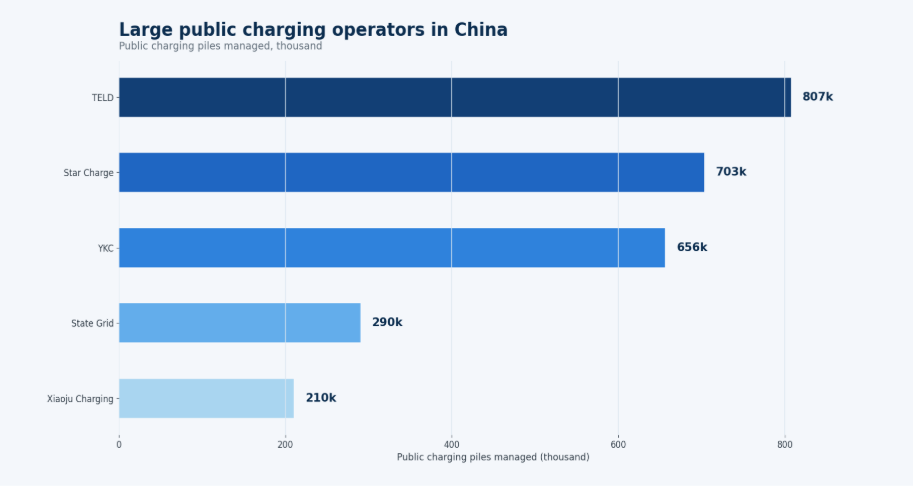
Figure 4. Large public charging operators manage hundreds of thousands of charging piles, but utilization and service quality determine commercial strength.
Grid Integration, Energy Storage, and Smart Charging
Charging infrastructure is also a grid issue. Millions of chargers do not draw power evenly across the day. Fast-charging stations can create sharp local peaks, while residential charging can either strain evening load or shift flexibly into off-peak periods. As the network grows, charging quality will depend on distribution capacity, digital control, time-of-use pricing, and station-level energy storage.
Grid benchmarks that explain charging sustainability
• Charging volume above 110 billion kWh in 2024 makes EV charging a visible load category for utilities and distribution-grid planners.
• The 2027 target of more than 300 million kW in public charging capacity shows that power delivery is becoming as important as equipment count.
• Fast-charging stations require stronger grid connections than home or workplace AC chargers, so site selection increasingly depends on electrical capacity.
• Ultra-fast charging can require station batteries, upgraded transformers, liquid cooling, and demand-management systems, which raises both capability and capital cost.
• Time-of-use pricing can move some demand into off-peak periods, helping users save money while reducing evening grid stress.
• Fleet depots need scheduling software because many vehicles return together and still need guaranteed departure readiness for the next shift.
• Solar-storage-charging stations can reduce grid pressure, but the economics depend on local tariffs, land cost, storage cost, and station utilization.
• Vehicle-to-grid pilots could turn parked EVs into flexible load resources, but broad adoption still needs standards, warranty clarity, and market incentives.
• Smart charging can lower pressure on the grid by controlling timing without reducing the driver’s required mobility.
• Grid readiness will become more important as the market shifts from low-power access toward high-power convenience.
| Metric | Why it matters |
|---|---|
| Peak charging load | Shows whether local transformers and distribution assets can handle charging demand |
| Off-peak charging share | Indicates whether users respond to tariffs and smart-charging incentives |
| Station storage capacity | Helps reduce peak demand and support ultra-fast charging sites |
| Fast-charger power rating | Shows the grid intensity of a station, not just its pile count |
| V2G pilot participation | Measures early progress toward flexible demand and distributed energy services |
| Renewable electricity share | Helps evaluate the low-carbon quality of charging, not only EV adoption |
| Failed-session rate | Connects grid, software, hardware, and payment reliability into a user-facing metric |
The grid interpretation is simple but important: charging infrastructure cannot be scaled only through hardware procurement. It needs siting, power availability, demand response, smart controls, and maintenance. A charger that exists but cannot reliably deliver power at peak demand does not solve the driver’s problem.
China vs Global Charging Infrastructure Markets
China’s charging market is best understood against global benchmarks because the country is no longer just one participant in the market. It shapes the global average. When international reports discuss public charging growth, fast charger deployment, or charger adequacy, China is often the largest component of the comparison.
Global charging infrastructure comparison benchmarks
• Global public charging additions exceeded 1.3 million points in 2024, increasing the worldwide stock by more than 30% and showing that charging infrastructure is scaling beyond China as well.
• About two-thirds of public charger growth since 2020 occurred in China, which explains why the country dominates global infrastructure comparisons.
• China held about 65% of global charging points in 2024, giving it a scale advantage that no other market currently matches.
• China also held about 60% of global electric light-duty vehicle stock in 2024, so charger deployment has broadly followed the size of the EV fleet.
• Europe had just over 1 million public charging points at the end of 2024, which makes it a large market but still far smaller than China by installed count.
• Europe’s public charging stock grew by more than 35% in 2024, indicating that the region is accelerating even though deployment is spread across many countries.
• The United States had just under 200,000 public charging points at the end of 2024, reflecting a market where geography, highway coverage, and home charging all shape infrastructure needs.
• U.S. public charging stock grew by about 20% in 2024, a meaningful pace but still slower than China’s scale expansion.
• The Netherlands had more than 180,000 public charging points at the end of 2024, making it one of Europe’s densest public-charging markets despite its smaller vehicle base.
• Germany had around 160,000 public charging points and France around 155,000, showing that the largest European economies are building significant but still more distributed networks.
• Indonesia, Thailand, Malaysia, and Vietnam together had more than 24,000 chargers in 2024, about 9 times their 2022 level, which points to a fast-rising Southeast Asian base.
• China has more than one public charger for every 10 electric cars, while some markets face a tougher adequacy problem because EV adoption is moving faster than charger rollout.
| Country / region | Charging market pattern | Key takeaway |
|---|---|---|
| China | Largest charger network, fastest infrastructure scale, and high public charger contribution | Scale leader; quality is next |
| United States | Large geography, interstate focus, and heavier home-charging reliance | Highway fast-charging coverage and charger reliability remain central |
| European Union | Dense deployment in leading markets and strong standardization needs | Cross-border roaming, payment access, and fast-charging corridors matter |
| Netherlands | High public-charger density and strong urban public charging model | Public access supports drivers without private parking |
| Germany | Industrial EV transition and expanding highway fast charging | Grid upgrades and fast charging remain priorities |
| Norway | Mature EV adoption and high user familiarity | Charging quality matters as much as availability |
| India | Earlier-stage public network with high future demand potential | Two-wheelers, fleets, and urban charging may shape growth differently |
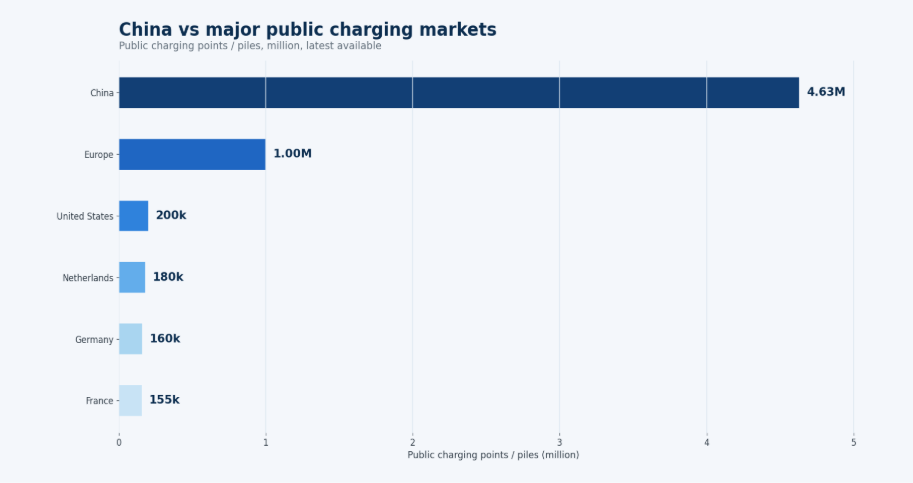
Figure 5. China’s public charging scale is far ahead of other major markets, but each country has a different charging model and home-charging profile.
Policy Targets and 2030 Market Outlook
Policy support remains central because charging infrastructure has public-good characteristics. Rural coverage, highway confidence, grid upgrades, and residential charging access may not always be delivered quickly by private investment alone. China’s 2027 action plan shows that policy is moving from basic deployment toward service capacity, urban fast charging, expressway upgrades, and rural gaps.
Policy benchmarks that explain the next buildout phase
• China’s plan to reach 28 million charging facilities by the end of 2027 gives the market a concrete buildout target instead of a vague growth direction.
• Public charging capacity above 300 million kW by 2027 shows that national planning is now focused on how much power the network can deliver, not only how many plugs it has.
• The planned capacity is intended to serve more than 80 million EVs, tying charging infrastructure directly to the next stage of vehicle adoption.
• Urban fast-charging upgrades are part of the plan because dense cities need shorter sessions, better turnover, and more reliable public access.
• Expressway service-area upgrades are also included, which keeps long-distance confidence at the center of infrastructure planning.
• Rural charging shortages are named as a policy problem, signaling that geographic inclusion is now part of the market’s growth story.
• Moving from 19.32 million piles in November 2025 to 28 million facilities by 2027 would require continued large-scale installation over roughly two years.
• The gap between the November 2025 base and the 2027 target is about 8.7 million additional facilities, a figure large enough to support equipment demand, installation work, and grid upgrades.
• Public capacity targets suggest that DC share, average charger power, and high-power station design will become more important than basic AC pile additions.
• By 2030, the most useful indicators will be uptime, kWh throughput, public capacity, fast-charger share, station storage, and regional coverage rather than total pile stock alone.
| Policy area | What it supports | Market effect |
|---|---|---|
| Public charging buildout | More city and shared chargers | Improves shared access |
| Residential charging | Home and community charging | Reduces public-network pressure |
| Rural charging | County, township, and service-node deployment | Expands EV adoption beyond large cities |
| Fast charging | High-power sites in cities and corridors | Reduces charging wait time and improves driver confidence |
| Grid upgrades | Distribution capacity, smart charging, and storage | Allows high-power charging growth without local grid stress |
Charging Demand by Use Case
China’s charging market is not one market. Residential drivers, taxis, buses, logistics fleets, highway users, and rural motorists all use chargers in different ways, so one national pile count can hide very different demand patterns.
A home charger supports routine overnight use, while a taxi depot depends on repeated daily sessions. Highway and rural sites may look weaker by average utilization, but they can be essential for coverage and driver confidence.
Segment benchmarks and market-use signals
| Segment | How charging is used | Best signal to watch |
|---|---|---|
| Private passenger cars | Daily low-cost home/work charging | Private access and off-peak share |
| Urban public users | Short sessions near daily parking | Sessions and failure rate |
| Taxis and ride-hailing | Frequent high-mileage charging with tight turnaround | kWh per charger per day and queue time |
| Buses and logistics fleets | Depot charging tied to predictable routes | Depot capacity and vehicle readiness |
| Highway users | Time-sensitive stops with sharp holiday peaks | Fast-charger availability and peak wait time |
| Rural and county users | Coverage-led deployment before high utilization | Distance to nearest charger and county coverage |
Charging Infrastructure Diagnostic Framework
A polished charging benchmark should help a team decide where to look next. The useful model connects statistics to action, because a market can add many chargers and still struggle with uptime, utilization, regional balance, or grid capacity.
| Problem area | Core signals to measure | Useful benchmark from this report |
|---|---|---|
| Charger access | Chargers per EV, public charger density, regional coverage, residential access | The network exceeded 19.32 million piles by Nov 2025, but distribution remains uneven |
| Charging speed | DC share, ultra-fast charger count, average session time, highway fast-charger availability | Ultra-fast charging and 150 kW+ chargers are becoming strategic differentiators |
| Utilization | kWh per charger, sessions per day, peak/off-peak use, fleet demand | Charging volume exceeded 110 billion kWh in 2024 |
| Reliability | Uptime, failed-session rate, app/payment errors, repair response time | User trust depends on working chargers, not listed chargers |
| Highway coverage | Service-area chargers, queue times, fast-charger share, peak holiday demand | Highway service-area coverage reached about 98% by end-2024 |
| Rural coverage | County/township coverage, station distance, low-density economics | Rural shortages are named in the national action plan |
| Grid readiness | Transformer capacity, peak load, storage integration, demand response | The 2027 plan targets more than 300 million kW of public charging capacity |
This framework keeps the article from becoming a pile-count scoreboard. Each metric belongs to a business question: can drivers access chargers, can they charge quickly, can stations earn enough, can the grid support demand, can highways handle peaks, can rural markets adopt EVs, and can operators maintain reliable service?
90-Day Charging Infrastructure Benchmark Plan
Statistics become useful when they are translated into a measurement plan. A practical review can be organized into a 90-day cycle rather than a vague market scan. The goal is to compare charger supply with real vehicle demand, regional gaps, grid limits, and operator economics.
| Timing | What to do | Output |
|---|---|---|
| Days 1-30 | Build the baseline by province, charger type, operator, power level, highway coverage, and public/private split | National and regional map |
| Days 31-60 | Compare charger supply with NEV ownership, charging volume, expressway traffic, rural coverage, and fleet demand | Priority list of key markets |
| Days 61-90 | Review utilization, uptime, station economics, grid capacity, service pricing, and high-power charging readiness | A repeatable scorecard for investment and planning decisions |
Metrics EV Infrastructure Leaders Should Track
The final scorecard should be detailed enough to locate the problem without becoming a vanity dashboard. A mature charging market review should show whether the network is available, accessible, fast, reliable, commercially useful, and grid-ready.
| Metric | Why it matters |
|---|---|
| Total charging facilities | Shows national scale and momentum |
| Public charging piles | Measures shared charging access |
| Private charging piles | Shows residential charging maturity and daily charging convenience |
| DC fast charger share | Shows whether the network can support fast public sessions and highway travel |
| EV-to-charger ratio | Measures whether infrastructure is keeping pace with vehicle adoption |
| Charging volume | Shows real market usage rather than only installed supply |
| Utilization rate | Indicates whether stations are commercially viable and well located |
| Charger uptime | Measures whether users can trust the network when they arrive |
| Average session time | Shows convenience and station turnover quality |
| Highway coverage | Measures long-distance EV readiness and peak travel resilience |
| Rural charger coverage | Shows rural market inclusion |
| Operator market share | Shows competitive concentration and platform power |
| Grid connection capacity | Measures whether sites can support high-power charging |
| Charging electricity price | Affects user cost, operator margin, and public charging competitiveness |
China EV Charging Infrastructure Market FAQ
Common questions
• How large is China’s EV charging infrastructure market?
China has the world’s largest installed charging network, with 12.82 million charging facilities by the end of 2024 and more than 19.32 million charging piles by November 2025.
• How many public and private chargers does China have?
By November 2025, public charging facilities stood near 4.63 million, while private facilities exceeded 14.7 million.
• Which regions lead China’s charging infrastructure market?
Leadership is concentrated in high-adoption coastal and city markets, including Guangdong, Zhejiang, Jiangsu, Shanghai, Beijing, Anhui, Henan, and Sichuan.
• Does China have enough highway chargers?
Basic highway coverage is strong. About 35,000 highway service-area charging stations covered roughly 98% of the expressway network by the end of 2024.
• Who are the largest charging operators in China?
The market includes independent platforms, grid-backed operators, automaker networks, and fleet providers. TELD, Star Charge, and YKC are among the largest public charging platforms.
• How does China compare with Europe and the United States?
China is far ahead by scale, holding about 65% of global charging points in 2024. Europe had just over 1 million public charging points, while the United States remained below 200,000.
• What will matter most by 2030?
The market will be judged less by pile count and more by uptime, utilization, charging speed, rural coverage, highway performance, grid integration, and operator profitability.
Final Takeaway
China is already the global scale leader in EV charging infrastructure, but the next phase will be judged by quality, balance, and use. The strongest market scorecard now combines 19.32 million+ charging piles, public and private access, fast-charging capacity, highway and rural coverage, uptime, grid readiness, utilization, and operator profitability. The winning markets will be those where charging supply, charging speed, location quality, and business economics improve together.


