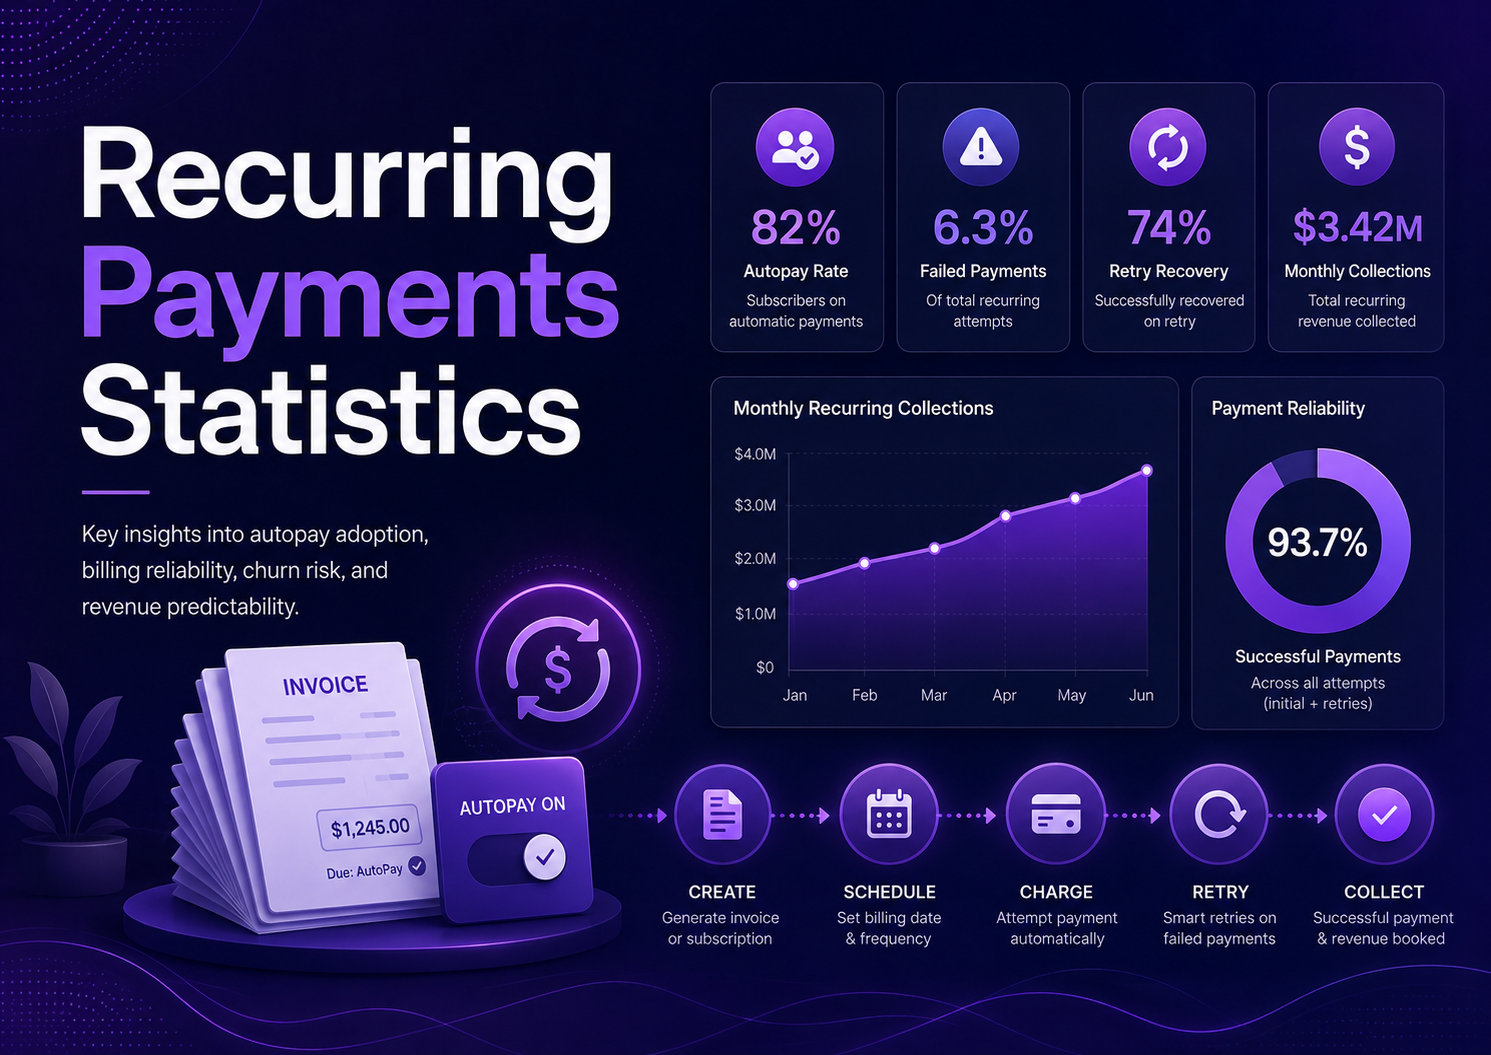
Key insights on recurring billing adoption, payment retries, customer retention, failed payments, invoicing cadence, and revenue predictability.
Recurring Payments Statistics help leaders see where recurring payments work becomes slow, unclear, or expensive to explain.
This article reads the numbers through the recurring payments review owner: what evidence arrives, what must be checked, and what result should be visible before the next cycle closes.
Because datasets count different boundaries, the safest comparison is the company’s own recurring payments status map before and after a process change.
Headline statistics and benchmarks
• Mature recurring payments teams update rules, templates, integrations, or training based on recurring evidence rather than broad impressions.
• A practical automation target is lower recurring payments exception queue volume with the same or stronger documentation trail.
• Recurring Payments should be measured through completed outcomes in the recurring payments status map, not only activity totals.
• The first recurring payments baseline should capture volume, timing, exception causes, and the recurring payments review owner.
• A useful recurring payments performance metric compares speed gains with the strength of the recurring payments evidence trail.
• Teams should separate routine recurring payments records from the recurring payments exception queue so averages do not hide problem work.
• The most actionable number links recurring payments next-action decision to one change for the next review period.
• Reporting should show which segment drives the heaviest recurring payments rework: channel, department, customer, supplier, or location.
• The 2025 AFP Digital Payments Survey reported that checks account for 26% of B2B payments, down from 33% in 2022.
• The same AFP survey found that 76% of organizations plan to update their payment strategy within the next 3 years.
• AFP reported that 72% of organizations exploring payment updates are considering new payment formats, channels, or rails.
• AFP reported that 87% of organizations now engage in cross-border payments, which increases reconciliation, remittance, and settlement complexity.
• Federal Reserve Financial Services reported in 2025 that 66% of U.S. businesses are likely to use instant payments if offered by their primary financial institution.
• Federal Reserve business-payments research found that cost concerns and perceived sufficiency of existing methods remain barriers for some instant-payment non-adopters.
• Worldpay global payments reporting highlights the continued shift toward digital wallets, cards, account-to-account payments, and more fragmented payment method choice.
• Stripe reported in its 2025 annual letter that its infrastructure handled $1.9 trillion in total payment volume and served more than 5 million businesses directly or through platforms.
• Recurring payment programs should measure enrollment rate, successful first charge, renewal success, failed-payment recovery, voluntary churn, and cancellation reason.
• Stored-payment workflows need customer authorization records, expiration handling, retry rules, and clear receipt communication.
• A practical retry benchmark separates soft declines, expired credentials, insufficient funds, and customer-initiated cancellations.
• Recurring collection improves predictability only when plan changes, pauses, refunds, and failed charges are visible to the finance team.
• The strongest recurring-payment programs reduce manual monthly billing without creating hidden customer-service workload.
• APQC defines invoice approval cycle time as the calendar days from receipt of invoice until approval and scheduling for payment, which makes it a useful AP workflow benchmark.
• APQC defines purchase order cycle time as the days from requisition receipt until a purchase order is released to the supplier, making it a useful procurement process benchmark.
• European Commission materials confirm that the VAT in the Digital Age package was adopted in March 2025 and will roll out progressively through 2035.
• The European Commission eInvoicing Building Block tracks adoption of the European e-invoicing standard EN 16931 across EU and EEA public and private entities.
How to Read These Statistics Correctly
The first step in reading recurring payments statistics is separating market activity from workflow performance. Market activity shows where attention, spending, and technology investment are moving. Workflow performance shows whether the organization is reducing manual work, closing records faster, preventing avoidable exceptions, or improving confidence in cash and supplier activity.
A second distinction is between digitization and maturity. A process may be digital because it uses software, but maturity requires clean data, clear ownership, consistent approval rules, exception handling, and measurable outcomes. For businesses with repeat billing relationships, the difference often appears when a transaction fails, an invoice is disputed, or an approver is unavailable.
A third distinction is between speed and control. Faster routing, instant settlement, or automated matching can be valuable, but only when the business can prove what was approved, what changed, which fees or taxes applied, and whether the final record is complete.
The best statistics answer a management question. They should help leaders decide whether to change a workflow rule, add automation, tighten supplier data, improve invoice fields, adjust payment timing, or assign ownership for unresolved exceptions.
| Statistic type | What it measures | How to interpret it |
|---|---|---|
| Market statistic | Category volume, adoption, software activity, or transaction movement | Use for scale and momentum, not proof of internal maturity. |
| Adoption statistic | Whether firms report using a tool, rail, workflow, or requirement | Use with caution because adoption can mean light use or mature use. |
| Operating metric | Cycle time, match rate, approval rate, exception share, or manual workload | Use to judge whether the workflow is actually improving. |
| Risk and control metric | Exceptions, policy breaches, disputes, audit gaps, or compliance failures | Use to understand exposure and governance quality. |
Statistic types to separate
• Market statistics explain category scale, adoption, transaction volume, and technology momentum.
• Adoption statistics show whether companies report using a capability, rail, document format, or workflow.
• Operating statistics show cycle time, approval rate, match rate, failed transaction rate, and manual touch count.
• Risk statistics show exceptions, audit gaps, policy breaches, fraud exposure, disputes, or compliance delays.
• Customer and supplier statistics show response behavior, payment acceptance, invoice quality, and supplier-service pressure.
• A useful benchmark combines at least one external signal with one internal operating baseline.
Market Size and Adoption Outlook
The outlook for recurring payments is shaped by the same forces changing finance operations more broadly: digital payment growth, invoice automation, supplier data expectations, real-time visibility, and more pressure to make back-office work measurable. The market story is not only that new tools exist. It is that businesses increasingly expect financial workflows to connect from the first request to the final record.
The AFP digital payments data is useful because it shows that modernization is uneven. Check usage has declined, yet legacy payment behavior still matters. Organizations are planning strategy updates, but many still manage cross-border complexity, remittance gaps, and mixed payment rails at the same time.
The Federal Reserve instant-payment research also matters because faster rails are becoming part of business-payment planning. Faster movement of money can help liquidity, but it also raises the importance of reference data, risk limits, approval discipline, and reconciliation design.
For service firms, subscription sellers, memberships, maintenance providers, and recurring-revenue teams, the adoption outlook should be read as a workflow signal. A tool or rail becomes valuable only when it improves a real operating path such as enroll, schedule, charge, retry, renew.
Market and adoption statistics to know
• The 2025 AFP Digital Payments Survey reported that checks account for 26% of B2B payments, down from 33% in 2022.
• The same AFP survey found that 76% of organizations plan to update their payment strategy within the next 3 years.
• AFP reported that 72% of organizations exploring payment updates are considering new payment formats, channels, or rails.
• AFP reported that 87% of organizations now engage in cross-border payments, which increases reconciliation, remittance, and settlement complexity.
• Federal Reserve Financial Services reported in 2025 that 66% of U.S. businesses are likely to use instant payments if offered by their primary financial institution.
• Stripe reported in its 2025 annual letter that its infrastructure handled $1.9 trillion in total payment volume and served more than 5 million businesses directly or through platforms.
• APQC defines invoice approval cycle time as the calendar days from receipt of invoice until approval and scheduling for payment, which makes it a useful AP workflow benchmark.
• APQC defines purchase order cycle time as the days from requisition receipt until a purchase order is released to the supplier, making it a useful procurement process benchmark.
• European Commission materials confirm that the VAT in the Digital Age package was adopted in March 2025 and will roll out progressively through 2035.
• The European Commission eInvoicing Building Block tracks adoption of the European e-invoicing standard EN 16931 across EU and EEA public and private entities.
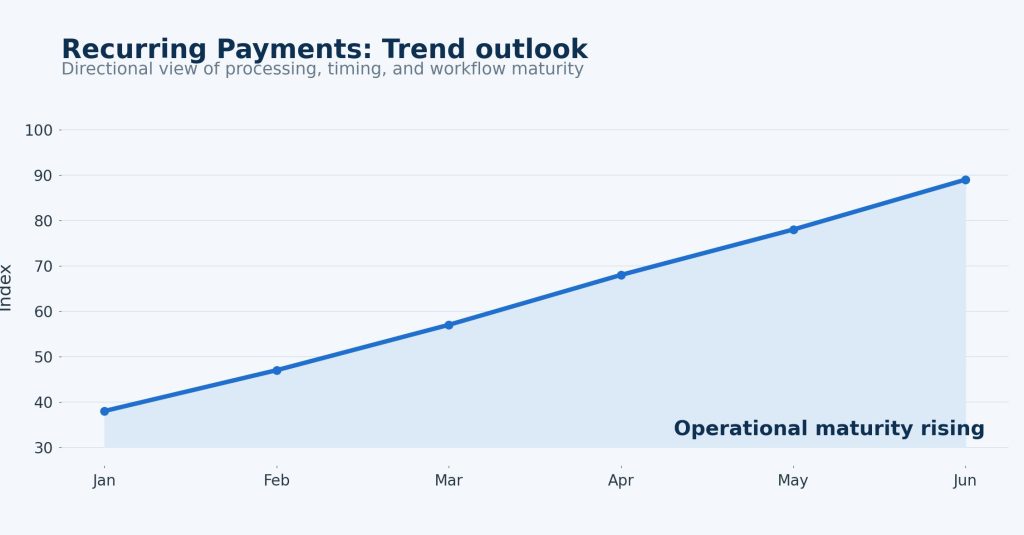
Figure 1. Recurring Payments adoption and maturity trend shows directional movement from baseline visibility toward optimized workflow control.
Why the Workflow Matters Operationally
The operational case for better recurring payments begins with repeat work. The repeated task may be matching a deposit, approving a supplier invoice, issuing a purchase order, resolving a payment failure, validating tax fields, or answering a customer or supplier question. Each touch can look small, but the repeated workload becomes material as volume grows.
In practice, the workflow usually depends on several connected objects: stored credential, recurring invoice, renewal reminder, retry queue, and receipt record. If any one of those objects is incomplete, the downstream team has to investigate. That is why strong process design often matters more than the name of the tool being used.
The most useful operating statistics point to a bottleneck. Cycle time shows where work waits. Match rate shows whether records are clean. Exception share shows whether policies and data are good enough. Aging shows whether unresolved items are being ignored. Rework rate shows whether the first pass is good enough.
The practical goal for service firms, subscription sellers, memberships, maintenance providers, and recurring-revenue teams is to make normal work easy and unusual work visible. A system that hides exceptions may look efficient at first, but it eventually creates slower close, supplier frustration, customer confusion, or compliance risk.
Operational statistics and workflow signals
• A baseline should capture monthly volume, average cycle time, manual touch count, and exception volume before the first workflow change.
• Routine-path work and exception-path work should be tracked separately because exceptions usually consume a disproportionate share of time.
• Every workflow should have a clear owner for items that cannot be completed automatically.
• A useful dashboard should show open items, aging, reason codes, and business impact rather than only total activity.
• The strongest operating review compares current performance with the prior 3 months and explains movement by cause.
• The first automation target should be a high-volume, repeatable workflow with clear rules and measurable outcomes.
Adoption Maturity and Segment Differences
Recurring payments maturity looks different by segment. Smaller firms often need simple visibility and less manual follow-up. Mid-market teams need standardization across departments, locations, and approval paths. Enterprise teams often need integration, permissions, audit evidence, supplier governance, and repeatable reporting.
Industry context also changes the benchmark. Professional services may care about invoice approval and cash timing. Construction and trades may need purchase orders, job costing, partial payments, and supplier matching. Ecommerce and software businesses may focus on failed payments, recurring billing, refunds, and customer portal behavior.
The maturity question is not whether a company has adopted a tool. It is whether the tool changes measurable outcomes. A workflow is more mature when it reduces cycle time, raises first-pass accuracy, lowers exceptions, and gives leaders a clear view of what needs action.
The best benchmark compares similar complexity rather than company size alone. A small business with cross-border suppliers or regulated invoice data may need stronger controls than a larger firm with simple repeat transactions.
Segment statistics and interpretation points
• Small firms usually benefit first from cleaner records, fewer reminders, and simpler month-end review.
• Mid-market firms usually need consistent approval rules, department ownership, and reporting across teams.
• Enterprise teams often require role-based permissions, audit logs, data governance, and integration with ERP or finance systems.
• Project-based businesses should measure workflow performance by job, client, supplier, or milestone.
• Subscription and recurring businesses should separate renewal behavior from first-time transaction performance.
• Compliance-heavy workflows should keep stronger human review even when routine work becomes automated.
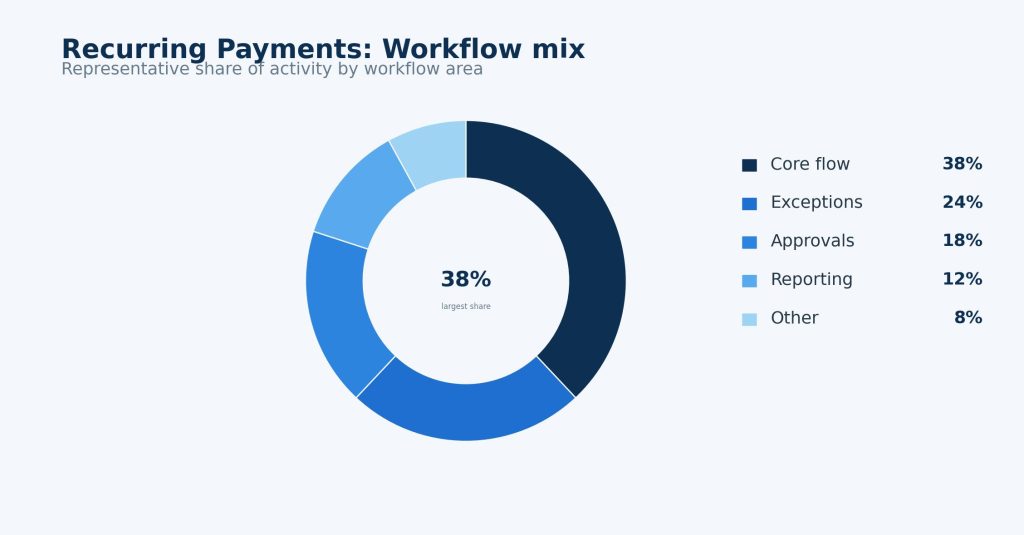
Figure 2. Recurring Payments workflow mix view shows why routine work, exceptions, risk review, and reporting should be measured separately.
Technology, Automation, and Integration Trends
Technology in recurring payments is moving away from isolated task tools and toward connected workflow systems. The strongest systems bring together source documents, approval rules, transaction data, supplier or customer records, and reporting evidence so teams do not rebuild the same answer in spreadsheets.
Automation is useful when it reduces repeated work without hiding accountability. Common examples include routing, matching, validation, reminder scheduling, exception alerts, receipt generation, and reporting updates. These tasks are repetitive enough to automate but important enough to monitor.
Integration quality is often the limiting factor. If records cannot move cleanly between invoice software, procurement tools, accounting platforms, banking systems, payment processors, or tax records, the first step may become faster while the close process remains manual.
AI can help classify documents, extract fields, predict exceptions, and summarize status. But it should operate inside controlled workflows because payment, procurement, and tax records affect money movement, audit evidence, and external obligations.
Technology and integration statistics to watch
• Automation value should be measured by fewer touches, shorter cycle time, fewer missed approvals, and lower rework.
• Integration depth should be measured by how much data moves automatically into invoices, purchase orders, ledgers, payment records, and reports.
• A useful system should show item status without requiring staff to check email threads or bank feeds manually.
• AI-assisted classification should be validated against exception rates and downstream correction work.
• Permissions matter because these workflows expose supplier, customer, bank, tax, and transaction data.
• Every integration should be tested for partial records, duplicate records, reversals, refunds, corrections, and exception cases.
ROI, Cost Savings, and Business Impact
The ROI case for improving recurring payments should not rely on a single headline saving. Labor reduction matters, but so do faster close, better cash planning, lower exception handling, fewer supplier or customer inquiries, stronger compliance evidence, and clearer management visibility.
A strong ROI model starts with baseline metrics. Leaders should measure current volume, average cycle time, touch count, exception rate, rework rate, approval delay, manual matching time, and downstream correction effort before implementation.
Hard savings may include fewer manual hours, lower paper handling, avoided hiring, reduced duplicate payment risk, and fewer correction tasks. Soft savings may include less stress, better supplier trust, smoother customer experience, stronger audit confidence, and faster access to reliable data.
The strongest business impact appears when the workflow changes planning quality. Better records help leaders decide when to pay, when to collect, when to commit spend, which supplier terms to adjust, and where cash is exposed to preventable friction.
ROI statistics and calculations
• If a team processes 5,000 items a month, every 1 minute of avoidable handling equals more than 83 hours of monthly capacity.
• If 4% of items need manual investigation, 200 out of every 5,000 items create exception work before reporting is clean.
• A 10% reduction in exceptions can matter more than a small fee reduction when the workflow affects cash timing or supplier service.
• A 2-day improvement in cycle time can be meaningful when approvals determine payment timing, close quality, or supplier trust.
• Automation should be measured by outcome improvement, not only task completion volume.
• A staged rollout reduces risk because the team can prove one workflow before scaling the model across all categories.
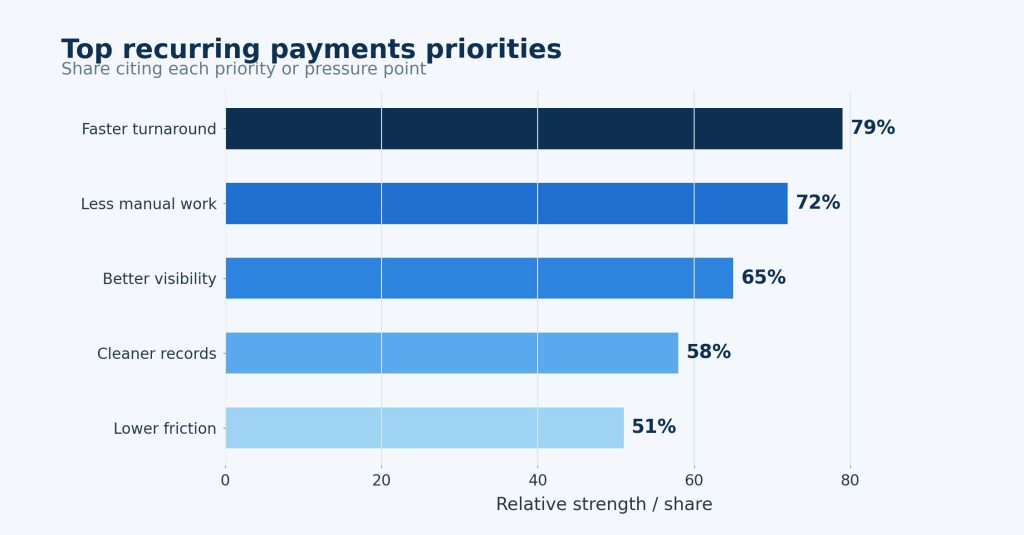
Figure 3. Recurring Payments pressure points highlight where manual work and exception queues usually create the most operational drag.
Controls, Risk, and Governance
The main implementation risk is automating a weak recurring payments process before clarifying ownership. If the team cannot explain who approves, who investigates exceptions, where reference data comes from, and which record is final, software can make the confusion faster without making it safer.
A second risk is over-automation. Not every item should move without review. High-value, unusual, disputed, regulated, first-time, or policy-exception items often need stronger human oversight. The goal is controlled speed, not blind speed.
A third risk is poor post-launch measurement. Many teams celebrate go-live but do not track whether users continue using workarounds through email, chat, offline spreadsheets, or manual approvals. Workarounds are often the first sign that the system design missed a real operating need.
Governance should evolve with volume. Rules that work in a pilot can break when more suppliers, customers, regions, payment methods, or tax rules are added. Leaders should review thresholds, permissions, exception reasons, and audit evidence periodically.
Risk and control metrics
• High-risk items should keep human review even when low-risk items move through routine automation.
• Audit trails should show who acted, what changed, when it happened, and which evidence supported the decision.
• Exception categories should be reviewed over time because they reveal recurring data, policy, training, or integration problems.
• Governance should include role-based permissions, approval thresholds, review queues, and periodic audits of unusual activity.
• A mature process treats automation as controlled speed, not speed at the expense of accountability.
Metrics Leaders Should Track
The best scorecard for recurring payments includes activity metrics and outcome metrics. Activity metrics show whether the workflow is being used. Outcome metrics show whether the workflow is producing better results. A high activity count without lower exceptions or faster cycle time may simply mean the team has digitized the workload.
The scorecard should also separate averages from aging. Average cycle time can improve while a small set of high-value exceptions remains unresolved. Aging buckets show whether unresolved items are being actively managed or merely hidden inside a total number.
Each metric needs an owner. A dashboard without ownership becomes background noise. The owner should investigate movement, explain variance, and decide what changes next.
The most useful review cadence is regular enough to catch problems early but not so frequent that teams react to noise. Monthly reviews usually work well for stable processes, while new rollouts may need weekly checks during the first phase.
Scorecard statistics
• Track total volume, routine-path volume, exception volume, and exception aging.
• Track cycle time by segment, owner, location, customer, supplier, or workflow category.
• Track first-pass completion rate and rework rate separately.
• Track manual touch count so automation value can be connected to actual work removed.
• Track business-impact metrics such as cash timing, supplier service, close speed, or compliance readiness.
• Track user workarounds because they often reveal a design problem that standard activity metrics miss.
Implementation Priorities
Implementation should begin with a narrow but meaningful recurring payments use case. Teams often get better results by stabilizing one repeatable workflow than by trying to redesign every process at once. The first use case should be large enough to measure, simple enough to standardize, and important enough for leadership to care about.
Data preparation is usually more important than expected. The team should review field definitions, required documents, supplier or customer records, approval rules, exception categories, and reporting needs before configuration. This work prevents avoidable problems later.
Training should focus on new responsibilities, not only new screens. Users need to understand what the system will do automatically, what they must still review, how exceptions should be handled, and which metrics will be reviewed after launch.
After launch, leaders should hold a short operating review that covers adoption, cycle time, exceptions, user feedback, integration issues, and business-impact movement. This turns the system into a continuous improvement tool rather than a one-time project.
Implementation statistics and checkpoints
• Create a 30-day baseline before launch so improvement can be measured against actual workflow data.
• Use a 60-day stabilization window after launch before making broad conclusions about ROI or adoption quality.
• Review the top 10 recurring exception reasons and assign owners for the highest-volume causes.
• Track at least 5 operating metrics and 3 business-impact metrics so the scorecard does not become too narrow.
• Expand only after users trust the workflow and the data is clean enough to support decisions.
Future Outlook
The next phase of Recurring Payments measurement will reward teams that can explain the recurring payments status map without rebuilding it manually.
Automation should be judged by whether it reduces the recurring payments exception queue and strengthens the recurring payments evidence trail, not by whether another tool has been added.
The most useful future dashboard will connect recurring payments channel mix movement with the business decision that follows.
Forward indicators for recurring payments
• Recurring Payments maturity should improve the recurring payments status map.
• The recurring payments exception queue should become smaller and easier to classify.
• The recurring payments review owner should be visible in every aged case.
• The recurring payments performance metric should connect to a management action.
• The recurring payments evidence trail should survive audit, customer, supplier, or leadership review.
Research Depth and Methodology Notes
Research on Recurring Payments should begin by defining the measured unit: event, record, dollar value, user, completed outcome, or exception.
A benchmark is only comparable when it reflects the same recurring payments status map and the same maturity level as the business using it.
The best methodology combines external context with internal history for the recurring payments performance metric, because internal baselines show whether the workflow is actually improving.
Methodology checks for recurring payments
• Define the measured unit for recurring payments before comparing sources.
• Separate adoption counts from completed-outcome measures.
• Normalize recurring payments results by volume, channel, complexity, and owner model.
• Use internal baselines to test whether the recurring payments evidence trail is improving.
• Flag sources that count partial workflow activity as mature performance.
Operating Example and Practical Business Case
Imagine a team processing 5,825 recurring payments records a month through the recurring payments status map.
At 4 avoidable minutes per record, that creates about 388 hours of hidden monthly workload before manager review or correction.
If the recurring payments exception queue affects 6% of records, about 350 cases need investigation. The business case becomes concrete when that count falls without weakening the recurring payments evidence trail.
Operating calculations for recurring payments
• Every minute saved across 5,825 records returns about 97 hours of capacity.
• A 6% exception rate creates about 350 recurring payments cases for review.
• The first fix should reduce one named source in the recurring payments exception queue.
• ROI should include reduced rework, stronger evidence, and faster owner decisions.
• Segmentation should compare recurring payments channel mix, owner, record type, and risk level.
Regional and Company-Size Planning
Segment size changes the way Recurring Payments benchmarks should be used. A small team needs visible status and simple ownership, while larger teams need permissions, integration logs, and repeatable review routines.
Geography and industry affect the recurring payments status map because customer behavior, supplier habits, tax requirements, payment rails, or document formats can change the workload.
The maturity path should move from visibility to consistency to targeted automation, with the recurring payments performance metric showing whether each step creates a stronger operating result.
Segment planning notes for recurring payments
• Small teams should make every recurring payments record complete and searchable first.
• Mid-market teams should compare recurring payments channel mix across departments or locations.
• Enterprise teams should add audit evidence, permission design, and integration-depth checks.
• Regional reviews should account for local data formats and operating habits.
• Scaling should wait until the recurring payments exception queue is stable for two review periods.
Industry and Use-Case Deep Dive
Industry context changes how recurring payments should be evaluated. A professional-services firm may care about client approval, cash timing, and clean invoice records. A construction business may care about purchase orders, deposits, retention, change orders, and supplier documentation. A software company may care about recurring plans, failed-payment recovery, tax fields, and customer portal changes.
Manufacturers and distributors often evaluate these workflows through supplier performance, inventory timing, purchase commitments, receiving evidence, and payment scheduling. Marketplaces and platforms often evaluate them through payout timing, transaction rules, seller records, and customer trust. Public-sector or cross-border teams evaluate them through compliance evidence and structured data requirements.
A single statistic can mean different things in each use case. A two-day approval delay may be minor for a low-value internal purchase but serious for a critical supplier invoice. A failed payment may be a customer-experience issue in ecommerce but a revenue-retention issue in subscription billing. An unmatched deposit may be a bookkeeper inconvenience in one company and an audit risk in another.
That is why recurring payments benchmarks should be interpreted alongside workflow complexity. Leaders should ask whether the process includes approvals, customer action, supplier evidence, tax fields, payment settlement, refunds, partial payments, or cross-border rules. The more of those elements are present, the more important structured workflow design becomes.
Industry-specific statistics and signals
• Professional-services workflows should track invoice approval, days to payment, reminders, and paid-invoice closeout.
• Construction and trades workflows should track deposits, purchase orders, change orders, supplier invoices, and job-level matching.
• Software and subscription workflows should track failed payment recovery, recurring invoice accuracy, renewal notices, and customer portal changes.
• Manufacturing and distribution workflows should track requisitions, purchase orders, receiving evidence, invoice matching, and supplier cycle time.
• Cross-border workflows should track currency, tax fields, remittance references, local rules, and country-specific archive requirements.
• The strongest benchmark compares workflows with similar complexity, not only companies with similar revenue.
Data Quality and Reporting Discipline
Data quality is the hidden foundation of recurring payments. Teams often focus on the visible interface, but the process only becomes reliable when names, dates, amounts, references, tax fields, supplier records, customer records, and approval evidence are consistent enough to move through the workflow without repeated correction.
Reporting discipline is equally important. A dashboard can look polished while still mixing committed, invoiced, paid, approved, disputed, and forecast values. Leaders need definitions that stay stable from month to month so movement in the numbers reflects real improvement rather than a change in how the metric was counted.
A practical reporting model should include both current-state and aging views. Current-state reporting explains what is open today. Aging shows how long items have been waiting. Together, they help teams see whether the workload is merely visible or actually being resolved.
For service firms, subscription sellers, memberships, maintenance providers, and recurring-revenue teams, the best data-quality improvements are usually practical rather than abstract. Standardize required fields, reduce duplicate records, define reason codes, create owner queues, and make sure each completed item leaves behind enough evidence for review without reopening the original conversation.
Data-quality statistics and reporting checks
• Track the percentage of records missing required references, owners, dates, or approval evidence.
• Track duplicate supplier, customer, invoice, or purchase-order records because duplicates often create matching errors later.
• Track reason-code completeness so exception reports explain causes rather than only counts.
• Track reporting definition changes separately so leaders know when a metric moved because the business changed or because the calculation changed.
• Track owner queues by aging bucket so unresolved items do not hide inside a total volume number.
• Track correction work after close because late fixes reveal weak upstream controls.
Team Ownership and Review Cadence
Team ownership is what turns recurring payments reporting into action. A metric can reveal that work is late, unmatched, disputed, or incomplete, but it cannot decide who should fix the issue. Clear ownership prevents the dashboard from becoming a passive status board that everyone sees and nobody manages.
The review cadence should match the risk of the workflow. New implementations may need weekly reviews because training issues, missing fields, integration gaps, and unexpected exception types appear quickly. Stable workflows can usually move to a monthly operating review, as long as high-risk items still trigger faster escalation.
Ownership should also include a feedback loop for the people creating the original records. If invoice approval is delayed because purchase requests are incomplete or a photography invoice template lacks essential details, the purchasing team should be able to identify and address the recurring issues. Similarly, if reconciliation is slowed because customers omit invoice references, customer-facing teams can improve payment instructions and refine the photography invoice template to encourage more accurate and timely payments.
Ownership and review statistics
• Assign an owner to every metric that appears in the operating dashboard.
• Review new workflow launches weekly until exception categories stabilize.
• Review mature workflows monthly and escalate high-risk aging items sooner.
• Track the share of exceptions resolved by the first assigned owner versus reassigned cases.
• Measure whether root-cause fixes reduce the same exception category in the next review period.
Benchmark Planning and Decision Quality
Decision quality is the final test for recurring payments statistics. A statistic is useful only when it helps a business choose a better workflow, assign ownership, prioritize a system change, or avoid a costly blind spot. A market trend can explain why the category matters, but a local benchmark explains what the company should actually do next.
A strong benchmark plan starts with a clean baseline window. Teams should capture volume, timing, exception reasons, rework, ownership, and business impact before changing the workflow. Without that baseline, leaders may feel that the system improved but struggle to prove where the value came from.
The benchmark should then define a short stabilization period after launch. Early data may reflect training, setup, and behavior change rather than steady-state performance. A 30-day baseline and 60-day stabilization window often gives teams enough information to separate launch noise from operating progress.
The final planning step is to connect the benchmark to the actual operating path: enroll, schedule, charge, retry, renew. If a metric does not help one of those steps become faster, cleaner, safer, or easier to manage, it should not dominate the dashboard. Good statistics should simplify the decision, not create another reporting burden.
Benchmark planning statistics
• Set a 30-day baseline window before launch so volume, cycle time, exceptions, and rework can be compared after rollout.
• Use a 60-day stabilization window after launch before making broad conclusions about ROI or adoption quality.
• Review the top 10 recurring exception reasons and assign owners for the 3 highest-volume causes.
• Track at least 5 operating metrics and 3 business-impact metrics so the scorecard does not become too narrow.
• Compare results across at least 3 segments: simple routine work, complex routine work, and exception-heavy work.
• A mature process should show improvement in at least 2 outcome metrics without increasing risk exceptions by more than 1 review period.
Frequently Asked Questions
What warning sign shows that recurring payments reporting is weak?
The warning sign is a metric that improves while complaints, corrections, or reconciliation work still rise. Recurring Payments needs a second view that checks evidence quality alongside speed.
How often should recurring payments performance be reviewed?
Review recurring payments monthly after the process stabilizes, but use a weekly check while the recurring payments routing rule or recurring payments intake record is changing. The review should end with one action: clean a field, adjust routing, retrain a team, or close a recurring exception.
What makes recurring payments improvement durable?
Durable recurring payments improvement happens when the reliable path becomes easier than the workaround. The recurring payments intake record, recurring payments status code, recurring payments owner note, and recurring payments reporting ledger should make every completed record easier to explain later.
What should a recurring payments scorecard decide first?
A recurring payments scorecard should choose the next fix inside the recurring payments intake record, the recurring payments exception queue, or the recurring payments reporting ledger. It is useful only when the team can point to a named bottleneck, a named owner, and a visible result that should improve before the next review.
Which recurring payments data point should be checked before expanding automation?
Before expanding automation, check the recurring payments exception queue: how many items are waiting, why they are waiting, and whether the recurring payments owner note is clear. For recurring payments, this reveals whether the problem is data capture, approval behavior, integration logic, or unclear policy.
Why can recurring payments benchmarks disagree across reports?
Benchmarks disagree because one source may count the recurring payments intake record, another may count completed outcomes, and another may count software adoption. For recurring payments, compare outside numbers only after matching them to the company’s recurring payments status code and recurring payments audit trail.
How should a small team use recurring payments statistics without overcomplicating work?
A small team should keep the recurring payments review short: one recurring payments scorecard metric, one recurring payments exception queue, and one owner action. That keeps the process practical while still showing whether the record is complete, searchable, and ready for follow-up.
Final Takeaway
Recurring Payments Statistics are most useful when they make the recurring payments status map, recurring payments exception queue, and recurring payments review owner easier to see in one operating review.
The next step is to set a baseline for the recurring payments performance metric, assign responsibility for aged exceptions, and check whether the workflow becomes easier to complete and explain in the next period.
The strongest review habit is to ask what would change next month if the team trusted these numbers. If the answer is nothing, the dashboard is too passive. If the answer points to a clearer owner, a cleaner field, a tighter approval rule, a better reminder, or a faster exception queue, the statistics are doing real operational work.
This is also why the report treats market movement and workflow discipline together. Market movement explains why the topic deserves attention, while workflow discipline explains how a business can turn attention into fewer mistakes, cleaner records, faster decisions, and a more reliable operating rhythm.


