Online food delivery has moved from a restaurant convenience feature into a large consumer-platform market. The category now includes marketplace ordering, restaurant-owned delivery, grocery delivery, quick commerce, convenience-store delivery, subscription passes, sponsored listings, digital payments, and courier networks. That makes delivery a demand system, a logistics system, and a restaurant economics system at the same time.
The strongest benchmarks show why the market needs to be measured in layers. Grand View Research’s horizon data estimates global online food delivery revenue at USD 288.84 billion in 2024 and USD 505.50 billion by 2030, implying a 9.78% CAGR. Platform-to-consumer delivery accounted for more than 71% of global type revenue in 2024, while restaurant-to-consumer delivery still represented more than USD 83.89 billion. A wider services-market view places online food delivery services at USD 380.43 billion in 2024 and USD 618.36 billion by 2030.
The regional picture is just as important. The United States, China, India, the United Kingdom, Japan, Canada, South Korea, Germany, Australia, France, Brazil, Saudi Arabia, Mexico, and the United Arab Emirates all show different delivery economics. A market that works in dense Chinese cities, mature U.S. suburbs, Gulf premium restaurant zones, or Indian quick-commerce neighborhoods cannot be managed through one global average.
Executive Online Food Delivery Benchmarks
These are the statistics that frame the market. They show the size of the delivery economy, the shift toward platforms, the role of grocery and convenience delivery, and the difference between order growth and profitable growth.
The numbers that define the delivery market
• Grand View Research horizon data estimates global online food delivery revenue at USD 288.84 billion in 2024.
• The same global series projects online food delivery revenue of USD 505.50 billion by 2030.
• The 2024-2030 global market series implies a 9.78% CAGR and USD 216.66 billion of absolute revenue growth.
• Platform-to-consumer delivery accounted for more than 71% of global online food delivery type revenue in 2024.
• Platform-to-consumer revenue is estimated at USD 204.94 billion in 2024 and USD 384.42 billion by 2030.
• Restaurant-to-consumer delivery is estimated at USD 83.89 billion in 2024 and USD 121.08 billion by 2030.
• The wider online food delivery services market is estimated at USD 380.43 billion in 2024 and USD 618.36 billion by 2030.
• Statista’s grocery delivery outlook projects grocery delivery market volume at USD 1.04 trillion in 2026.
• The United States online food delivery market is estimated at USD 52.67 billion in 2024 and USD 93.36 billion by 2030.
• China online food delivery revenue is estimated at USD 48.17 billion in 2024 and USD 87.11 billion by 2030.
• India online food delivery revenue is estimated at USD 26.20 billion in 2024 and USD 59.55 billion by 2030.
• DoorDash reported 685 million total orders in Q4 2024 and 761 million total orders in Q2 2025.
• DoorDash Marketplace GOV reached USD 21.3 billion in Q4 2024 and USD 24.2 billion in Q2 2025.
• Uber Delivery adjusted EBITDA reached USD 727 million in Q4 2024, up 53% year over year.
• Delivery Hero generated EUR 48.8 billion of GMV and EUR 12.8 billion of Total Segment Revenue in FY 2024.
• Meituan revenue reached CNY 93.58 billion in Q3 2024, while its core local commerce revenue reached CNY 69.37 billion.
• Zomato’s revenue increased 73% year over year to INR 35.62 billion in the March 2024 quarter.
• Blink it GOV growth reached 97% in the same quarter, showing how quick commerce is becoming part of the broader food-delivery story.
Editorial readout
Online food delivery is not one market. It is a mix of marketplace meals, restaurant-owned ordering, grocery delivery, quick commerce, convenience delivery, and advertising-driven platform economics. A single global revenue number becomes useful only when it is separated by country, order frequency, basket size, delivery model, courier cost, restaurant margin, and repeat behavior.
Why Online Food Delivery Now Carries Global Consumer-Platform Stakes
Delivery platforms sit between consumers, restaurants, grocery retailers, convenience stores, couriers, advertisers, and payment providers. That gives the category more strategic value than a normal restaurant channel. Each order can generate marketplace revenue, delivery fees, advertising income, subscription retention, payment data, and customer habit formation.
The global scale changes the business case. When revenue is measured in hundreds of billions of dollars, a small movement in order frequency, average order value, late-delivery rate, subscription adoption, or platform take rate can become financially material. The same is true on the cost side, because courier supply, fuel, batching, refunds, packaging, and service quality can quickly change unit economics.
Growth also depends on the type of delivery. Restaurant meals are frequent and impulsive, grocery baskets are larger but harder to fulfill, convenience delivery depends on speed and nearby inventory, and quick commerce needs dense neighborhoods. Treating all of these as one market hides the reason some delivery models scale more profitably than others.
Key Online Food Delivery Statistics
- The global online food delivery market serves hundreds of millions of consumers annually across restaurant, grocery, convenience, and quick-commerce categories.
- Industry estimates suggest that more than 60% of urban consumers have used a food delivery app at least once in the past year.
- Mobile applications account for over 70% of online food delivery orders in many major markets.
- Subscription programs can increase customer retention, with members often placing 20–30% more orders than non-members.
- Delivery fees, commissions, and advertising services can generate multiple revenue streams from a single order.
- Grocery delivery orders typically have higher average order values than restaurant meal deliveries, though fulfillment costs are also higher.
- Quick-commerce platforms target delivery times of 10–30 minutes, making logistics efficiency a critical competitive factor.
- Customer surveys show that speed, convenience, and pricing remain the top three factors influencing platform choice.
- A small increase in average order value or order frequency can translate into millions of dollars in additional annual revenue for large delivery platforms.
- Digital advertising has become a major profit driver, with sponsored listings and promoted products contributing a growing share of marketplace revenue.
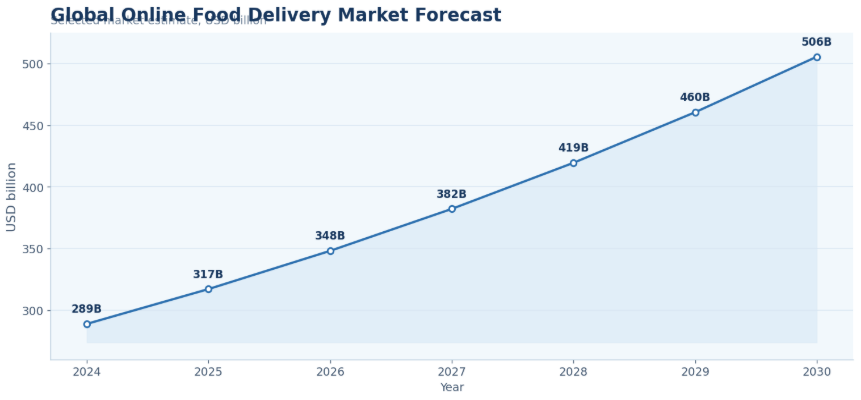
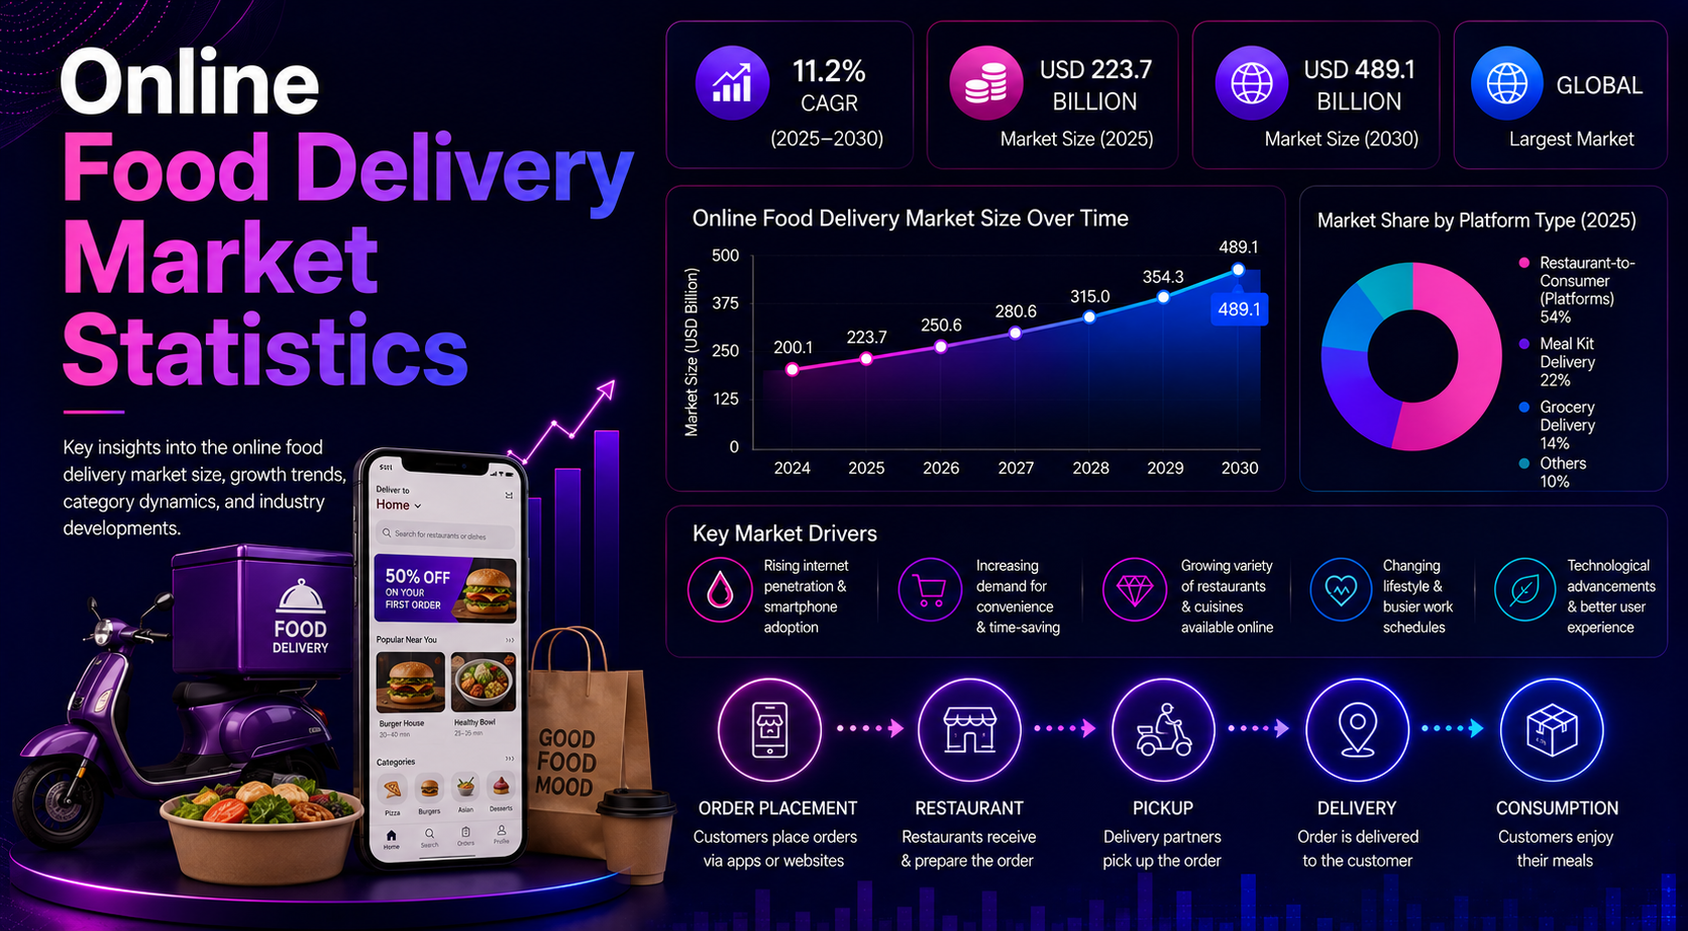
Figure 1. Online food delivery market scale should be reviewed through meals, grocery delivery, convenience delivery, and quick commerce because each model captures a different part of consumer demand.
Global Online Food Delivery Market Size and Forecast
Market-size statistics are useful only when they are separated from order economics. Gross order value, net revenue, delivery fees, advertising revenue, and adjusted EBITDA describe different parts of the delivery system.
Market-size and growth benchmarks
• The global online food delivery market is estimated at USD 288.84 billion in 2024.
• Global revenue is projected to reach USD 317.08 billion in 2025 and USD 348.08 billion in 2026.
• The same series projects USD 382.11 billion in 2027, USD 419.47 billion in 2028, and USD 460.48 billion in 2029.
• By 2030, global online food delivery revenue is projected at USD 505.50 billion.
• The 2024-2030 series produces a 1.75x growth multiple for global online food delivery revenue.
• A wider services-market estimate places global online food delivery services at USD 380.43 billion in 2024.
• The services-market view projects USD 412.51 billion in 2025, USD 447.30 billion in 2026, and USD 618.36 billion in 2030.
• The services-market series implies an 8.43% CAGR from 2024 to 2030.
• An alternative market outlook estimates global online food delivery revenue at USD 284.73 billion in 2026 and USD 468.51 billion by 2031.
• Another alternative services outlook estimates USD 467.67 billion in 2026 and USD 790.01 billion by 2031.
Market-size interpretation
Revenue growth can come from more orders, higher menu prices, delivery fees, grocery baskets, subscriptions, retail media, platform take rate, and inflation. Delivery leaders should separate order volume, gross order value, net revenue, contribution margin, and adjusted EBITDA before judging whether the market is improving.
Platform-to-Consumer and Restaurant-to-Consumer Delivery
The first split to watch is whether demand flows through marketplaces or direct restaurant channels. Platform-to-consumer delivery has the larger global share, but restaurant-to-consumer delivery remains important for brands that want more control over customer data, loyalty, pricing, and margins.
Delivery-model benchmarks
• Platform-to-consumer delivery held more than 71% of global type revenue in 2024, making marketplace apps the dominant delivery model.
• Platform delivery revenue is estimated at USD 204.94 billion in 2024 and is projected to reach USD 384.42 billion by 2030.
• The platform model implies an 11.05% CAGR from 2024 to 2030, adding nearly USD 179.47 billion in new revenue.
• Restaurant-to-consumer delivery revenue is estimated at USD 83.89 billion in 2024 and is projected to reach USD 121.08 billion by 2030.
• The restaurant-direct model implies a 6.31% CAGR from 2024 to 2030, adding about USD 37.19 billion in new revenue.
| Delivery signal | What it measures | Why it matters |
|---|---|---|
| Gross order value | Total order value flowing through the platform | marketplace scale before platform deductions |
| Order volume | Number of completed orders | usage frequency and demand depth |
| Active users | Consumers placing orders in a period | reach and retention opportunity |
| Merchant count | Restaurants, stores, and kitchens available | supply depth and local choice |
| Take rate | Platform revenue as a share of order value | monetization before cost control |
| Subscription usage | Orders tied to paid delivery passes | loyalty and repeat behavior |
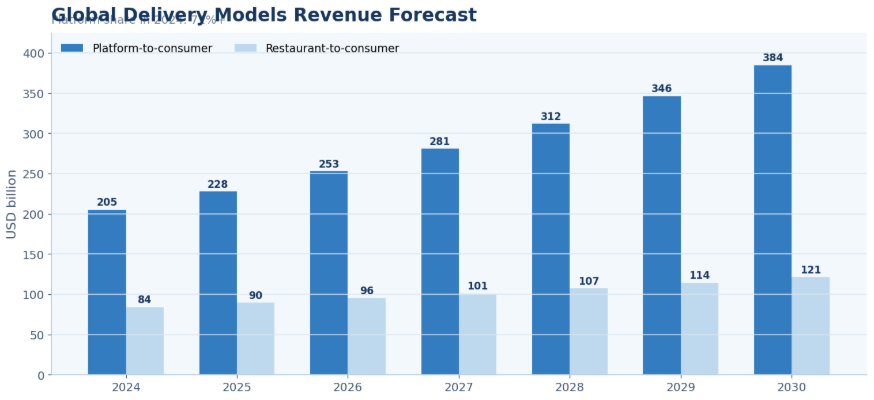
Figure 2. Platform and restaurant delivery should be measured separately because marketplace growth, restaurant control, customer data, and delivery economics do not move in the same way.
Delivery-model rule
Platform-to-consumer delivery usually scales faster because it concentrates demand, merchant supply, courier supply, and app usage in one marketplace. Restaurant-to-consumer delivery gives operators more control, but it requires stronger direct demand, delivery capacity, technology, and customer service.
Meal Delivery, Grocery Delivery, and Convenience Delivery Statistics
Online food delivery has expanded beyond restaurant meals. Grocery baskets, convenience-store drops, quick commerce, and meal kits have different order values, delivery promises, stock requirements, and refund risks.
Delivery categories worth separating
• Global online food delivery services revenue is estimated at USD 380.43 billion in 2024.
• The services market is projected to reach USD 618.36 billion by 2030.
• Grocery delivery market volume is projected at USD 1.04 trillion in 2026 in Statista’s grocery delivery outlook.
• Platform-to-consumer delivery revenue is estimated at USD 204.94 billion in 2024, making it the largest type in the core delivery-market split.
• Restaurant-to-consumer delivery revenue is estimated at USD 83.89 billion in 2024, showing that direct ordering remains a meaningful channel.
• Quick-commerce demand appears in platform results as grocery and convenience orders become part of food-delivery ecosystems.
• Zomato’s Blink it GOV growth of 97% in the March 2024 quarter shows how rapid-delivery grocery and convenience baskets can grow faster than mature meal delivery.
• Delivery Hero’s FY 2024 GMV of EUR 48.8 billion shows the scale of multi-category delivery platforms operating across food, grocery, and local commerce.
| Delivery category | Core demand driver | Business implication |
|---|---|---|
| Restaurant meals | Immediate hunger, variety, and convenience | High frequency but sensitive to fees and delivery time |
| Grocery delivery | Household planning and time saving | Larger baskets but more complex fulfillment |
| Convenience delivery | Urgent small-basket needs | Speed, location density, and inventory accuracy matter |
| Quick commerce | Ultra-fast replenishment | Dense cities and dark-store economics shape viability |
| Meal kits | Planned home cooking | Retention and subscription behavior matter |
| Cloud kitchens | Delivery-first production | Menu ranking, location, and platform visibility matter |
Category interpretation
A restaurant meal order, a grocery basket, and a convenience delivery order can all appear inside the same app, but they are not the same business. The useful comparison is order value, delivery time, fulfilment cost, substitution risk, refund rate, and repeat frequency.
Consumer Behaviour and Mobile Ordering Statistics
Consumer demand in online food delivery is shaped by speed, choice, app trust, discounts, payment ease, order tracking, and past delivery experience. The market grows when ordering becomes a habit rather than a one-time convenience.
Behavior benchmarks worth separating
• The 2024 global online food delivery market estimate of USD 288.84 billion shows that app-based ordering already captures a large share of meal and local-commerce demand.
• The 2030 projection of USD 505.50 billion means the market is expected to add USD 216.66 billion of revenue in six years.
• The United States 2024-2030 series implies a 10.01% CAGR, reflecting continued delivery demand even in a mature market.
• China’s 2024-2030 series implies a 10.38% CAGR, supported by dense-city ordering and mature super-app behavior.
• India’s 2024-2030 series implies a 9.70% CAGR, with growth supported by rising digital ordering, food platforms, and quick-commerce expansion.
• Mexico’s 2024-2030 series implies a 15.34% CAGR, making it one of the faster-growing country examples in the delivery market.
• Germany’s 2024-2030 series implies a 10.56% CAGR, showing that European delivery growth is not limited to the UK.
• The UAE’s 2024-2030 series implies a 7.90% CAGR, supported by premium restaurants, mobile ordering, and urban delivery density.
• DoorDash’s 761 million total orders in Q2 2025 show how repeat ordering can turn delivery into a high-frequency consumer behavior.
• Uber Delivery’s adjusted EBITDA margin of 3.6% of Gross Bookings in Q4 2024 shows why profitable growth depends on more than order frequency.
| Digital feature | Metric to track | Why it matters |
|---|---|---|
| Mobile app ordering | App order share and repeat rate | how’s habit formation |
| Saved payment | Checkout completion and order speed | Reduces friction before order placement |
| Subscription pass | Monthly order frequency and churn | Shows whether delivery becomes routine |
| Push notifications | Reorder rate and promotion response | Measures demand activation |
| Ratings and reviews | Restaurant conversion and complaint rate | Affects trust and ranking |
| Loyalty rewards | Repeat purchase and customer lifetime value | Improves retention when economics are controlled |
Consumer behavior interpretation
Delivery demand is not only about convenience. Consumers compare price, fees, promotions, delivery speed, food quality, restaurant choice, payment ease, and the last order experience. A market can grow in users while still struggling with retention if fees, delays, or refunds rise.
Restaurant Economics and Delivery Profitability
Restaurants can gain demand through delivery, but every order has cost layers. Commission, packaging, labor, menu-price inflation, discounts, refunds, and customer support can turn order growth into margin pressure.
Economics and margin benchmarks
• DoorDash reported a net revenue margin of 13.5% in Q4 2024.
• DoorDash net revenue margin was 13.4% for 2024.
• DoorDash adjusted EBITDA reached USD 566 million in Q4 2024 and USD 655 million in Q2 2025.
• Uber Delivery adjusted EBITDA reached USD 727 million in Q4 2024, up 53% year over year.
• Delivery Hero generated positive free cash flow of EUR 99 million in FY 2024.
• Delivery Hero adjusted EBITDA reached around EUR 750 million in FY 2024.
• Just Eat Takeaway adjusted EBITDA improved from EUR 339 million in 2023 to EUR 460 million in 2024.
• Just Eat Takeaway UK and Ireland adjusted EBITDA increased to EUR 219 million in 2024.
• Deliveroo adjusted EBITDA increased 52% to GBP 129.6 million in 2024.
• Deliveroo adjusted EBITDA margin improved from 1.2% of GTV in 2023 to 1.7% of GTV in 2024.
• Yum China reported that delivery driver expenses represented about 30% of labor costs in the cited coverage.
• KFC China delivery sales accounted for 55% of total sales in the cited 2026 coverage, up from 43% the previous year.
Profitability readout
For restaurants and platforms, delivery demand is valuable only when contribution margin is positive. A high order count can be weak if commissions, packaging, refunds, discounts, driver costs, and support issues rise faster than order value.
Driver, Logistics, and Last-Mile Delivery Statistics
Last-mile logistics is where customer experience and cost control meet. Delivery time, courier supply, batching, driver incentives, failed deliveries, refunds, and restaurant preparation speed determine whether the order feels convenient and whether the platform earns money.
• Delivery Hero’s GMV of EUR 48.8 billion in FY 2024 reflects the scale of order value that must be routed through local delivery and merchant networks.
• DoorDash’s 761 million Q2 2025 orders show the operational volume behind a large delivery marketplace.
• Meituan’s core local commerce revenue of CNY 69.37 billion in Q3 2024 reflects the scale of dense-city local delivery ecosystems.
• Meituan was cited with a 69% share of China’s roughly CNY 1 trillion delivery market in Reuters coverage of Chi Nairn data.
• KFC China’s delivery sales share of 55% shows how restaurant operators can become heavily dependent on delivery operations.
• Yum China’s driver expense figure of about 30% of labor costs highlights the operational cost attached to delivery sales.
• Uber Delivery’s 3.6% adjusted EBITDA margin of Gross Bookings shows why routing efficiency and marketplace density matter.
• Deliveroo’s adjusted EBITDA margin of 1.7% of GTV in 2024 shows that even improved delivery economics can remain thin.
| Logistics signal | What it reveals |
|---|---|
| Average delivery time | Whether the delivery promise matches customer expectations |
| Courier utilization | Whether courier supply and demand are balanced |
| Order density | Whether routes can be served profitably |
| Batch rate | Whether multiple orders can be delivered efficiently |
| Late delivery rate | Whether customer satisfaction and refunds are at risk |
| Refund and complaint rate | Whether service errors are eroding margin |
Regional Online Food Delivery Intelligence
Regional delivery data is one of the most important parts of the market. Global averages hide major differences in city density, payment habits, restaurant supply, courier availability, labor regulation, grocery behavior, and consumer fee tolerance.
North America
• The United States online food delivery market is estimated at USD 52.67 billion in 2024.
• U.S. online food delivery revenue is projected to reach USD 93.36 billion by 2030.
• The U.S. market series implies a 10.01% CAGR from 2024 to 2030.
• Canada’s online food delivery services revenue is estimated at USD 18.99 billion in 2024 and USD 28.64 billion by 2030.
• Mexico’s market is estimated at USD 1.66 billion in 2024 and USD 3.92 billion by 2030.
• DoorDash reported USD 24.2 billion of Marketplace GOV in Q2 2025, up 23% year over year.
• North America accounted for more than 27.0% of global online food delivery revenue in 2024 in the Grand View Research market context.
Europe
• The United Kingdom online food delivery market is estimated at USD 23.18 billion in 2024.
• The UK market is projected to reach USD 37.51 billion by 2030.
• Germany’s online food delivery market is estimated at USD 10.16 billion in 2024 and USD 18.57 billion by 2030.
• France’s online food delivery market is estimated at USD 6.99 billion in 2024 and USD 10.95 billion by 2030.
• Just Eat Takeaway adjusted EBITDA improved to EUR 460 million in 2024.
• Deliveroo adjusted EBITDA increased 52% to GBP 129.6 million in 2024.
• European delivery economics are shaped by labor rules, restaurant commissions, quick-commerce cost control, and mature urban competition.
Asia-Pacific
• China online food delivery revenue is estimated at USD 48.17 billion in 2024 and USD 87.11 billion by 2030.
• India online food delivery revenue is estimated at USD 26.20 billion in 2024 and USD 59.55 billion by 2030.
• Japan online food delivery services revenue is estimated at USD 22.62 billion in 2024 and USD 35.46 billion by 2030.
• South Korea online food delivery services revenue is estimated at USD 16.61 billion in 2024 and USD 27.00 billion by 2030.
• Australia online food delivery revenue is estimated at USD 9.71 billion in 2024 and USD 15.87 billion by 2030.
• Meituan revenue increased 22.4% year over year to CNY 93.58 billion in Q3 2024.
• Zomato revenue increased 73% year over year to INR 35.62 billion in the March 2024 quarter.
Latin America
• Brazil online food delivery revenue is estimated at USD 6.72 billion in 2024 and USD 11.70 billion by 2030.
• Mexico online food delivery revenue is estimated at USD 1.66 billion in 2024 and USD 3.92 billion by 2030.
• Argentina online food delivery revenue is estimated at USD 314.9 million in 2024 and USD 488.8 million by 2030.
• Mexico’s 15.34% CAGR from 2024 to 2030 makes it a high-growth country example in the delivery market.
• Latin American delivery growth is shaped by urban density, digital payments, local marketplaces, promotion sensitivity, and restaurant affordability.
Middle East & Africa
• The United Arab Emirates online food delivery market is estimated at USD 2.51 billion in 2024 and USD 3.96 billion by 2030.
• Saudi Arabia online food delivery services revenue is estimated at USD 7.98 billion in 2024 and USD 12.98 billion by 2030.
• The UAE market series implies a 7.90% CAGR from 2024 to 2030.
• Saudi Arabia’s online food delivery services series implies an 8.44% CAGR from 2024 to 2030.
• Middle East delivery growth is supported by premium restaurant demand, tourism, mobile-first ordering, grocery delivery, and high urban service expectations.
| Region | Online food delivery implication |
|---|---|
| North America | Mature platform competition, subscriptions, grocery delivery, and convenience delivery shape growth. |
| Europe | Regulation, labor rules, restaurant margins, and quick-commerce economics influence performance. |
| Asia-Pacific | China, India, super-app ecosystems, and dense cities make the region a major growth engine. |
| Latin America | Urban demand, digital payments, affordability, and marketplace consolidation shape adoption. |
| Middle East & Africa | Premium delivery, grocery apps, tourism, and mobile-first ordering support growth in major cities. |
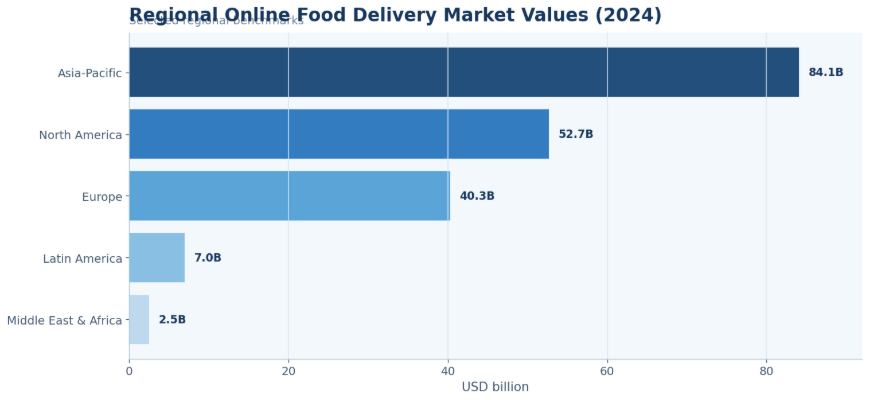
Figure 3. Regional online food delivery differences show why delivery strategy should be measured by country, not only by global averages.
Regional interpretation
Regional benchmarks should be read through city density, food habits, payment behavior, restaurant supply, and labor rules. North America shows mature marketplace competition, Europe adds heavier regulatory and labor pressure, Asia-Pacific has the strongest platform scale, Latin America depends heavily on urban adoption and payment access, and Gulf markets combine premium restaurant demand with high mobile-ordering expectations.
Country-Level Online Food Delivery Statistics
Country-level statistics show where the market is concentrated and where growth is likely to be faster. The same delivery app model can produce different results depending on income, urban density, restaurant supply, payment habits, and consumer expectations.
• The United States ranks #1 in the compiled 2024 country sample by online food delivery market revenue.
• China ranks #2 in the compiled 2024 country sample and is projected at USD 87.11 billion by 2030.
• India ranks #3 in the compiled 2024 country sample and is projected at USD 59.55 billion by 2030.
• The United Kingdom ranks #4 in the compiled 2024 country sample and is projected at USD 37.51 billion by 2030.
• Japan ranks #5 in the compiled 2024 country sample by online food delivery services revenue.
• Canada ranks #6 in the compiled 2024 country sample by online food delivery services revenue.
• South Korea ranks #7 in the compiled 2024 country sample by online food delivery services revenue.
• Germany ranks #8 in the compiled 2024 country sample by online food delivery market revenue.
• Australia is estimated at USD 9.71 billion in 2024 and USD 15.87 billion by 2030.
• France is estimated at USD 6.99 billion in 2024 and USD 10.95 billion by 2030.
• Brazil is estimated at USD 6.72 billion in 2024 and USD 11.70 billion by 2030.
• Saudi Arabia is estimated at USD 7.98 billion in 2024 and USD 12.98 billion by 2030 in the services-market series.
• The UAE is estimated at USD 2.51 billion in 2024 and USD 3.96 billion by 2030.
• Mexico is estimated at USD 1.66 billion in 2024 and USD 3.92 billion by 2030.
• Argentina is estimated at USD 314.9 million in 2024 and USD 488.8 million by 2030.
| Country | Delivery landscape | Market position |
|---|---|---|
| United States | DoorDash, Uber Eats, subscriptions, and grocery delivery | Mature market |
| China | Meituan, super-app ordering, dense urban delivery | Leading market |
| India | Zomato, Swiggy, digital ordering, quick commerce | High-growth market |
| United Kingdom | Deliveroo, Just Eat, and Uber Eats competition | Established market |
| Brazil | App-based restaurant delivery and urban demand | Key regional market |
| UAE | Premium restaurants, grocery delivery, and mobile-first ordering | Growing market |
| South Korea | High app usage and fast delivery culture | Advanced market |
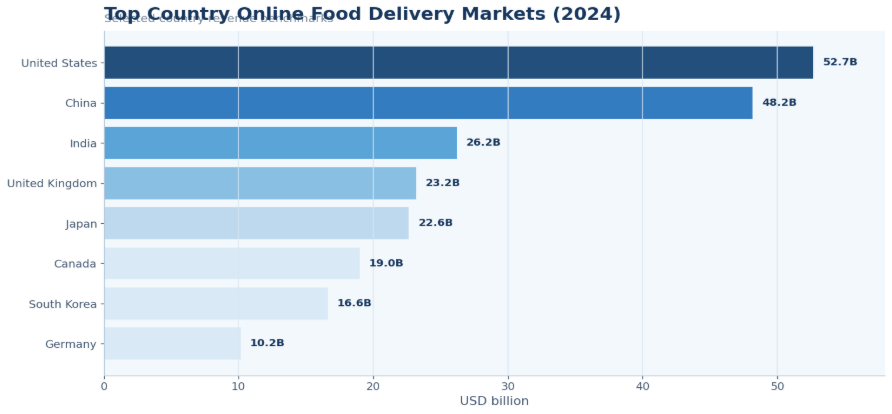
Figure 4. Country-level market values show why the largest opportunities are not evenly distributed across regions or business models.
Country readout
Country-level data keeps the market from looking evenly distributed. The largest markets combine high consumer spending, dense restaurant supply, strong app adoption, and reliable digital payment behavior. Smaller markets can still be attractive when growth is fast, urban concentration is high, and platforms can build order density without excessive courier incentives.
Platform and Company Benchmarks
Company-level statistics make the market more concrete. Platforms report different metrics, including gross order value, gross bookings, GMV, GTV, revenue, orders, adjusted EBITDA, and free cash flow. These numbers should not be treated as identical, but they show where scale, growth, and profitability are appearing.
Platform benchmarks worth comparing
• DoorDash total orders increased 19% year over year to 685 million in Q4 2024.
• DoorDash Marketplace GOV increased 21% year over year to USD 21.3 billion in Q4 2024.
• DoorDash revenue increased 25% year over year to USD 2.9 billion in Q4 2024.
• DoorDash total orders increased 20% year over year to 761 million in Q2 2025.
• DoorDash Marketplace GOV increased 23% year over year to USD 24.2 billion in Q2 2025.
• DoorDash revenue increased 25% year over year to USD 3.3 billion in Q2 2025.
• Uber Delivery adjusted EBITDA increased 53% year over year to USD 727 million in Q4 2024.
• Uber revenue reached USD 44.0 billion in 2024, up 18% year over year.
• Delivery Hero generated EUR 48.8 billion of GMV in FY 2024.
• Delivery Hero Total Segment Revenue reached EUR 12.8 billion in FY 2024, up 22% year over year.
• Just Eat Takeaway adjusted EBITDA improved to EUR 460 million in 2024.
• Deliveroo adjusted EBITDA increased 52% to GBP 129.6 million in 2024.
• Meituan revenue increased 22.4% year over year to CNY 93.58 billion in Q3 2024.
• Meituan core local commerce revenue rose 20.2% to CNY 69.37 billion in Q3 2024.
• Zomato reported consolidated net profit of INR 1.75 billion in the quarter ended March 31, 2024.
• Zomato’s core food delivery GOV grew 28% in the March 2024 quarter.
| Platform | Key metric to compare | Why it matters |
|---|---|---|
| DoorDash | Marketplace GOV, orders, net revenue margin, DashPass | U.S. marketplace scale and retention |
| Uber Delivery | Gross bookings, adjusted EBITDA, margin | multi-country delivery economics |
| Delivery Hero | GMV, Total Segment Revenue, adjusted EBITDA | global emerging-market exposure |
| Just Eat Takeaway | GTV, adjusted EBITDA, region trends | European marketplace position |
| Deliveroo | GTV, orders, Plus membership, adjusted EBITDA | premium urban delivery position |
| Meituan | Core local commerce revenue and market share | China delivery ecosystem scale |
| Zomato | Food delivery GOV, revenue, Blinkit GOV | India delivery and quick-commerce growth |
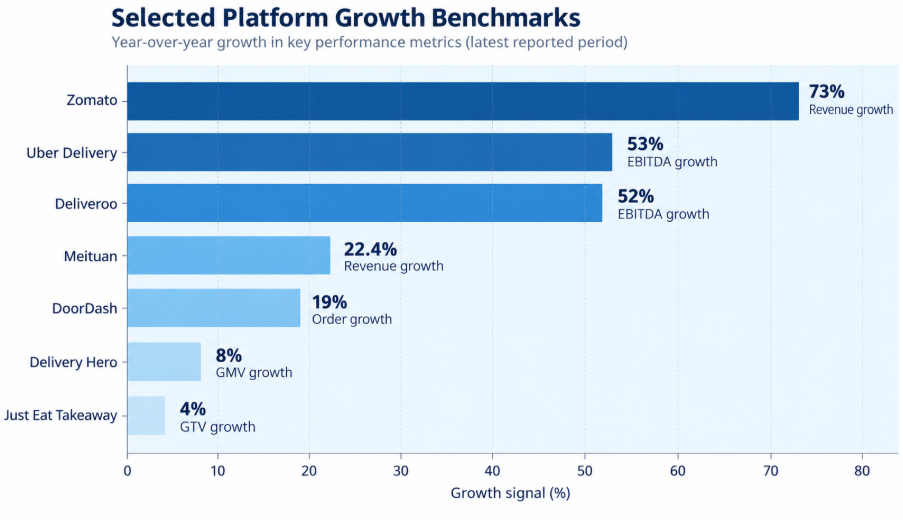
Figure 5. Platform benchmarks should be compared through order value, growth, subscriptions, and profitability because delivery scale does not always translate into margin.
Pricing, Promotions, and Retention Statistics
The strongest delivery markets balance convenience with price trust. Customers may accept higher menu prices and delivery fees when speed, accuracy, restaurant choice, and app reliability are strong. When the experience is inconsistent, the same fees feel like friction. That is why delivery pricing should be measured beside retention, refunds, late orders, subscription use, and repeat purchase.
Pricing and retention benchmarks worth separating
• Pickup remains an important comparison point because it keeps digital ordering behavior while reducing courier cost and delivery-time uncertainty.
• Repeat ordering is stronger when the app combines saved addresses, saved payment methods, reliable delivery tracking, accurate menus, and predictable arrival times.
• Promo-led growth should be separated from organic growth because discounts can make order volume look stronger than the underlying customer habit.
• Platform advertising and sponsored placements can increase restaurant visibility, but they also create another cost layer that restaurants must compare against incremental orders.
• Subscription programs such as Dash Pass, Uber One, Deliveroo Plus, and similar loyalty passes can raise order frequency when customers believe the saved delivery fees justify the monthly cost.
• A small basket is more sensitive to delivery fees because the fee becomes a larger share of the total order value.
• Delivery demand should be reviewed through average order value, delivery fee acceptance, service-fee visibility, promotion usage, subscription participation, and repeat order frequency.
Pricing interpretation
Pricing is one of the clearest links between delivery demand and delivery profitability. A consumer may order frequently when promotions are heavy, but the same customer may become less valuable if discounts, free-delivery credits, refunds, or delivery-fee waivers absorb too much contribution margin.
Online Food Delivery Market Challenges
The biggest delivery challenges are not only demand problems. They sit across pricing, restaurant margins, courier supply, labor regulation, service quality, customer retention, grocery fulfillment, and platform profitability.
• High delivery fees can reduce order conversion, especially when basket size is small.
• Restaurant commissions can weaken merchant profitability even when order volume rises.
• Courier supply shortages can increase delivery time, cancellation rates, and customer complaints.
• Labor regulation can raise operating costs or change the economics of courier networks.
• Food inflation can lift gross order value while reducing real consumer affordability.
• Menu-price inflation can make delivery feel expensive compared with pickup or dine-in.
• Customer discount dependency can inflate order volume without building profitable repeat behavior.
• Refunds and complaints can reduce both restaurant margin and platform margin.
• Packaging waste and sustainability pressure can increase compliance and operating costs.
• Grocery delivery adds substitution, cold-chain, picking, inventory, and last-mile complexity.
| Challenge | Core signal to measure | Likely owner |
|---|---|---|
| Delivery fee sensitivity | Cart abandonment, average order value, promo usage | Platform growth and pricing teams |
| Restaurant margin pressure | Commission rate, net margin, order profitability | Restaurant and marketplace teams |
| Courier supply | Delivery time, cancellations, courier utilization | Operations teams |
| Regulation | Labor cost, commission caps, compliance cost | Legal and policy teams |
| Customer retention | Repeat rate, subscription usage, churn | CRM and product teams |
| Food quality | Refunds, ratings, complaints | Restaurant and operations teams |
Risk interpretation
Delivery platforms can grow and still face pressure if fees, refunds, courier costs, or restaurant churn rise at the same time. The strongest scorecard reviews order growth, retention, delivery time, refund rate, take rate, merchant profitability, and adjusted EBITDA together.
Online Food Delivery Revenue Opportunity Diagnostic
A useful delivery benchmark connects each statistic to a business question. The goal is to find where demand is growing, which model works, which markets are profitable, which customers repeat, and where logistics or fees are leaking margin.
| Opportunity area | Core signals to measure | Useful benchmark angle |
|---|---|---|
| Market expansion | Country growth, user penetration, order frequency | Emerging-market and dense-city demand |
| Restaurant marketplace | Merchant count, order volume, take rate | Platform depth and monetization |
| Grocery delivery | Basket size, repeat rate, fulfillment cost | Higher-value recurring demand |
| Convenience delivery | Delivery speed, local inventory, order density | Fast small-basket demand |
| Subscription | Order frequency, retention, churn | Loyalty and habit formation |
| Advertising | Sponsored listings, merchant spend, conversion | Marketplace monetization |
| Logistics | Delivery time, utilization, batch rate | Unit economics and service quality |
Diagnostic principle
This model keeps delivery statistics from becoming a stat dump. Each metric should answer whether a market is growing, whether orders are profitable, whether customers are repeating, and whether logistics quality is strong enough to support the growth.
90-Day Online Food Delivery Benchmark Plan
Delivery statistics become useful when they are translated into a measurement cycle. A practical review can be organized around demand, economics, and service quality.
| Timing | What to do | Output |
|---|---|---|
| Days 1-30 | Capture the baseline by country, city, category, app channel, restaurant type, order value, delivery time, and payment method. | A clear map of where demand and delivery performance are strongest. |
| Days 31-60 | Review delivery fees, promotions, restaurant commissions, courier availability, subscription behavior, and grocery baskets. | A prioritized list of high-confidence growth and margin opportunities. |
| Days 61-90 | Compare retention, logistics cost, refund rate, delivery quality, advertising revenue, and platform profitability. | A repeatable scorecard for profitable delivery growth. |
Planning principle
The strongest delivery teams do not chase every order. They compare demand growth against delivery cost, restaurant margin, customer retention, and country-level economics.
Metrics Online Food Delivery Leaders Should Track
A delivery dashboard should be detailed enough to locate the leak without becoming a vanity scoreboard. The minimum useful set combines demand, economics, logistics, restaurant health, and customer retention.
| Metric | Why it matters |
|---|---|
| Gross order value | total marketplace demand before platform deductions. |
| Order volume | usage frequency and demand depth. |
| Average order value | basket strength and fee tolerance. |
| Active users | Measures platform reach and market depth. |
| Monthly transacting users | paying customer engagement. |
| Merchant count | restaurant and store supply. |
| Take rate | platform monetization. |
| Delivery time | Measures service quality. |
| Courier utilization | logistics efficiency. |
| Refund rate | quality and fulfillment problems. |
| Subscription users | Measures loyalty and retention. |
| Repeat order rate | Shows habit formation. |
| Promo dependency | whether demand is profitable. |
| Restaurant margin | sustainability for merchants. |
| Adjusted EBITDA | platform profitability after operating costs. |
Online Food Delivery Market Statistics FAQ
Common questions
• What is the size of the global online food delivery market?
Global online food delivery revenue is estimated at USD 288.84 billion in 2024 and projected to reach USD 505.50 billion by 2030 in the Grand View Research horizon series.
• Which delivery model is largest?
Platform-to-consumer delivery is the largest model in the type split, accounting for more than 71% of global online food delivery type revenue in 2024.
• How fast is the market expected to grow?
The 2024-2030 global series implies a 9.78% CAGR, while the wider services-market series implies an 8.43% CAGR over the same period.
• Which countries are major online food delivery markets?
The United States, China, India, the United Kingdom, Japan, Canada, South Korea, Germany, Australia, France, Brazil, Saudi Arabia, the UAE, Mexico, and Argentina are important country examples for online food delivery benchmarking.
• How is grocery delivery changing the market?
Grocery delivery increases the role of larger baskets, recurring household demand, substitutions, inventory accuracy, and fulfillment cost. Statista projects grocery delivery market volume at USD 1.04 trillion in 2026.
• Which platforms are important in online food delivery?
DoorDash, Uber Delivery, Delivery Hero, Just Eat Takeaway, Deliveroo, Meituan, Zomato, and quick-commerce services such as Blink it are important platform benchmarks.
• What are the biggest challenges in online food delivery?
The biggest challenges include delivery fees, restaurant commissions, driver costs, labor regulation, food quality, refunds, customer retention, promotion dependency, and platform profitability.
• Which metrics matter most?
The most useful metrics include gross order value, order volume, average order value, active users, merchant count, take rate, delivery time, refund rate, subscription users, repeat order rate, restaurant margin, and adjusted EBITDA.
• Why do delivery platforms track gross order value and profitability separately?
Gross order value shows the total value moving through the marketplace, while profitability shows what remains after courier costs, promotions, refunds, restaurant incentives, payment processing, support, and operating expenses. Both are needed because a fast-growing delivery market can still have weak economics if growth depends too heavily on discounts or inefficient delivery routes.
Final Takeaway
Online food delivery performance depends on several systems working together: consumer demand, restaurant supply, app experience, courier logistics, digital payment, pricing, and retention. The statistics show that the market is large, but its economics vary sharply by category, country, and delivery model.
The most useful analysis separates demand from profitability. More orders do not always mean stronger economics if delivery fees, restaurant commissions, discounts, refunds, and courier costs rise at the same time. A strong scorecard measures gross order value, order volume, average order value, delivery time, refund rate, take rate, and adjusted EBITDA together.
For platforms, restaurants, grocery retailers, and investors, the practical goal is to measure online food delivery by country, category, order value, customer frequency, service quality, and margin. The strongest opportunities appear where dense demand, strong merchant supply, fast delivery, recurring orders, and controlled logistics costs align.