Sodium-ion batteries are no longer only a chemistry-side discussion. They are becoming a storage, supply-chain, and cost-control market because grid operators, battery buyers, data centers, automakers, and industrial users are looking for alternatives to lithium-heavy systems.
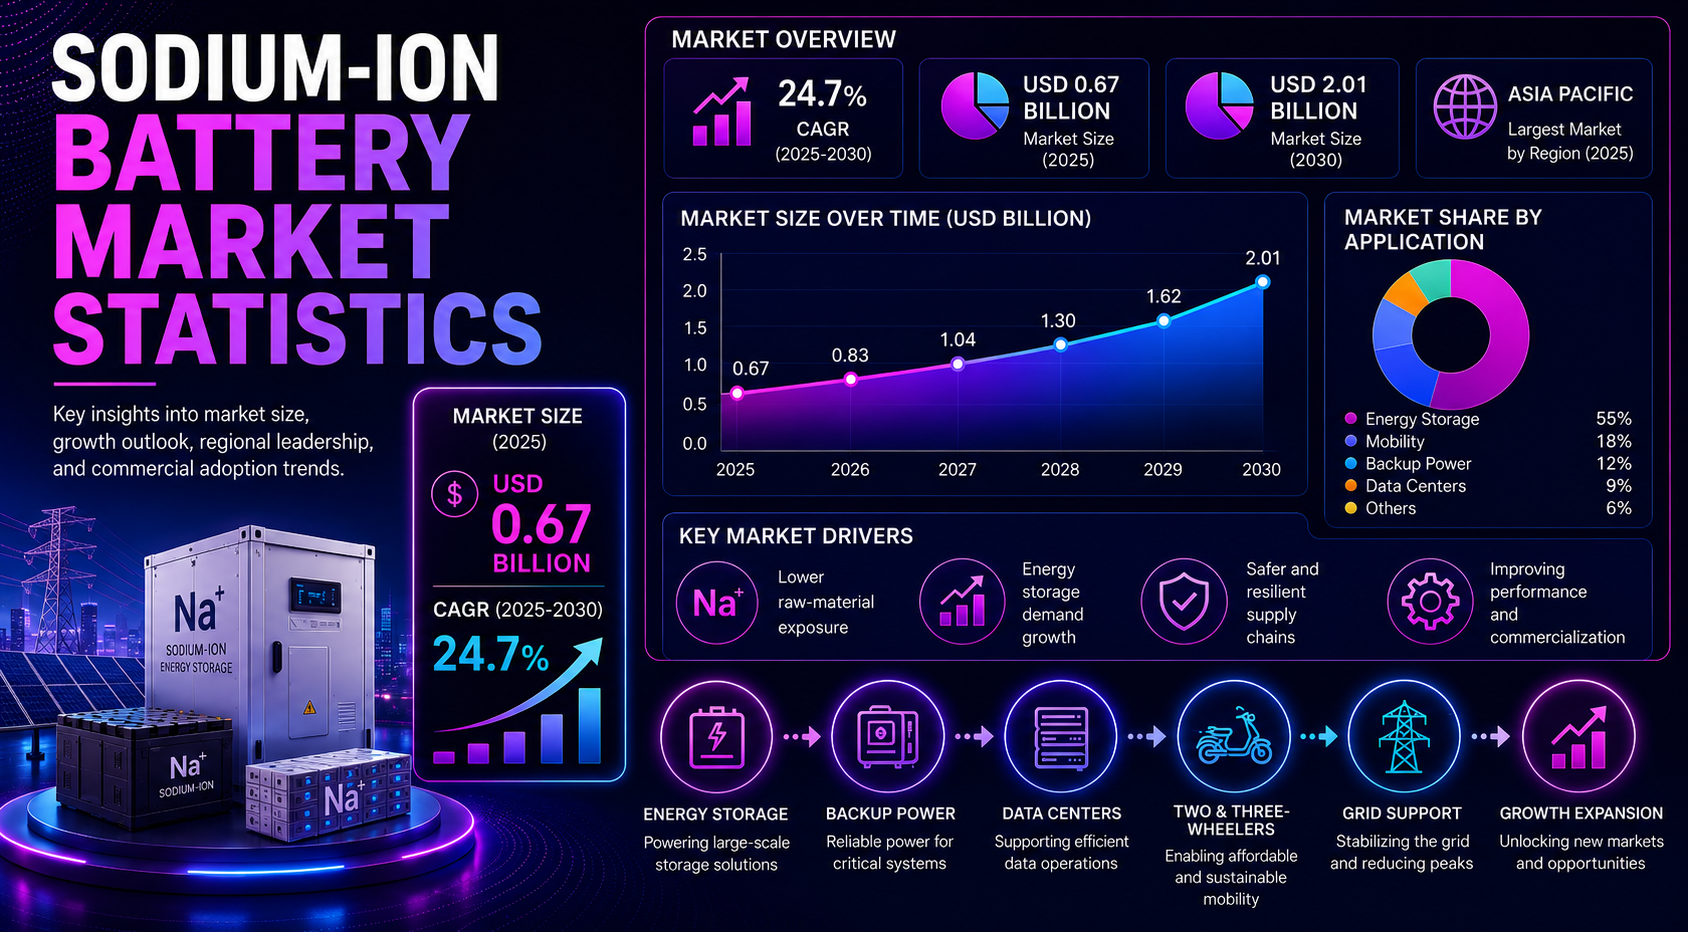
The headline numbers show why the category deserves its own scorecard. Market forecasts place the 2025 market between USD 0.67 billion and USD 1.83 billion, production capacity could move from 70 GWh/year in 2025 to nearly 400 GWh/year by 2030, and current commercial cell density sits around 160-175 Wh/kg.
Executive Sodium-Ion Battery Benchmarks
These are the statistics that frame the sodium-ion battery market. They show the forecast range, capacity scale, energy-density position, and application fit that separate commercial momentum from early chemistry hype.
The numbers that define the sodium-ion shift
• Across collected market outlooks, reported sodium-ion growth ranges from 16.3% CAGR to 30.0% CAGR, showing a high-growth but still early commercial market.
• The MarketsandMarkets path places the market at USD 0.67 billion in 2025 and USD 2.01 billion by 2030.
• Fortune Business Insights reports USD 1.83 billion in 2025 and projects USD 7.08 billion by 2034.
• Global sodium-ion production capacity could rise from 70 GWh/year in 2025 to nearly 400 GWh/year by 2030.
• Commercial sodium-ion cell disclosures and IEA commentary place practical cell density around 160-175 Wh/kg.
• Energy storage is expected to be the leading application with about 55.0% share, while sodium-ion cells are expected to account for about 48.0% of the product segment.
| Metric | Latest value | Market meaning |
|---|---|---|
| Reported 2025 market value | USD 0.67B to USD 1.83B | Forecasts vary because commercialization is still moving from pilot to scale. |
| 2030/2034 outlook | USD 2.01B by 2030; USD 7.08B by 2034 | The market can expand quickly if storage and mobility shipments rise. |
| CAGR range | 16.3% to 30.0% | Growth outlook is strong across conservative and aggressive paths. |
| Capacity signal | 70 to 400 GWh/year by 2025-2030 | Manufacturing scale is the key adoption gate. |
| Cell density | 160-175 Wh/kg | Best fit is cost-sensitive storage and entry mobility. |
| Application leader | Energy storage at about 55.0% | Stationary storage is the strongest early demand channel. |
Executive readout
Sodium-ion batteries are not positioned as a direct replacement for every lithium-ion use case. Their strongest statistical case is in applications where cost, supply security, safety, and low-temperature performance matter more than premium energy density.
Sodium-Ion Battery Market Size and Forecast
The core market story is a fast-growing forecast range, not one fixed number. Published outlooks place sodium-ion batteries between USD 0.67B and USD 1.83B in 2025, with longer-term scenarios reaching USD 2.01B by 2030 or USD 7.08B by 2034.
Conservative paths are still important because they show how the market may develop if commercial shipments scale more gradually.
Mordor Intelligence estimates USD 0.54B in 2026 and USD 1.19B by 2031, while Research Insights reports USD 369.69M in 2024 and USD 914.67M by 2030.
The spread signals a young market where one large storage contract, EV pilot, or localization program can shift the curve.
| Forecast path | Base value | Target value | CAGR / signal |
|---|---|---|---|
| MarketsandMarkets | USD 0.67B in 2025 | USD 2.01B by 2030 | 24.7% CAGR |
| Fortune Business Insights | USD 1.83B in 2025 | USD 7.08B by 2034 | Scale case |
| Mordor Intelligence | USD 0.54B in 2026 | USD 1.19B by 2031 | 16.89% CAGR |
| Research Insights | USD 369.69M in 2024 | USD 914.67M by 2030 | 16.3% CAGR |
| Battery materials outlook | USD 2.7B in 2025 | USD 28.8B by 2034 | 30.0% CAGR |
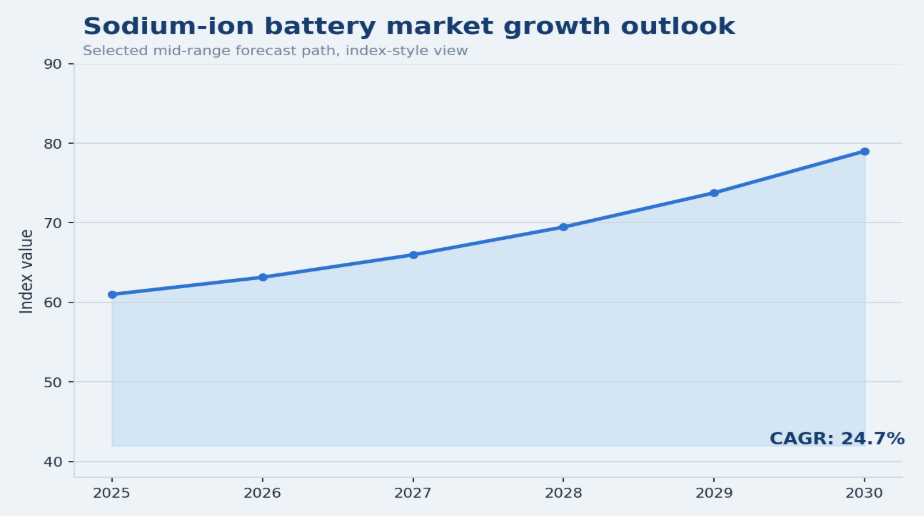
Figure 1. Sodium-ion battery market growth should be reviewed beside production scale because capacity will decide how quickly forecasts convert into commercial shipments.
Market sizing readout
Forecasts differ because sodium-ion batteries remain an emerging category. The important market signal is that conservative, mid-range, and aggressive scenarios all point toward double-digit expansion.
Why Sodium-Ion Batteries Are Becoming a Market Priority
Sodium-ion batteries are becoming a market priority because buyers want lower raw-material exposure, safer storage options, and more predictable supply chains.
Lithium-ion remains the dominant battery platform, but sodium-ion reduces reliance on lithium, nickel, and cobalt while keeping the chemistry useful for storage, backup power, and cost-sensitive mobility.
The strongest adoption signal is not premium EV range. It is the shift toward applications where cost, safety, cycle life, cold-weather performance, and procurement certainty can matter more than maximum energy density.
Market drivers worth separating
• The best-fit markets are grid storage, telecom backup, UPS systems, data centers, two-wheelers, and low-cost mobility.
• Sodium-ion density is about 85.4% of the LFP upper reference level and about 68.6% of the NMC upper reference level.
• NMC cells reach up to 255 Wh/kg, which keeps premium long-range EVs harder for sodium-ion in the near term.
• LFP cells reach up to 205 Wh/kg, so sodium-ion is now closer to mainstream storage chemistry than earlier generations.
• Latest sodium-ion cells reach about 175 Wh/kg, giving the chemistry enough density for many stationary and short-range uses.
| Market driver | Sodium-ion signal | Why it matters |
|---|---|---|
| Raw material availability | Sodium is widely available | Improves supply-chain resilience. |
| Lithium price exposure | Lower direct dependence on lithium | Helps reduce volatility risk. |
| Cobalt and nickel exposure | Many designs avoid both materials | Supports ethical and lower-risk sourcing. |
| Stationary storage growth | Energy storage expected near 55.0% share | Creates demand where size is less limiting. |
| Cold-weather performance | CATL reported strong low-temperature behavior | Supports mobility and backup use in cold climates. |
| Fast charging potential | CATL reported 80% SOC in 15 minutes | Raises interest in mobility and power applications. |
Priority readout
Sodium-ion batteries are gaining attention because the battery market is no longer only about range. As storage and grid-support demand grows, buyers are giving more weight to cost stability, safety, and material availability.
Technology and Performance Benchmarks
Sodium-ion technology should be read as a fit-for-purpose benchmark, not a premium-EV replacement story.
The chemistry is gaining attention because it can serve storage, backup power, two-wheelers, and entry mobility where cost, safety, and supply certainty matter as much as maximum range.
Performance benchmarks
• CATL reported first-generation sodium-ion cell density up to 160 Wh/kg.
• Later disclosures and IEA commentary place practical sodium-ion density around 175 Wh/kg.
• LFP reaches up to 205 Wh/kg and NMC reaches up to 255 Wh/kg at the upper reference level.
• At 175 Wh/kg, sodium-ion reaches about 85.4% of the LFP upper level and 68.6% of the NMC upper level.
• CATL reported charging to 80% SOC in 15 minutes, while Reuters tied the Naxtra 175 Wh/kg battery to December 2025 mass-production scheduling.
| Performance metric | Sodium-ion benchmark | Market meaning |
|---|---|---|
| Cell energy density | 160–175 Wh/kg | Suitable for storage, backup power, and short-range mobility. |
| LFP comparison | Up to 205 Wh/kg | Sodium-ion remains below LFP but close enough for selected uses. |
| NMC comparison | Up to 255 Wh/kg | Premium long-range EVs remain harder to target near term. |
| Fast-charge signal | 80% SOC in 15 minutes | Commercial claims support manufacturable battery positioning. |
| Production signal | December 2025 scheduling | Mass-production timelines are becoming part of the market story. |
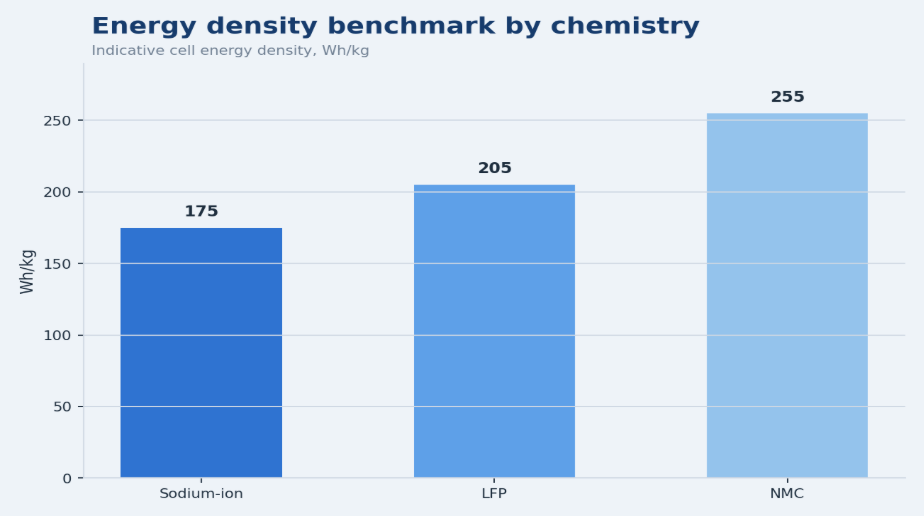
Figure 2. Sodium-ion energy density remains below LFP and NMC, but the gap is small enough for storage, backup power, and cost-sensitive mobility use cases.
Technology readout
Sodium-ion batteries should be evaluated by application fit, not by premium EV benchmarks alone. Their market strength improves when the customer values cost, temperature tolerance, and material security over maximum pack compactness.
Application Statistics: Storage, Mobility, Backup Power, and Data Centers
Application statistics show sodium-ion adoption is likely to begin where lower cost, safety, and supply certainty matter more than maximum energy density.
Stationary storage, backup power, telecom, data centers, and short-range mobility are the clearest early targets.
Application benchmarks
• Energy storage is expected to remain the leading application with about 55.0% share in 2026.
• Sodium-ion cells are anticipated to represent about 48.0% of the product segment in 2026.
• Ambient-temperature sodium-ion batteries held 77.4% material-market share in 2024 and are on a 29.4% CAGR path.
• Automotive sodium-ion demand rises from USD 193.2 million in 2026 to USD 375.8 million in 2030 and USD 619.1 million by 2033.
• The CATL-Hyper Strong storage signal reaches 60 GWh scale, confirming that large stationary systems are a major early-use case.
| Application | Key statistic | Market fit |
|---|---|---|
| Energy storage | About 55.0% share in 2026 | Strongest early adoption area. |
| Sodium-ion cells | About 48.0% product share in 2026 | Core commercial format. |
| Ambient-temperature batteries | 77.4% share in 2024; 29.4% CAGR path | Mainstream operating-temperature signal. |
| Automotive sodium-ion | USD 193.2M in 2026 to USD 375.8M in 2030 | Selective short-range mobility growth. |
| Energy storage deal signal | 60 GWh CATL-Hyper Strong scale | Large stationary-storage validation. |
| Data centers / EV charging | Initial target segments | Backup, reliability, and power-support use. |
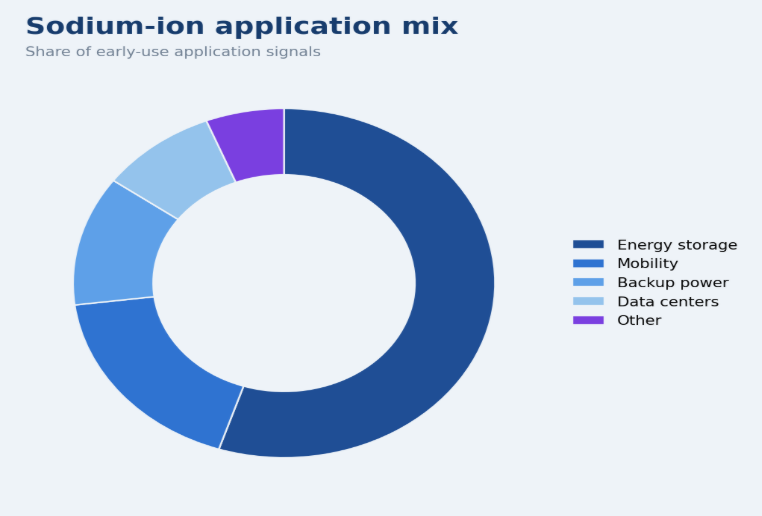
Figure 3. Sodium-ion application demand is strongest where cost, safety, supply certainty, and adequate energy density matter more than premium range.
Application readout
The fastest path to scale is not one single end market. Sodium-ion adoption is likely to come from a portfolio of storage, backup, industrial, and cost-sensitive mobility applications.
Regional Sodium-Ion Battery Market Statistics
Regional data shows that Asia Pacific is the center of sodium-ion commercialization.
Regional benchmarks
- Fortune Business Insights reports Asia Pacific at 60.22% of the global sodium-ion battery market in 2025 and USD 1.1 billion in regional revenue.
- The same source projects Asia Pacific at USD 1.37 billion in 2026.
- Credence Research also says Asia Pacific dominated regional demand with roughly 36% share in 2024, showing that the region leads even when different methodologies are used.
- China explains much of that leadership. China has a manufacturing base, cell suppliers, EV platforms, energy storage demand, and policy alignment around battery localization.
- China’s sodium-ion market capacity path indicates about 10.0 GWh in 2025, 14.5 GWh in 2026, 21.2 GWh in 2027, 30.8 GWh in 2028, 44.8 GWh in 2029, and 65.2 GWh in 2030.
- By 2034, the same path reaches 292.0 GWh.
- North America is smaller today but strategically important.
- One regional share path places North America at 26.2% in 2025, which signals a meaningful opportunity if the region uses sodium-ion batteries for grid storage, data centers, industrial backup.
- Battery supply-chain diversification is part of the same regional opportunity because buyers want alternatives to concentrated lithium-ion supply chains.
- The United States is especially important because it combines large power demand, data-center growth, renewable integration, and domestic manufacturing goals.
- Europe is more likely to grow through energy-security policy, industrial storage, and battery supply-chain diversification.
- Germany, the United Kingdom, France, and the Netherlands have strong storage and grid-balancing needs, even if commercial sodium-ion deployment is still less mature than in China.
- Latin America, the Middle East, Africa, and Australia are future storage markets because renewable integration and grid resilience create demand for lower-cost stationary systems.
| Region | Key statistic | Market interpretation |
|---|---|---|
| Asia Pacific | 60.22% global share in 2025 | Commercialization leader. |
| Asia Pacific | USD 1.1B revenue in 2025 | Largest regional revenue pool. |
| China | 65.2 GWh capacity path by 2030 | Main country-level scale engine. |
| China | 292.0 GWh capacity path by 2034 | Long-term manufacturing dominance signal. |
| North America | 26.2% share path in 2025 | Large grid-storage and data-center opportunity. |
| Europe | Battery localization and storage demand | Emerging but strategically important. |
| Australia | Renewable-heavy grid context | Future storage opportunity. |
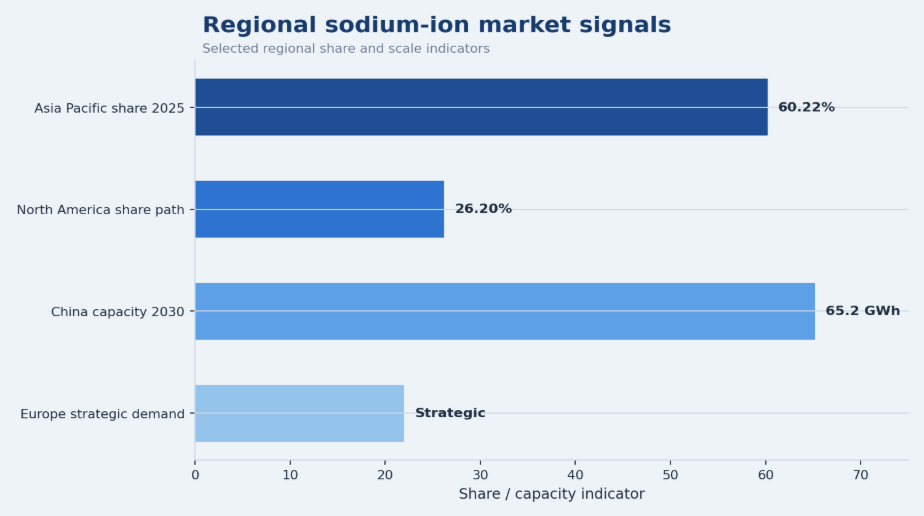
Figure 4. Regional sodium-ion demand is led by Asia Pacific and China, while North America and Europe add storage and localization opportunities.
Regional readout
Asia Pacific leads because sodium-ion commercialization is tied to manufacturing scale. Other regions can still become strong demand centers if grid storage and domestic battery strategies accelerate.
Country-Level Sodium-Ion Battery Market Statistics
Country-level sodium-ion battery statistics show a China-led production path, while demand signals are spreading across storage, mobility, backup power, and grid-flexibility markets.
Country signals worth tracking
• China: capacity rises from 10.0 GWh in 2025 to 65.2 GWh in 2030 and 292.0 GWh by 2034.
• China share signal: projected sodium-ion capacity equals about 14.3% of the global path in 2025 and moves toward 16.3% by 2030.
• United States: stationary storage, data centers, EV charging, and grid resilience make it a high-value demand market.
• India: two-wheelers, three-wheelers, renewable storage, and backup power make sodium-ion a strong cost-sensitive fit.
• Europe: Germany and the United Kingdom are tied to renewable integration, grid balancing, and industrial energy security.
• Asia-Pacific signals: Japan and South Korea add R&D and materials depth, while Australia offers a renewable-heavy storage market.
| Country | Demand driver | Sodium-ion opportunity | Maturity signal |
|---|---|---|---|
| China | Manufacturing; storage scale | 10.0 GWh in 2025 to 292.0 GWh by 2034 | Highest commercialization |
| United States | Grid storage; data centers | Storage, backup, supply-chain diversification | High demand potential |
| India | Cost-sensitive mobility; renewables | Two-wheelers, backup power, storage | Strong local-fit market |
| Germany | Energy transition; industrial storage | Stationary storage; localization | Strategic EU market |
| United Kingdom | Grid balancing; renewables | Storage and backup power | Emerging opportunity |
| Japan | Battery R&D; backup systems | Technology development | Research-led signal |
| South Korea | Battery manufacturing | Chemistry diversification | Potential producer role |
| Australia | Renewable-heavy grid | Stationary storage; grid flexibility | Practical storage market |
Country readout
Country-level sodium-ion adoption should be ranked by capacity plans, grid-storage need, localization policy, and mobility fit—not only by current revenue.
Manufacturing Capacity, Supply Chain, and Company Statistics
Manufacturing capacity is the biggest bridge between sodium-ion promise and market revenue.
IRENA/BMI indicates global sodium-ion production capacity could reach up to 70 GWh/year in 2025 and nearly 400 GWh/year by 2030.
The path between those points implies 99.2 GWh/year in 2026, 140.6 GWh/year in 2027, 199.2 GWh/year in 2028, and 282.3 GWh/year in 2029.
This is the capacity curve investors should watch because market value cannot scale without production availability.
400 GWh/year sodium-ion capacity base would equal about 9.3% of IRENA’s 4,300 GWh/year 2030 EV battery-demand scenario.
At the 2025 capacity level of 70 GWh/year, sodium-ion would equal about 1.63% of that same 2030 EV battery-demand benchmark.
Relative numbers show that sodium-ion can become meaningful without overtaking lithium-ion. Even a single-digit share of global battery demand can create a large market.
Company and capacity signals
• Company signals are also becoming more concrete. CATL reported first-generation sodium-ion performance and later NextEra sodium-ion metrics.
• Reuters reported the NextEra density at 175 Wh/kg and a December 2025 mass-production schedule.
• BYD is reported by IEA as investing in sodium-ion battery production for electric vehicles, battery storage, and industry.
• HiNa Battery, Farad ion, Natron Energy, Tiamat, and other developers add regional diversity to the commercialization landscape.
• CATL-Hyper Strong sodium-ion storage signal is especially important because it ties the chemistry to energy storage at 60 GWh scale.
• Large storage agreements can move sodium-ion from product announcement to market validation more quickly than small pilot vehicles.
• The supply-chain question is whether hard carbon anode material, cathode materials, electrolytes, and cell assembly can scale while keeping the cost advantage intact.
| Company / ecosystem | Country or region | Market signal | Likely application |
|---|---|---|---|
| CATL | China | 160 Wh/kg Gen1; 175 Wh/kg NextEra signal | EVs and storage. |
| BYD | China | Investment in sodium-ion production | EVs, battery storage, industry. |
| HiNa Battery | China | Commercial sodium-ion projects | Storage and mobility. |
| CATL-Hyper Strong | China | 60 GWh storage signal | Energy storage. |
| Natron Energy | United States | U.S. sodium-ion commercialization ecosystem | Data centers and industrial power. |
| Faradion | United Kingdom / India-linked ecosystem | Sodium-ion technology development | Mobility and storage. |
| Tiamat | Europe | European sodium-ion technology activity | Power and mobility niches. |
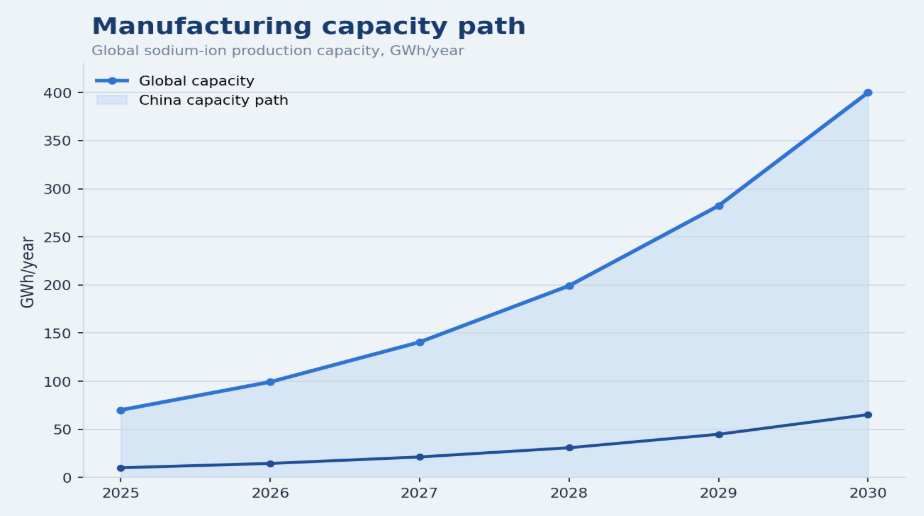
Figure 5. Sodium-ion production capacity is expected to rise from 70 GWh/year in 2025 to nearly 400 GWh/year by 2030, making qualified shipments the key signal to watch.
Manufacturing readout
The sodium-ion market will be capacity constrained until large plants, offtake contracts, and bankable field records mature. Capacity announcements are important, but shipments and qualified projects will decide the pace of revenue conversion.
Cost, Raw Materials, and Price Advantage Statistics
Sodium-ion cost advantage begins with material availability and supply-chain resilience.
Sodium is widely available, and many sodium-ion chemistries reduce or avoid lithium, cobalt, and nickel exposure.
That makes the chemistry most attractive where buyers prioritize cost stability, safety, and reliable sourcing over maximum energy density.
Cost and materials benchmarks
• The sodium-ion battery materials market was valued at USD 2.1 billion in 2024, showing that the opportunity extends beyond finished cells into cathodes, anodes, electrolytes, separators, binders, and manufacturing inputs.
• Material-market value is estimated at USD 2.7 billion in 2025, suggesting early supplier expansion as sodium-ion manufacturing lines move from pilot output toward commercial qualification.
• The materials market is projected to reach USD 28.8 billion by 2034, equal to roughly 30.0% CAGR during 2025-2034, if storage, backup power, and cost-sensitive mobility applications scale together.
• Cost advantage improves only when factory utilization, hard-carbon supply, cathode standardization, pack integration, and customer qualification mature together.
| Cost factor | Sodium-ion signal | Market meaning |
|---|---|---|
| Material availability | Sodium is widely available and less geographically constrained. | Lower exposure to lithium supply volatility. |
| Cobalt and nickel exposure | Many sodium-ion designs reduce or avoid cobalt and nickel. | Improves sourcing resilience and ESG positioning. |
| Manufacturing scale | Early costs remain higher until utilization and yield improve. | Commercial scale is needed before full price advantage appears. |
| Hard-carbon supply | Anode supply must expand with cell production. | A key bottleneck for reliable sodium-ion scale-up. |
| Storage economics | Cost per cycle and installed kWh matter more than peak energy density. | Stationary storage is the strongest early price-fit market. |
Cost readout
Sodium-ion’s strongest price advantage is lower exposure to lithium, nickel, and cobalt volatility. The benefit becomes clearer as factories scale, suppliers mature, and storage buyers compare lifetime cost rather than only headline cell price.
Adoption Barriers and Market Risks
The first adoption barrier is energy density. Sodium-ion cells at 160-175 Wh/kg are useful, but they do not match NMC at up to 255 Wh/kg or LFP at up to 205 Wh/kg.
That means sodium-ion must compete where size and weight are less restrictive or where cost and safety carry more value.
Premium long-range EVs remain difficult in the short term.
Second barrier is bankability. Grid-storage buyers, utilities, insurers, lenders, and industrial customers need performance records before they finance large deployments.
Cycle life, degradation rate, thermal behavior, warranty terms, and real operating data will matter as much as chemistry claims.
60 GWh storage signal is meaningful, but broad adoption requires more field evidence across climates and duty cycles.
Third barrier is LFP competition. LFP batteries are already widely produced, increasingly cheap, and accepted across EV and storage markets.
If LFP prices keep falling, sodium-ion must prove a measurable advantage in raw-material stability, low-temperature performance, cycle economics, or supply-chain localization.
Otherwise, buyers may choose the established chemistry even if sodium-ion looks attractive on paper.
Fourth barrier is supplier maturity.
Sodium-ion needs reliable hard carbon production, cathode standardization, electrolyte compatibility, equipment tuning, safety certification, and pack-integration expertise.
These barriers are normal for a new battery category, but they can slow shipments even when market forecasts are strong.
| Barrier | Why it matters | Improvement path |
|---|---|---|
| Lower energy density | Limits premium long-range EV use | Focus on storage and short-range mobility. |
| Bankability data | Utilities require field performance records | Build multi-year project evidence. |
| LFP price pressure | Established chemistry keeps improving | Compete on lifecycle cost and supply stability. |
| Hard carbon supply | Anode scale affects cost and volume | Expand qualified supplier base. |
| Certification cycles | Customers need safety validation | Standardize testing and warranties. |
| Capacity-to-shipment gap | Plants do not equal sales | Track offtake and utilization. |
Risk readout
The main sodium-ion risk is not lack of interest. It is the gap between promising forecasts and qualified, high-volume commercial shipments.
Forecast Scenario Interpretation
Sodium-ion battery market should be read through multiple forecast scenarios because the category is still in a formation period.
Conservative scenario follows the USD 369.69 million to USD 914.67 million path through 2030 and assumes slower commercialization, limited qualified projects, and continued LFP price pressure.
Pathway still represents growth, but it treats sodium-ion as a specialized battery category rather than a broad storage and mobility platform.
Mid-range scenario follows the USD 0.67 billion in 2025 to USD 2.01 billion by 2030 path.
Scenario assumes that sodium-ion batteries win measurable storage and backup-power deployments while automotive adoption stays selective.
It is the most balanced case because it gives weight to capacity expansion without assuming that every announced GWh becomes immediate shipped volume.
An aggressive scenario is closer to the USD 1.83 billion in 2025 to USD 7.08 billion by 2034 path, supported by fast materials-market growth and regional commercialization.
Scenario assumes that energy storage, grid balancing, data centers, EV fast charging, and low-cost vehicles all pull demand at the same time.
It also assumes that manufacturing capacity utilization improves and that buyers become comfortable with sodium-ion warranties.
The scenario gap matters for strategy.
Manufacturers should avoid building plans around the highest revenue path unless they have offtake contracts, qualified customers, and verified supply for hard carbon and cathode materials.
Buyers should avoid ignoring sodium-ion just because conservative forecasts look small.
A chemistry with a 16.3% to 30.0% reported CAGR range can become strategically important even before it becomes the largest battery chemistry.
The best interpretation is that sodium-ion has a staged adoption curve. First comes stationary storage and backup power.
Data centers, EV fast-charging support, and industrial power can follow as qualification improves.
Cost-sensitive mobility and entry-level EV platforms become larger opportunities if cell density, pack integration, and warranty performance improve.
Staged view is closer to the market reality than assuming instant mass replacement of lithium-ion batteries.
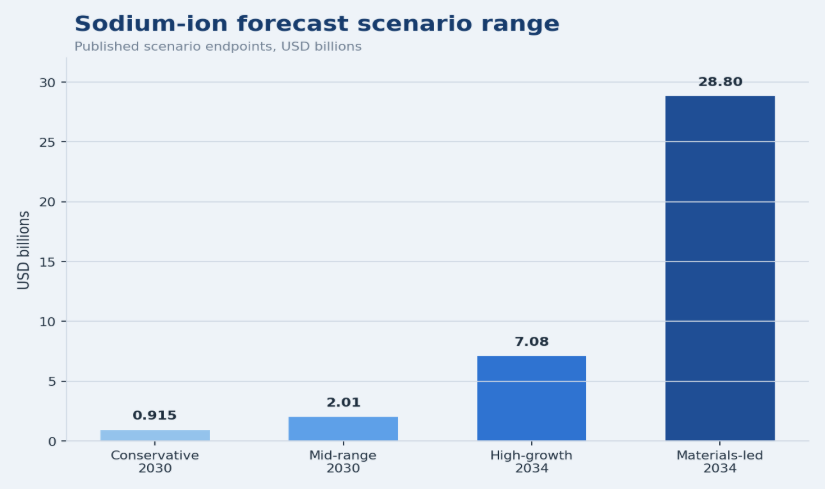
Figure 6. Sodium-ion battery forecasts should be read as a scenario range because shipments, utilization, and storage offtake can shift the market path quickly.
| Scenario | Market path | Commercial assumption | Strategy signal |
|---|---|---|---|
| Conservative | USD 369.69M in 2024 to USD 914.67M by 2030 | Sodium-ion stays specialized | Focus on proven storage niches. |
| Mid-range | USD 0.67B in 2025 to USD 2.01B by 2030 | Storage and backup power scale steadily | Track shipments and capacity use. |
| High-growth | USD 1.83B in 2025 to USD 7.08B by 2034 | Multiple applications adopt together | Monitor offtake contracts and bankability. |
| Materials-led | USD 2.7B in 2025 to USD 28.8B by 2034 | Upstream supply chain expands quickly | Watch hard carbon and cathode supply. |
Scenario readout
The most reliable sodium-ion forecast is not a single revenue number. It is a scenario range linked to qualified capacity, customer acceptance, and the speed at which storage deployments move from pilot to bankable projects.
Regional and Country Deep-Dive Market Notes
China should be treated as both a regional leader and a global pricing reference. A 10.0 GWh sodium-ion capacity path in 2025 is already meaningful for a chemistry that is still early. The same path reaching 65.2 GWh by 2030 and 292.0 GWh by 2034 would make China the most important country for cost curves, supply availability, and commercial proof.
If Chinese suppliers move quickly, global buyers may see sodium-ion prices fall before local manufacturing in other regions catches up.
The United States has a different profile.
It is less defined by sodium-ion cell-production dominance and more defined by storage demand, data-center electricity growth, utility reliability needs, and domestic battery-security policy.
If sodium-ion batteries can prove safety and cost-per-cycle advantages, the U.S. market could adopt the chemistry through stationary systems first.
North America share path of 26.2% in 2025 suggests that the region is already important in market models, even if China leads manufacturing.
India’s opportunity is tied to affordability.
Two-wheelers, three-wheelers, small commercial vehicles, distributed storage, telecom backup, and solar-linked storage all create use cases where sodium-ion’s lower material-risk profile can matter.
India does not need sodium-ion to match NMC performance for premium vehicles.
It needs batteries that can deliver acceptable range, durable cycling, safer supply, and manageable cost for high-volume applications.
Europe’s opportunity is tied to resilience, regulation, Germany, France, the United Kingdom, and the Netherlands.
The Netherlands may not be first in sodium-ion manufacturing scale, but it can be important in grid balancing, residential storage, commercial backup systems, and industrial decarbonization.
European buyers are sensitive to battery sourcing risk, recycling policy, and clean-technology supply chains, which can support interest in non-lithium chemistries.
Japan and South Korea are technology-signaling countries. Their battery ecosystems are strong in materials, manufacturing quality, safety testing, and cell engineering.
Even if their early sodium-ion markets are smaller, their R&D and supplier participation can influence global performance standards.
Australia, Chile, Saudi Arabia, South Africa, and Canada represent different types of storage demand: renewable integration, mining power, remote systems, grid resilience, or industrial backup.
Those countries help broaden sodium-ion beyond China-centered commercialization.
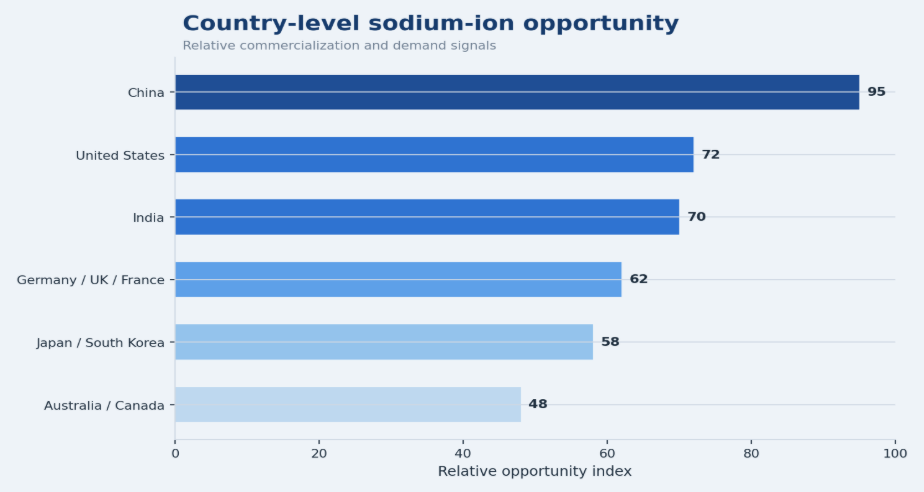
Figure 7. Regional sodium-ion signals show that China leads commercialization, while North America, India, and Europe add demand-side momentum.
| Country group | Primary driver | Why it matters for sodium-ion |
|---|---|---|
| China | Manufacturing scale and storage projects | Sets early cost curves and capacity availability. |
| United States | Grid storage, data centers, resilience | Can validate large stationary deployments. |
| India | Cost-sensitive mobility and backup power | Strong fit for affordable energy systems. |
| Germany / France / UK | Energy transition and localization | Supports non-lithium battery diversification. |
| Japan / South Korea | Materials and engineering expertise | Can improve quality and technology standards. |
| Australia / Chile / Canada | Renewables, mining, remote storage | Useful for storage and resilience applications. |
Country readout
The country map should be split into production leaders, demand centers, technology ecosystems, and future storage markets. Sodium-ion adoption will not look the same in China, the United States, India, or Europe.
Competitive Chemistry Positioning
Sodium-ion should be compared with LFP first, not only with high-nickel NMC.
LFP is the practical rival because it already serves energy storage, entry-level EVs, and cost-conscious battery packs.
Latest sodium-ion density of 175 Wh/kg is 30 Wh/kg below the LFP reference level of 205 Wh/kg, but that gap may be acceptable in stationary applications.
The question is whether sodium-ion can deliver lower material risk and stronger lifecycle economics than LFP.
NMC remains harder to challenge because the performance gap is larger.
Latest sodium-ion density is 80 Wh/kg below the NMC reference level of 255 Wh/kg and reaches about 68.6% of NMC’s upper reference density.
That gap matters in premium EVs, aviation-adjacent concepts, and other compact high-energy systems.
For that reason, sodium-ion market forecasts should not assume broad NMC displacement in the near term.
Lead-acid and other legacy backup technologies are also relevant comparisons.
Sodium-ion can compete in backup power and UPS applications if it offers better cycle life, faster charging, safety, and maintenance economics.
In these markets, the comparison is not only sodium-ion versus lithium-ion.
It can also be sodium-ion versus older technologies that are heavier, less efficient, or harder to manage over time.
Competitive positioning is therefore layered. Sodium-ion can be lower-density than lithium-ion and still win in the right market.
It can be more expensive in early production and still become attractive if material-price volatility makes lithium-ion less predictable.
It can be regionally concentrated today and still become a localization opportunity for countries that want non-lithium battery options.
| Chemistry comparison | Sodium-ion position | Best interpretation |
|---|---|---|
| Sodium-ion vs LFP | 175 Wh/kg vs 205 Wh/kg upper reference | Close enough for storage and low-cost mobility. |
| Sodium-ion vs NMC | 175 Wh/kg vs 255 Wh/kg upper reference | Premium EVs remain difficult. |
| Sodium-ion vs lead-acid | Higher modern-battery potential | Backup and UPS opportunities. |
| Sodium-ion vs flow batteries | More cell-manufacturing compatible | Competes in selected storage durations. |
| Sodium-ion vs lithium-ion supply chain | Lower lithium/cobalt/nickel exposure | Strategic material advantage. |
Chemistry readout
Sodium-ion does not need to beat every chemistry on every metric. It needs to beat the incumbent option in specific use cases where cost, safety, supply certainty, and adequate energy density are enough.
Procurement and Deployment Signals to Watch
Procurement teams should track sodium-ion through confirmed project signals rather than announcements alone.
A cell maker announcing capacity is a starting point, not a demand guarantee.
Stronger evidence includes signed storage deals, qualified supplier status, warranty-backed pack systems, repeat orders, and bankable operating data.
60 GWh CATL-Hyper Strong storage signal is important because it connects sodium-ion to a specific large storage application, not just to a future production target.
Deployment signals should also be measured by application.
In grid storage, watch tender participation, cost per cycle, thermal safety, permitting acceptance, and project-finance treatment.
In data centers, watch backup-power qualification, response time, safety certification, and maintenance cost.
In mobility, watch pack density, low-temperature performance, charging behavior, vehicle range, and after-sales warranty data.
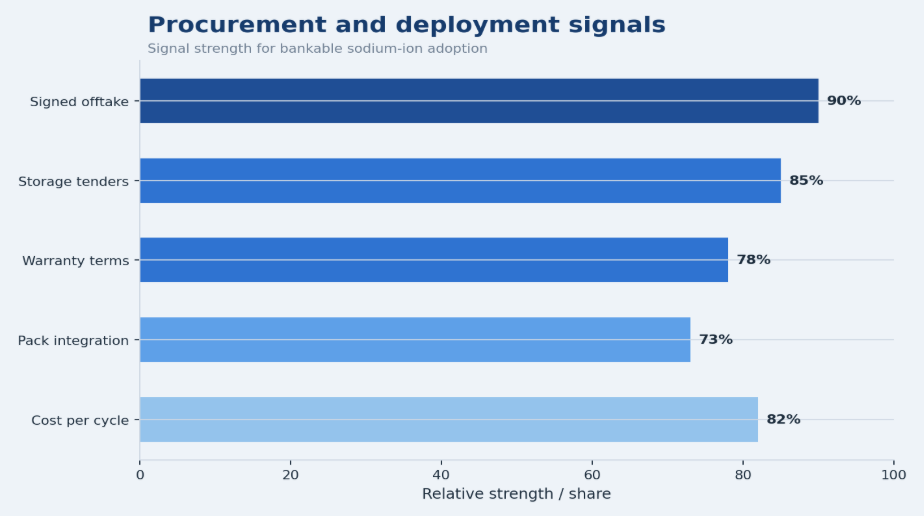
Figure 8. Procurement and deployment signals should be tracked together because bankability depends on supplier readiness, safety validation, and field data.
| Deployment signal | What to watch | Why it matters |
|---|---|---|
| Signed offtake | Binding contracts and repeat buyers | Confirms demand beyond pilots. |
| Storage tenders | Qualification and bid competitiveness | Shows grid-market acceptance. |
| Warranty terms | Cycle life and degradation promises | Improves bankability. |
| Pack integration | Safety, BMS, thermal behavior | Determines customer confidence. |
| Supplier utilization | Actual production vs announced capacity | Shows whether capacity is monetized. |
| Cost per cycle | Lifecycle economics | Best metric for storage decisions. |
Deployment readout
The next phase of sodium-ion market growth will be proven through deployment quality. Bankable projects, not only capacity announcements, will decide whether forecasts convert into revenue.
Materials Market and Upstream Supply Signals
- The upstream materials market gives an important second lens on sodium-ion growth. Finished battery revenue can stay modest while materials demand begins to prepare for scale.
- Global Market Insights reports the sodium-ion battery material market at USD 2.1 billion in 2024 and USD 2.7 billion in 2025, with a path to USD 28.8 billion by 2034.
- Implied 30.0% CAGR indicates that suppliers expect cathode, anode, electrolyte, separator, and processing demand to grow faster than many finished-cell revenue estimates.
- The materials signal is useful because sodium-ion batteries require a different cost stack than lithium-ion batteries.
- Hard carbon anodes, sodium-based cathode families, electrolyte optimization, and cell-format choices can all affect price and performance.
- If hard carbon supply is limited, sodium-ion cells may not achieve their expected cost advantage quickly.
- If cathode materials standardize and multiple suppliers qualify, the chemistry can become easier to scale across storage and mobility applications.
- Materials market also shows why sodium-ion is a supply-chain strategy, not just a cell technology.
- Sodium-ion buyers are not only buying energy density.
- They are buying lower exposure to lithium volatility, lower dependence on cobalt and nickel, and the option to build regional battery supply chains with a broader raw-material base.
- That advantage becomes more valuable when countries want battery localization and customers want long-term pricing visibility.
- Upstream indicators should therefore be included in every sodium-ion market dashboard.
- Leaders should track hard carbon capacity, cathode supplier count, electrolyte qualification, separator compatibility, pack safety testing, recycling pathways, and manufacturing yield.
- These details can determine whether a 70 GWh/year or 400 GWh/year capacity path becomes real commercial supply or remains a planning target.
- The strongest upstream signal will be supplier diversity. A sodium-ion ecosystem with only a few qualified material suppliers will face cost and reliability constraints.
- Wider ecosystem with multiple anode, cathode, electrolyte, and equipment suppliers will help manufacturers reduce cost, qualify customers faster, and support regional production outside China.
| Upstream signal | Current statistic / indicator | Commercial meaning |
|---|---|---|
| Materials market value | USD 2.1B in 2024 | Sodium-ion supply chain already has measurable scale. |
| Materials market value | USD 2.7B in 2025 | Early growth before broad battery revenue conversion. |
| Materials target | USD 28.8B by 2034 | Large upstream opportunity if commercialization scales. |
| Materials CAGR | 30.0% during 2025-2034 | High-growth supplier ecosystem. |
| Hard carbon supply | Key anode variable | Can determine cost and capacity limits. |
| Cathode standardization | Core materials requirement | Needed for manufacturability and qualification. |
| Supplier diversity | Regional supply-chain indicator | Reduces concentration and procurement risk. |
Upstream readout
Sodium-ion market maturity should be measured through materials and supplier readiness as much as through cell announcements. The chemistry cannot scale unless anode, cathode, electrolyte, and pack-integration ecosystems scale with it.
Sodium-Ion Battery Market Diagnostic
• A useful diagnostic does not ask whether sodium-ion batteries are better than lithium-ion in every category.
• It asks where sodium-ion creates a measurable advantage.
• The chemistry should be watched through storage tenders, low-cost mobility pilots, data-center backup adoption, manufacturing utilization, and cost-per-cycle comparisons.
• If production capacity rises faster than shipments, the market may be supply-built but demand-qualified slowly.
• If energy storage keeps its 55.0% application leadership, sodium-ion is scaling through the right first market.
• If China capacity reaches 65.2 GWh by 2030 and 292.0 GWh by 2034, regional concentration remains a strategic issue.
• If North America and Europe increase procurement, the market could shift from China-led manufacturing to multi-region demand formation.
• Strongest signal is the combination of capacity, offtake, and use-case fit. A sodium-ion plant announcement alone is not enough.
• Bankable storage contract, a qualified pack platform, a hard carbon supply agreement, and a proven warranty structure make the market more durable.
| Market signal | What it means | Action for leaders |
|---|---|---|
| Capacity grows faster than shipments | Commercial qualification is the bottleneck | Track offtake, utilization, and customer approvals. |
| Storage remains the leading application | Chemistry is finding the right early market | Monitor grid tenders and storage contracts. |
| LFP prices fall | Sodium-ion must prove lifecycle value | Compare cost per cycle and supply risk. |
| China dominates capacity | Regional concentration persists | Watch U.S., Europe, and India localization. |
| Energy density improves above 175 Wh/kg | Mobility opportunity expands | Track vehicle pilots and pack designs. |
| Materials market grows near | Upstream ecosystem is scaling | Monitor hard carbon and cathode suppliers. |
Planning readout
The best sodium-ion research program treats the market as a live commercialization system, not a static forecast. The fastest-changing indicators are capacity utilization, qualified storage projects, and company offtake signals.
90-Day Sodium-Ion Battery Market Research Plan
• A 90-day research plan should begin with market sizing, then move into applications, suppliers, country signals, and investment risk.
• In the first 15 days, analysts should validate the forecast range across USD 0.67 billion, USD 1.83 billion, USD 0.54 billion, and USD 369.69 million base-year estimates.
• The goal is not to force one number, but to define conservative, mid-range, and aggressive paths.
• From days 16-30, the focus should shift to application segmentation.
• Energy storage at 55.0% share, sodium-ion cells at 48.0%, ambient-temperature batteries at 77.4%, and automotive sodium-ion moving toward USD 375.8 million by 2030 give the first segmentation framework.
• Analysts should identify whether storage, mobility, backup power, or data centers are driving commercial activity.
• From days 31-60, country and company analysis should deepen. China capacity should be tracked from 10.0 GWh in 2025 to 65.2 GWh in 2030 and 292.0 GWh in 2034.
• United States, India, Germany, the United Kingdom, Japan, South Korea, Australia, Canada, France, and the Netherlands should be monitored for storage policy, company partnerships, and manufacturing signals.
• From days 61-90, the final work should build a practical market model.
• That model should compare sodium-ion with LFP, measure cost per kWh and cost per cycle, test deployment scenarios, and separate announced capacity from confirmed shipments.
• Final output should be a market-entry dashboard, a supplier watchlist, and a country-level opportunity ranking.
| Timeframe | Research task | Output |
|---|---|---|
| Days 1-15 | Validate forecast range and CAGR assumptions | Conservative, mid, aggressive forecast map. |
| Days 16-30 | Segment storage, cells, mobility, data centers, and backup use cases | Application opportunity matrix. |
| Days 31-45 | Map China, U.S., India, Europe, Japan, South Korea, and Australia | Country opportunity dashboard. |
| Days 46-60 | Track CATL, BYD, HiNa, Natron, Faradion, Tiamat, and storage deals | Company and supplier watchlist. |
| Days 61-75 | Compare sodium-ion vs LFP cost, density, cycle, and supply risk | Chemistry positioning model. |
| Days 76-90 | Build investment, procurement, and market-entry recommendations | Final strategic market brief. |
Metrics Leaders Should Track
- Leaders should track sodium-ion through operating indicators rather than headlines alone.
- The most important metrics are annual shipments, qualified production capacity, cell cost per kWh, pack cost per kWh, cycle life, energy density, storage deployments, warranty terms, hard carbon availability.
- The price gap versus LFP.
- Regional metrics also matter.
- Asia Pacific share at 60.22%, China capacity growth toward 65.2 GWh by 2030, North America’s 26.2% share path, and European localization activity should be updated as new deployments appear.
- Country-level demand can change quickly if grid-storage tenders accept sodium-ion technology or if a major vehicle platform adds sodium-ion packs.
- For investors and procurement teams, the most useful metric is not only the lowest cell cost.
- It is the lowest risk-adjusted cost for a specific service.
- A sodium-ion battery may be more attractive for backup power, data centers; storage if it offers stable supply, safe operation.
- A sodium-ion battery may be more attractive for backup power, data centers, or storage if it offers stable supply, safe operation, and adequate performance even at lower energy density.
| Metric | Why it matters | Best use |
|---|---|---|
| Annual sodium-ion shipments | Shows real adoption beyond announcements | Market sizing. |
| Qualified capacity | Separates planned capacity from usable supply | Supplier selection. |
| Cell cost per kWh | Measures price competitiveness | Procurement. |
| Cost per cycle | Improves storage economics analysis | Grid storage evaluation. |
| Energy density | Defines mobility and space-constrained fit | Application screening. |
| Hard carbon supply | Controls anode scale and cost | Supply-chain monitoring. |
| Storage project count | Measures bankability | Demand validation. |
| LFP price gap | Shows competitive pressure | Chemistry comparison. |
Final Market Interpretation
The final market signal is that sodium-ion batteries should be read through decision categories rather than one headline forecast. Market value explains revenue scale, capacity data explains supply readiness, energy density explains application fit, and regional data explains where commercialization is likely to move first.
The USD 0.67 billion 2025 market baseline, USD 2.01 billion 2030 path, and 70 GWh/year to nearly 400 GWh/year production-capacity path point to the same conclusion: sodium-ion is still early, but the market is leaving the demonstration phase.
The strongest interpretation is selective adoption. Sodium-ion batteries do not need to win every EV segment to become commercially important. Storage systems, backup power, data centers, two-wheelers, low-speed vehicles, and industrial applications can create meaningful demand even while premium EVs remain dominated by lithium-ion chemistries.
For investors and manufacturers, the key benchmark is not only CAGR. The more useful dashboard combines verified shipments, installed storage projects, cost per cycle, capacity utilization, company partnerships, and country-level procurement signals.
Market readout
Every statistic should do a job: size the market, explain adoption, compare chemistries, rank regions, or guide procurement decisions. This keeps the flow close to the reference article because the reader sees a clear market signal first, then a compact table or graph, then a short interpretation that turns data into a business takeaway.
Sodium-Ion Battery Market Statistics FAQ
How big is the sodium-ion battery market?
Market estimates vary by methodology. One forecast places the market at USD 0.67 billion in 2025 and USD 2.01 billion by 2030, while another places it at USD 1.83 billion in 2025 and USD 7.08 billion by 2034.
What is the expected CAGR for sodium-ion batteries?
Across the collected market reports, sodium-ion growth ranges from 16.3% CAGR to 30.0% CAGR, depending on whether the forecast covers finished batteries, materials, or broader commercialization paths.
Which region leads the sodium-ion battery market?
Asia Pacific leads the market. One dataset places Asia Pacific at 60.22% of global sodium-ion battery market share in 2025, with China serving as the main capacity and commercialization center.
What are sodium-ion batteries mainly used for?
The strongest early use cases are stationary energy storage, backup power, data centers, UPS systems, telecom, two-wheelers, low-speed EVs, and cost-sensitive mobility. Energy storage is expected to hold around 55.0% application share.
Are sodium-ion batteries cheaper than lithium-ion batteries?
Sodium-ion batteries have a strong cost argument because sodium is abundant and many designs reduce dependence on lithium, cobalt, and nickel.
However, early products may not always be cheaper until production scale and supplier maturity improve.
Will sodium-ion batteries replace lithium-ion batteries?
Sodium-ion batteries are not expected to replace lithium-ion everywhere. They are more likely to complement lithium-ion in storage, backup, entry mobility, and cost-sensitive applications, while premium long-range EVs may continue to favor high-density lithium-ion chemistries.
What is the main technical limitation?
Energy density is the main limitation. Latest sodium-ion cells reach around 175 Wh/kg, compared with up to 205 Wh/kg for LFP and 255 Wh/kg for NMC.
Which companies are active in sodium-ion batteries?
CATL, BYD, HiNa Battery, Natron Energy, Faradion, Tiamat, and other developers are active in commercialization, storage, materials, and technology development.
Final Takeaway
Sodium-ion batteries are entering the market at the right time: storage demand is rising, supply-chain security is more important, and customers are looking beyond maximum energy density. Forecasts vary, but the direction is consistent.
Market paths point to double-digit growth, production capacity could rise from 70 GWh/year in 2025 to nearly 400 GWh/year by 2030, and cell density has reached 160-175 Wh/kg. Sodium-ion is not a universal lithium-ion replacement, but it can become a meaningful battery category if it proves lower risk-adjusted cost in storage, backup power, data centers, and entry mobility.