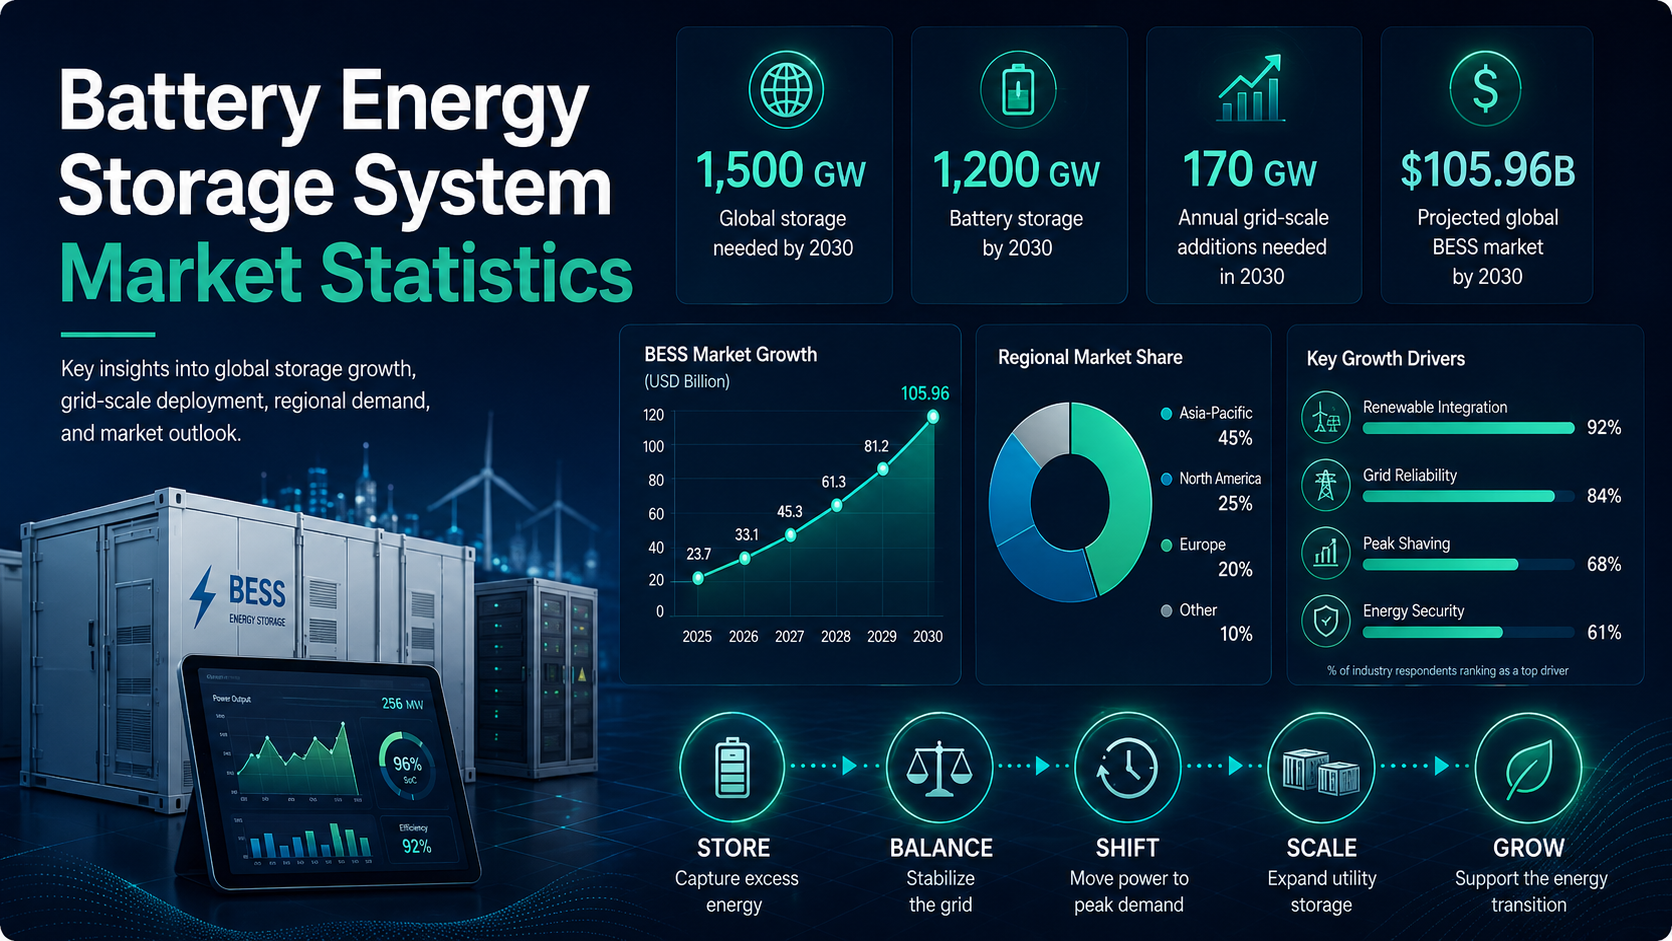
Battery energy storage systems have moved from a renewable-project add-on to core electricity infrastructure. A modern BESS can absorb midday solar output, discharge into evening peaks, support frequency response, reduce curtailment, and strengthen grid resilience. That is why the market is now measured not only in dollars, but also in GW, GWh, duration, project pipelines, and grid-connection readiness.
The strongest statistics show a market scaling quickly but still far from its 2030 requirement. The International Energy Agency pathway points to 1,500 GW of global energy storage by 2030, with battery storage rising to 1,200 GW and grid-scale batteries reaching nearly 970 GW. Annual grid-scale additions need to approach 170 GW by 2030, compared with 11 GW added in 2022.
The most useful way to read the BESS market is to separate demand from deliverable capacity. Global targets show the flexibility the power system needs, while regional and country-level figures show where storage is actually being built. The U.S., China, India, Australia, Europe, and the UK all matter, but each market has a different mix of deployment, pipeline, policy, and grid-access constraints.
Executive BESS Benchmarks
These headline figures frame the market. They show the scale of global storage needs, the speed of utility-scale deployment, the regional market split, and the difference between announced demand and operational assets. The numbers also explain why battery storage is now discussed alongside solar, wind, transmission, and capacity planning rather than as a small downstream equipment category.
The numbers that define the BESS market
• Global storage capacity must increase sixfold by 2030 to support renewable expansion and electricity security.
• IEA’s Net Zero pathway places global energy storage capacity at 1,500 GW by 2030.
• Battery storage rises 14-fold to 1,200 GW by 2030 in the same pathway.
• Batteries account for about 90% of the storage increase needed in the IEA pathway.
• Grid-scale battery storage capacity expands 35-fold between 2022 and 2030 in the Net Zero Scenario.
• Installed grid-scale battery storage reaches nearly 970 GW by 2030.
• Annual grid-scale battery additions need to rise to around 170 GW in 2030, compared with 11 GW in 2022.
• The global BESS market is projected at USD 50.81 billion in 2025 and USD 105.96 billion by 2030.
• Asia-Pacific is projected to reach USD 62.45 billion by 2030, ahead of North America and Europe in the market forecast.
• U.S. utility-scale battery additions reached a record 10.3 GW in 2024, with 18.2 GW expected in 2025.
• Europe’s newly installed battery capacity was expected to increase to 29.7 GWh in 2025.
• India’s 2031-32 storage requirement reaches 411.4 GWh, including 236.22 GWh of BESS.
• Australia’s storage need rises from about 3 GW today to at least 22 GW by 2030 and 49 GW by 2050.
• The UK had 5,013 MW of operational battery storage and 127,404 MW in the project pipeline in the cited Renewable snapshot.
Why BESS Became a Grid-Scale Market
Battery storage demand is growing because electricity systems need faster, more flexible capacity. Solar output often peaks before evening demand, wind varies with weather, and electrification raises peak-hour reliability needs. Batteries help move surplus renewable electricity into higher-demand periods while also supporting frequency response and reserve services.
The market has also changed because storage can substitute for or complement several grid investments. Batteries can reduce curtailment, support local reliability, delay some network upgrades, and replace expensive peaking generation where market rules support the revenue stack.
Global storage scale-up benchmarks
• The 2030 storage requirement of 1,500 GW is about 530 GW higher than the nearly 970 GW grid-scale battery target, showing that the storage transition includes multiple technologies and scales.
• Battery storage makes up about 80% of total 2030 storage capacity if batteries reach 1,200 GW out of the 1,500 GW total.
• The 2030 annual grid-scale addition benchmark of 170 GW is about 15.5 times the 11 GW added in 2022.
• Average annual grid-scale additions need to be close to 120 GW per year over 2023-2030.
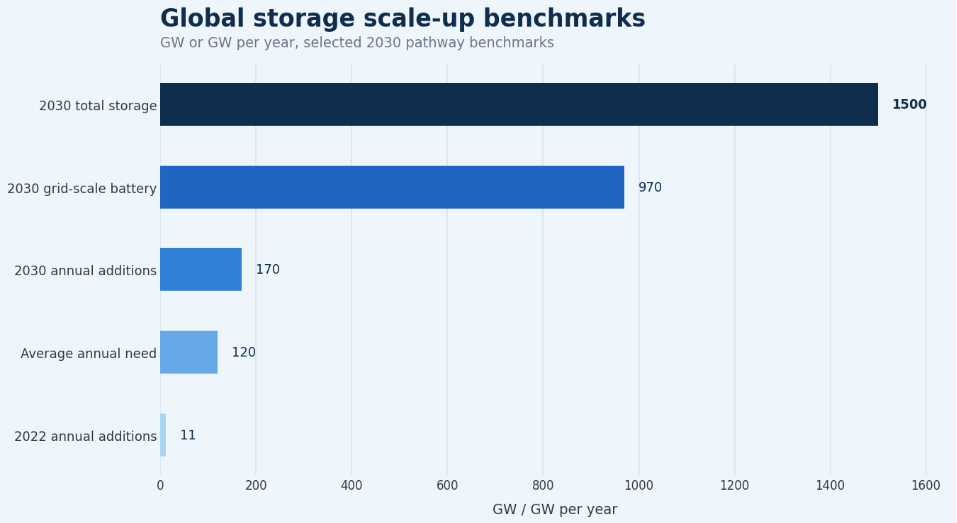
Figure 1. Global storage scale-up benchmarks show why annual additions, cumulative capacity, and technology mix should be reviewed together.
Global BESS Market Size and Forecast
Market-size forecasts are useful, but they should be read beside capacity data. Some forecasts include only utility-scale systems, while others include residential batteries, C&I storage, containers, inverters, software, installation, and services. Capacity shows how much storage enters the system; market value shows the commercial activity attached to that capacity.
The global forecast used here more than doubles between 2025 and 2030. Asia-Pacific carries the largest regional value, while North America and Europe remain major markets shaped by utility-scale projects, grid constraints, policy support, and storage-market design.
Market-value and regional forecast benchmarks
• The global BESS market is projected at USD 50.81 billion in 2025.
• The same forecast places the market at USD 105.96 billion by 2030.
• The projected global CAGR is 15.8% from 2025 to 2030.
• Asia-Pacific is projected at USD 28.61 billion in 2025 and USD 62.45 billion by 2030.
• Asia-Pacific’s projected CAGR is 16.9%, higher than the global forecast CAGR.
• North America is projected at USD 10.03 billion in 2025 and USD 19.87 billion by 2030.
• Europe is projected at USD 9.17 billion in 2025 and USD 18.00 billion by 2030.
• Asia-Pacific adds about USD 33.84 billion of market value between 2025 and 2030.
• North America adds about USD 9.84 billion, while Europe adds about USD 8.83 billion over the same period.
| Market view | 2025 value | 2030 value | Growth signal | Article interpretation |
|---|---|---|---|---|
| Global BESS market | USD 50.81B | USD 105.96B | More than doubles | Mainstream infrastructure market. |
| Asia-Pacific | USD 28.61B | USD 62.45B | Largest regional value | China, India, Australia, manufacturing depth. |
| North America | USD 10.03B | USD 19.87B | Nearly USD 20B by 2030 | Strong growth; queue constraints. |
| Europe | USD 9.17B | USD 18.00B | Steady expansion | Shift toward grid-scale systems. |
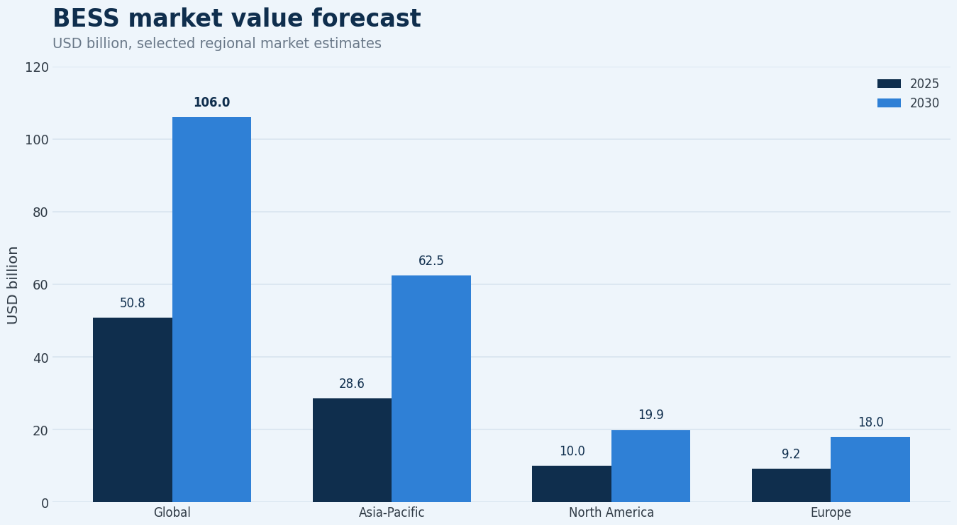
Figure 2. The BESS market-value forecast shows global growth and the larger role of Asia-Pacific by 2030.
Utility-Scale Deployment and Annual Additions
Utility-scale deployment is the clearest sign that BESS has moved beyond household backup and rooftop-solar optimization. Large batteries are increasingly planned as grid assets, using fast response, renewable shifting, and market participation to support system flexibility.
The annual-addition statistics show the size of the ramp. A market that added 11 GW of grid-scale batteries in 2022 needs much faster procurement, interconnection, permitting, manufacturing, software controls, and long-term contracting to reach the 2030 pathway.
Utility-scale deployment benchmarks
• IEA’s grid-scale battery target reaches nearly 970 GW by 2030.
• Grid-scale battery storage grows 35-fold between 2022 and 2030 in the Net Zero Scenario.
• Grid-scale battery additions were 11 GW in 2022, far below the average annual buildout needed later in the decade.
• U.S. utility-scale battery additions were expected to reach 18.2 GW in 2025, after a record 10.3 GW in 2024.
• Solar and battery storage together accounted for 81% of expected U.S. utility-scale capacity additions in EIA’s 2025 outlook.
• China added 34.5 GW of battery storage capacity in 2023 according to CNESA-linked figures.
• CNESA’s base-case 2024 China outlook was 30.1 GW, while the optimistic case reached 41.2 GW.
• Australia had 27 large-scale batteries under construction at the end of 2023, up from 19 at the end of 2022.
• Australia’s end-2023 under-construction large battery pipeline totaled 5 GW and 11 GWh.
• The UK had 5,013 MW of operational battery storage and 127,404 MW in the project pipeline in the RenewableUK snapshot.
| Market | Deployment signal | Why it matters |
|---|---|---|
| Global | Nearly 970 GW grid-scale battery target by 2030 | Scale of required buildout. |
| United States | 10.3 GW added in 2024 and 18.2 GW expected in 2025 | Utility-scale commercialization. |
| China | 34.5 GW added in 2023 | Shows the scale advantage of the world’s largest battery deployment market. |
| Australia | 5 GW / 11 GWh under construction at end-2023 | Large batteries for renewable balancing. |
| United Kingdom | Pipeline about 25.4 times operational capacity | Strong pipeline; queue pressure. |
Regional Battery Storage Market Intelligence
Regional data matters because battery storage does not grow for the same reason everywhere. North America is driven by utility-scale additions and interconnection queues. Europe is shifting from a residential-heavy base toward grid-scale storage. Asia-Pacific combines China’s scale, India’s future need, Australia’s big-battery market, and manufacturing depth.
Regional market signals
• Asia-Pacific is projected to reach USD 62.45 billion in BESS market value by 2030.
• North America reaches nearly USD 20 billion by 2030 in the same market forecast.
• Europe reaches USD 18 billion by 2030 in that forecast.
• Europe’s newly installed battery capacity was expected to increase to 29.7 GWh in 2025.
• Europe’s 2025 new battery capacity outlook was 36% higher than 2024.
• Large-scale storage market share in Europe was expected to increase by 15 percentage points in 2025.
• Residential storage market share in Europe was expected to shrink by 17 percentage points, showing a mix shift rather than a simple slowdown.
• The EU installed a record 27.1 GWh of new BESS capacity in 2025, according to the source data.
• The EU battery fleet was reported above 77 GWh, while the target figure reaches 750 GWh.
• Australia’s storage need rises from 3 GW to 22 GW by 2030, creating a large regional expansion requirement.
• India’s total storage need rises from 82.37 GWh in 2026-27 to 411.4 GWh in 2031-32.
• China’s optimistic 2024 battery-storage addition scenario of 41.2 GW was 36.9% higher than the base scenario.
| Region | Main growth driver | Most useful statistic | Article interpretation |
|---|---|---|---|
| North America | Utility-scale storage, grid reliability and state-level markets | U.S. 18.2 GW expected additions in 2025 | Strong demand; grid timing matters. |
| Europe | Renewable balancing and shift toward grid-scale storage | EU fleet above 77 GWh vs 750 GWh target | Needs larger grid-scale fleet. |
| Asia-Pacific | China scale, India demand and Australia big batteries | APAC USD 62.45B 2030 forecast | Largest value; broad drivers. |
| Latin America | Solar-plus-storage, reliability and mining demand | Project-led growth signals | Country rules matter most. |
| Middle East & Africa | Utility solar, remote grids and energy security | Solar-plus-storage project demand | Tied to renewables and reliability. |
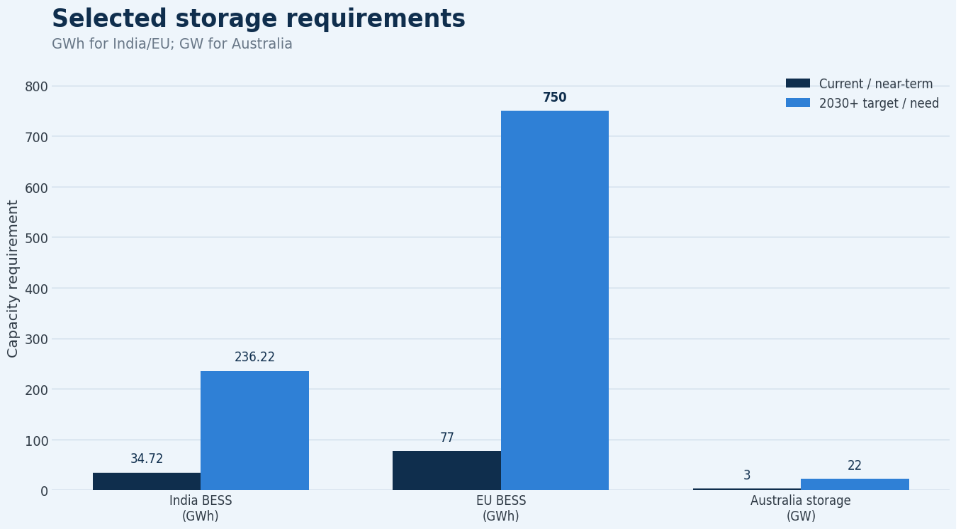
Figure 3. Country and regional storage requirements show why global BESS growth must be interpreted through local power-system needs.
Country-Level BESS Statistics
Country statistics make the market practical. The United States shows utility-scale commercialization, China shows deployment scale, India shows future storage need, Australia shows big batteries supporting a high-renewables grid, and the UK shows why pipeline capacity must be separated from operating capacity.
United States
The U.S. market shows utility-scale storage becoming mainstream. Solar-plus-storage projects, stand-alone batteries, and reliability needs are driving additions, although interconnection queues can slow delivery.
• U.S. utility-scale battery storage additions are expected to reach 18.2 GW in 2025.
• U.S. battery storage achieved record growth in 2024 with 10.3 GW added.
• U.S. storage developers installed a record 9.7 GWh in Q1 2026.
• Q1 2026 U.S. installations were 32% higher than the same period in 2025.
• Utility-scale projects contributed 7.8 GWh of Q1 2026 U.S. additions.
• Commercial systems contributed 648 MWh, while residential systems contributed 515 MWh in Q1 2026.
• Utility-scale storage represented about 80.4% of Q1 2026 U.S. additions by energy capacity.
• SEIA projects more than 610 GWh of new U.S. storage capacity by 2030.
• Some U.S. interconnection timelines can range from 3 to 7 years, which means demand can arrive faster than grid approvals.
China
China is central to BESS because it combines large domestic deployment with battery manufacturing scale. Its annual additions show how quickly storage can grow when policy, supply chains, and project demand align.
• China added 34.5 GW of battery storage capacity in 2023.
• CNESA expected China to add 30.1 GW of battery storage capacity in 2024 in its base scenario.
• CNESA’s optimistic scenario placed China’s 2024 addition at 41.2 GW.
• China’s 2023 battery storage addition of 34.5 GW was about 3.1 times the IEA’s 2022 global grid-scale annual addition of 11 GW.
• Global energy storage product sales were expected to increase by 35% in the cited CNESA/Reuters-linked outlook.
India
India’s BESS story is a future-need story. Renewable targets, peak demand growth, and solar buildout point to a much larger storage market by the early 2030s, with BESS taking a larger role over time.
• India’s projected energy storage requirement is 82.37 GWh in 2026-27.
• The 2026-27 requirement includes 34.72 GWh of BESS and 47.65 GWh of pumped storage.
• India’s projected storage requirement rises to 411.4 GWh in 2031-32.
• The 2031-32 requirement includes 236.22 GWh of BESS and 175.18 GWh of pumped storage.
• India’s BESS requirement increases by about 201.5 GWh from 2026-27 to 2031-32.
• BESS represents about 42.2% of India’s 2026-27 storage requirement and about 57.4% of the 2031-32 requirement.
• India’s Q1 2025 standalone ESS tenders reached 6.1 GW across 11 tenders.
• India’s National Electricity Plan envisages about 47 GW and 236 GWh of battery storage by 2032.
Australia
Australia is one of the strongest examples of storage supporting a high-renewables grid. Large batteries help manage solar and wind output, local reliability, and system services, while project sizes are growing quickly.
• Australia’s current storage capacity was stated at about 3 GW, including batteries, virtual power plants and pumped hydro.
• AEMO-linked reporting forecasts Australia will need at least 22 GW of storage by 2030.
• The 2050 storage need reaches at least 49 GW to support net zero.
• Australia had 27 large-scale batteries under construction at the end of 2023, compared with 19 at the end of 2022.
• The end-2023 under-construction pipeline totaled 5 GW and 11 GWh.
• The end-2022 under-construction pipeline totaled 1.4 GW and 2 GWh.
• Australia’s under-construction energy capacity rose about 5.5 times from 2022 to 2023.
• Big-battery investment reached AUD 2.4 billion in Q1 2025 across six new projects reaching financial close.
• Australia surpassed four million rooftop solar installations in 2024, creating a wider flexibility need.
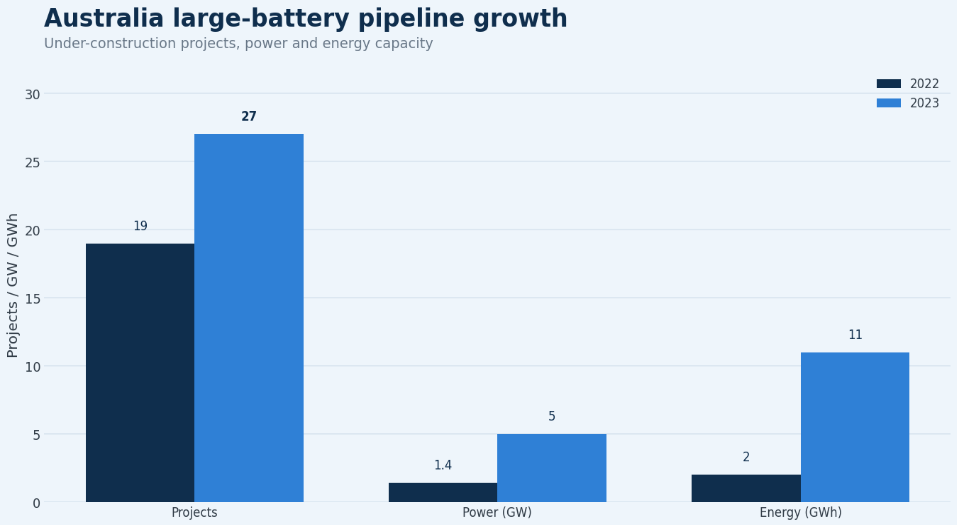
Figure 4. Australia’s large-battery pipeline shows growth in project count, power capacity, and energy capacity.
United Kingdom and Selected European Markets
The UK and selected EU markets show why pipeline analysis matters. Operational capacity is only one part of the story; large pipelines still depend on grid connection, market access, permitting, and auction economics.
• The UK had 1,659 active battery storage projects in the RenewableUK pipeline snapshot.
• The UK had 5,013 MW of operational battery storage capacity.
• The UK had 127,404 MW of battery storage capacity in the pipeline.
• The UK pipeline was about 25.4 times larger than operational capacity.
• The UK grid connection queue for all energy projects reached more than 700 GW, with battery storage projects making up 97 GW.
• Battery storage represented about 13.9% of the UK 700 GW connection queue.
• UK energy storage sector employment increased from 800 people in 2019 to 5,600 people in 2022.
• Bulgaria grew from about 200 MWh of installed BESS capacity in 2024 to nearly 2,500 MWh by the end of 2025.
• More than 10,000 MWh of batteries were under construction in Bulgaria.
• A Swiss underground storage project is planned with 1.5 GWh of vanadium flow batteries and could expand to 2.1 GWh.
| Country / market | Key signal | Storage role | Best article angle |
|---|---|---|---|
| United States | 18.2 GW expected utility-scale additions in 2025 | Grid reliability and solar shifting | Large market; queue constraints. |
| China | 34.5 GW added in 2023 | Renewable integration and domestic scale | Scale leader and manufacturing anchor. |
| India | 236.22 GWh BESS requirement by 2031-32 | Solar-plus-storage and peak flexibility | Future-demand market with policy support. |
| Australia | 22 GW storage need by 2030 | High-renewables balancing | Big batteries become grid infrastructure. |
| United Kingdom | 127,404 MW pipeline vs 5,013 MW operational | Flexibility and capacity markets | Pipeline-heavy; grid queues. |
| Bulgaria | Capacity rose from 200 MWh to nearly 2,500 MWh | EU grid modernization | Emerging EU growth example. |
| Switzerland | 1.5 GWh to 2.1 GWh flow project | Longer-duration storage | Technology-diversity example. |
Residential, Commercial, Industrial and Utility-Scale Segments
The BESS market should not be treated as one segment. Residential batteries support rooftop solar, backup power, and self-consumption. Commercial and industrial systems focus on resilience and power-cost control. Utility-scale systems are much larger and serve grid balancing, capacity, ancillary services, and renewable shifting.
Segment data prevents misleading conclusions. A country may have many small residential batteries but limited grid-scale capacity, while another may have fewer projects with far larger energy capacity. U.S. Q1 2026 data shows utility-scale storage carrying most reported energy capacity for that quarter.
Segment benchmarks
• U.S. Q1 2026 storage installations reached 9.7 GWh.
• Utility-scale projects contributed 7.8 GWh, or about 80.4% of the Q1 2026 U.S. additions by energy capacity.
• Commercial systems contributed 648 MWh, equal to about 6.7% of the same quarterly additions.
• Residential systems contributed 515 MWh, equal to about 5.3% of the same quarterly additions.
• Europe’s large-scale storage market share was expected to increase by 15 percentage points in 2025.
• Europe’s commercial and industrial storage market share was expected to rise by 2 percentage points in 2025.
• Europe’s residential storage market share was expected to shrink by 17 percentage points, showing a change in market mix.
| Segment | Main buyer | Common use case | What the stats should show |
|---|---|---|---|
| Residential | Homeowners | Rooftop solar storage, backup and self-consumption | Adoption volume, attachment rates and household economics. |
| Commercial | Retail, offices and campuses | Demand-charge management and resilience | Project size, tariff savings and backup value. |
| Industrial | Factories, mines and large facilities | Power quality, peak control and reliability | Larger behind-the-meter systems and contracted energy savings. |
| Utility-scale | Power producers and grid operators | Renewable balancing, capacity and ancillary services | Installed MW/MWh, duration and market revenue. |
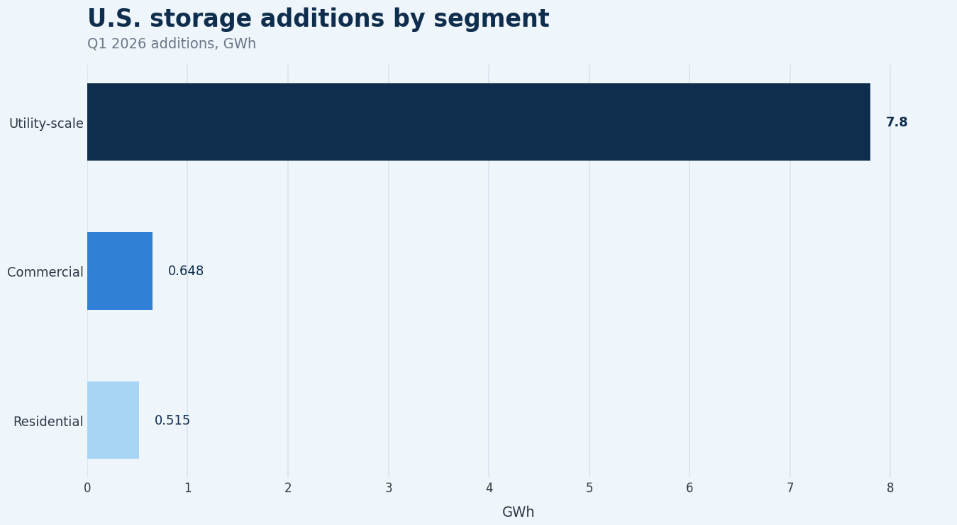
Figure 5. U.S. Q1 2026 additions show how utility-scale systems dominate reported energy capacity in that quarter.
BESS Costs, Battery Prices and Investment Signals
Battery cost declines help explain the acceleration in storage deployment, but they do not remove every project constraint. Grid access, permitting, financing costs, revenue certainty, and supply-chain timing still determine whether strong economics become operating capacity.
The commercial case is also changing as systems become larger and more specialized. Some projects target short-duration arbitrage, while others are built for capacity markets, data-center demand, renewable firming, or longer-duration flexibility.
Cost and investment benchmarks
• Australia’s Q1 2025 big-battery investment reached AUD 2.4 billion.
• Six Australian big-battery projects reached financial close in Q1 2025.
• Those six Q1 2025 projects totaled 1.5 GW.
• The Wooleen battery project in Victoria is 350 MW.
• Australia’s end-2023 under-construction large batteries averaged about 407 MWh per project.
• The same pipeline averaged about 185 MW per project.
• Australia’s end-2022 under-construction pipeline averaged about 105 MWh per project.
• Average energy capacity per under-construction Australian big battery grew about 3.9 times from 2022 to 2023.
• A Ford Energy agreement may supply up to 20 GWh of BESS to EDF, with deliveries scheduled to begin in 2028.
| Signal | What it means for BESS | Planning implication |
|---|---|---|
| Falling battery costs | Improves project economics | Improves bankability. |
| Larger project sizes | Shows market maturity | Needs finance, grid studies and safety design. |
| Big investment rounds | Shows infrastructure capital interest | Check against commissioning. |
| Supply agreements | Shows demand visibility | Can reduce procurement risk if delivery schedules hold. |
| Interconnection delays | Can slow projects despite strong economics | Separate pipeline from operation. |
Technology Mix and Storage Duration
Lithium-ion batteries dominate many short-duration BESS deployments because they are commercially mature, scalable, fast responding, and supported by a large manufacturing base. Within lithium-ion, LFP chemistry has become important because of its cost and thermal-stability advantages. However, not every storage need is a two-hour or four-hour need. As renewable penetration grows, longer-duration storage technologies may become more important for multi-hour shifting, seasonal flexibility, industrial reliability, and data-centre demand.
Duration matters because MW and MWh tell different stories. A 100 MW two-hour battery stores about 200 MWh, while a 100 MW four-hour battery stores about 400 MWh. Country examples show different market needs, from two-hour systems in Texas to longer-duration projects in India and Switzerland.
Technology and duration benchmarks
• Lithium-ion systems dominate many short-duration BESS deployments because they fit fast-response grid services and solar shifting.
• A Swiss underground storage project is planned with 1.5 GWh of vanadium flow batteries.
• The Swiss flow-battery project could expand to 2.1 GWh, implying a 40% capacity increase.
• The Swiss system is described as having up to 10-hour discharge duration.
• India’s 930 MW solar-plus-storage award paired each MW of solar with about 2 MWh of battery energy.
• The same Indian project included 1.86 GWh of four-hour batteries.
• Texas storage systems were reported as typically around two-hour duration in one 2026 report.
• California storage systems were reported as typically around four-hour duration in the same comparison.
• India’s 47 GW / 236 GWh 2032 outlook implies an average BESS duration of about five hours.
| Technology | Current role | Strength | Limitation |
|---|---|---|---|
| Lithium-ion | Dominant short-duration BESS technology | Mature, scalable and fast responding | Duration, degradation and safety management need attention. |
| LFP | Growing lithium-ion chemistry | Cost and thermal-stability advantages | Lower energy density than some alternatives. |
| Flow batteries | Longer-duration niche | Long cycle life and longer discharge potential | Higher complexity and less deployment scale. |
| Sodium-ion | Emerging option | Material availability and possible cost benefits | Still scaling commercially. |
| Hybrid systems | Solar or wind plus batteries | Improves renewable dispatchability | Project design and revenue stacking are more complex. |
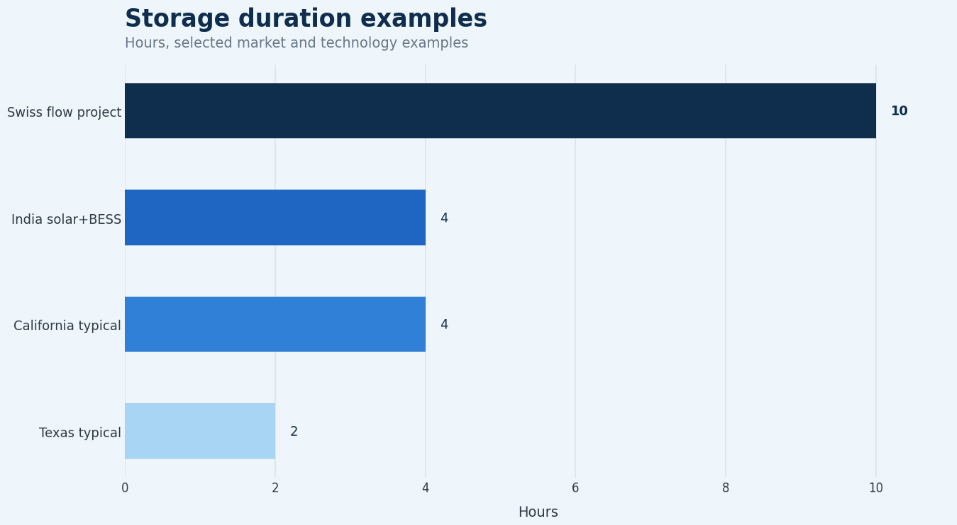
Figure 6. Duration examples show why MW and MWh need to be interpreted together in BESS market analysis.
Project Pipeline, Interconnection and Deployment Barriers
Pipeline data is important because it reveals future intent, but it is easy to overstate. A pipeline can include early-stage projects, grid-study projects, planning applications, construction assets, and projects that may never be built. Operational capacity remains the strongest proof of deployment.
Grid connection is now a central constraint. Batteries can be manufactured faster than many transmission upgrades, but they still need interconnection approval, safety review, market participation rights, and viable revenue contracts.
Pipeline and connection benchmarks
• Some U.S. grid interconnection timelines can range from 3 to 7 years.
• Data centers can be built in 18 to 24 months, creating a mismatch between new power demand and grid-connection timelines.
• Data centers could reach up to 17% of U.S. electricity supply by 2030, compared with about 4% today in the market comparison.
• The UK connection queue for all energy projects reached more than 700 GW.
• Battery storage projects made up 97 GW of the UK grid connection queue.
• The UK battery pipeline was about 25.4 times larger than operational battery capacity in the RenewableUK snapshot.
• Bulgaria’s under-construction battery capacity of more than 10,000 MWh was about four times its end-2025 installed capacity.
• India’s Q1 2025 standalone ESS tenders had already surpassed total issuance in 2024.
• India’s Viability Gap Funding scheme offers up to 30% support for capital cost.
| Barrier | What to measure | Why it matters |
|---|---|---|
| Grid connection | Queue time, approval status and network studies | Strong demand does not guarantee fast commissioning. |
| Permitting | Planning approvals, fire-code compliance and local review | Can shift projects from near-term to long-term pipeline. |
| Revenue uncertainty | Capacity, arbitrage, ancillary services and contracts | Determines bankability and financing terms. |
| Safety rules | Siting, spacing and thermal-management requirements | Affects location, cost and community acceptance. |
| Supply chain | Battery availability, inverter supply and delivery schedule | Can affect commissioning even after financing. |
| Policy design | Tenders, incentives, grid charges and market access | Can accelerate or slow project economics. |
BESS Market Risks and Reliability Issues
A strong BESS market view should include risk. Safety scrutiny, degradation, recycling, critical-mineral exposure, grid queues, and revenue uncertainty do not cancel the opportunity; they define the conditions under which the opportunity becomes investable.
Risk and reliability signals
• Fire safety remains important because lithium-ion projects require careful thermal-management, spacing, monitoring and emergency planning.
• Battery degradation matters because lifetime revenue depends on usable capacity, cycling strategy and warranty performance.
• Critical-mineral exposure affects cost and supply security, especially where battery supply chains are concentrated.
• Recycling and second-life strategies become more important as installed battery fleets grow from pilot scale to infrastructure scale.
• Revenue-model uncertainty matters because energy arbitrage alone may not support every project in every market.
• Grid queues can make the difference between a bankable project and a stranded development opportunity.
• Public acceptance can affect project timelines when local communities worry about fire risk, land use or proximity to homes.
| Risk | Why it matters | How the market responds |
|---|---|---|
| Fire safety | Affects permitting and public acceptance | Codes, thermal controls, spacing and better monitoring. |
| Degradation | Affects lifetime economics | Warranties, software controls and better cycling strategies. |
| Critical minerals | Affects cost and supply security | Chemistry diversification and recycling. |
| Grid delays | Slows project deployment | Queue reform, transmission investment and better screening. |
| Revenue uncertainty | Affects financing | Capacity contracts, tolling agreements and stacked services. |
| Recycling | Affects sustainability and compliance | End-of-life planning and material recovery. |
BESS Market Diagnostic Model
The best way to use BESS statistics is to connect each number to a market question. Market value shows spending potential, capacity shows physical deployment, pipeline shows developer intent, duration shows use case, and risk metrics show where growth may slow.
| Market question | Metric to check | Useful benchmark from this report |
|---|---|---|
| Is storage scaling fast enough? | Annual additions vs 2030 need | 170 GW annual grid-scale additions needed by 2030. |
| Which markets are leading? | Country installed capacity and annual additions | China 34.5 GW in 2023; U.S. 10.3 GW in 2024. |
| Is growth utility-led or residential-led? | Segment share by energy capacity | U.S. Q1 2026 utility-scale share around 80.4%. |
| Is pipeline becoming operation? | Operational capacity vs pipeline capacity | UK pipeline about 25.4 times operational capacity. |
| Are costs supporting deployment? | Investment and project size trends | Australia AUD 2.4B big-battery investment in Q1 2025. |
| Is duration changing? | Average hours and MWh/MW ratio | India 2032 outlook implies about five-hour average duration. |
| Are policies creating demand? | Tender volume and incentives | India 6.1 GW standalone ESS tenders in Q1 2025. |
90-Day BESS Market Review Plan
A practical market review can be organized into a 90-day cycle: establish the baseline, compare country opportunity, then test whether projects can realistically move from pipeline to operation.
| Timing | What to analyze | Output |
|---|---|---|
| Days 1-30 | Review global capacity targets, market-value forecasts, installed capacity and annual additions. | Baseline map of market size and physical deployment. |
| Days 31-60 | Compare country-level deployment, tenders, pipelines, policies and project sizes. | Country opportunity ranking and priority markets. |
| Days 61-90 | Review interconnection, duration, technology mix, costs, safety rules and revenue models. | Practical outlook showing which capacity is most likely to be built. |
Metrics BESS Market Analysts Should Track
A mature BESS scorecard should locate where growth is coming from without becoming a vanity dashboard. Market value, installed MW, installed MWh, duration, pipeline, interconnection, cost, policy, and revenue model should be reviewed together.
| Metric | Why it matters |
|---|---|
| Installed storage capacity | Actual operating market scale. |
| Annual additions | Deployment speed and whether the market is accelerating. |
| Installed energy capacity | How much electricity systems can store, not just discharge power. |
| Average system duration | Whether storage is moving from short response to longer shifting. |
| Project pipeline | Future potential, but must be filtered by development stage. |
| Pipeline-to-operation ratio | Highlights whether developer interest is converting into built assets. |
| Utility-scale share | Whether storage is becoming grid infrastructure. |
| Residential and C&I share | Shows behind-the-meter adoption and customer resilience demand. |
| Battery cost trend | Project economics and procurement risk. |
| Interconnection timeline | The deployment bottleneck that can slow otherwise strong markets. |
| Policy and tender volume | Government support and contracted demand. |
| Revenue model | Whether projects are bankable under real market rules. |
Supply Chain, Manufacturing, and Project Economics
Battery storage growth depends on more than demand from utilities and renewable developers. The market also needs battery cells, containerized systems, inverters, transformers, power-conversion equipment, fire-safety systems, thermal management, control software, installation capacity, and long-term service support. This is why manufacturing and project economics belong in a BESS statistics article. Capacity targets can look simple on paper, but the delivered project depends on whether equipment can be purchased, shipped, permitted, installed, connected, and operated at a price that supports the expected revenue model.
The strongest interpretation is that falling battery costs help the market, but they do not remove every constraint. A project can benefit from lower cell prices and still be delayed by grid-connection studies, transformer shortages, siting concerns, fire-code reviews, land availability, or uncertain merchant revenue. For that reason, BESS market statistics should separate equipment-price trends from total installed project economics. The cost of a battery pack is only one part of the investment case; engineering, procurement, construction, grid upgrades, warranties, degradation assumptions, augmentation plans, insurance, and financing all affect the final project return.
Project economics benchmarks
• A forecast that places the global BESS market at USD 105.96 billion by 2030 should be read as a full project-and-equipment opportunity, not only as a battery-cell market.
• Asia-Pacific’s projected USD 62.45 billion BESS market by 2030 reflects both demand growth and the region’s strong battery manufacturing base.
• North America’s projected USD 19.87 billion 2030 value shows that a smaller regional market can still be highly attractive when utility-scale projects, tax incentives, and grid-services revenue are included.
• Europe’s projected USD 18.00 billion 2030 value shows a market that is becoming more grid-scale focused after years of strong residential and behind-the-meter activity.
• Australia’s AUD 2.4 billion big-battery investment in Q1 2025 shows how quarterly investment can move sharply when several large projects reach financial close together.
• The UK pipeline of 127,404 MW should be treated as potential demand for equipment, grid capacity, land, development capital, and operational expertise rather than a guarantee of installed capacity.
| Economic signal | What it tells the reader | Why it should be separated |
|---|---|---|
| Battery cell price | Core equipment-cost direction | Cells are important, but they are not the full installed system cost. |
| EPC and balance-of-system cost | Real project delivery cost | Containers, inverters, transformers, site work, and safety systems shape final cost. |
| Financing cost | Project bankability | Higher interest rates can weaken returns even when battery prices fall. |
| Revenue stack | Operating value | Capacity payments, energy arbitrage, ancillary services, and contracts vary by market. |
| Augmentation plan | Lifetime performance | Batteries degrade, so long-term energy capacity may require planned additions. |
Policy, Procurement, and Revenue Models
Policy design is one of the main reasons BESS markets do not grow evenly across countries. Storage needs a technical use case, but it also needs a way to earn revenue. In some markets, batteries are built because they can provide frequency response, reserve services, or capacity-market value. In others, procurement comes through renewable tenders, solar-plus-storage contracts, utility resource plans, grid-balancing requirements, or government-backed energy-storage auctions. This makes policy and procurement data just as important as installed-capacity data.
The same battery can look very different depending on market rules. A two-hour battery may work well in a market built around short peak events or ancillary services, while a four-hour system may be more valuable where evening peak shifting is the dominant need. Longer-duration storage becomes more important as renewable penetration rises and as the system needs energy over longer periods, not only fast power for short events. That is why duration statistics, tender rules, and revenue models should be explained together.
Policy and revenue-model benchmarks
• The 2030 grid-scale battery target of nearly 970 GW requires not only technology deployment but also market rules that allow storage to recover investment.
• The annual addition requirement of about 170 GW in 2030 implies a procurement environment much larger than the early-stage market represented by 11 GW of 2022 additions.
• India’s 6.1 GW of standalone ESS tenders in Q1 2025 shows how procurement activity can create a visible project pipeline before capacity is commissioned.
• India’s shift from 34.72 GWh of BESS need in 2026-27 to 236.22 GWh in 2031-32 shows how policy planning can turn storage into a core grid-flexibility requirement.
• The UK connection queue, with battery projects making up 97 GW, shows how market interest can run ahead of grid-connection capacity.
• Texas systems reported as typically around two-hour duration and California systems around four-hour duration show how local market design and use case can affect project configuration.
| Revenue model | Typical BESS role | Market question to ask |
|---|---|---|
| Energy arbitrage | Charge when prices are low and discharge when prices are high | Are price spreads large and frequent enough to support returns? |
| Ancillary services | Provide fast-response grid support | Is the service market deep enough, or will revenue decline as more batteries enter? |
| Capacity market | Provide available capacity during system stress | Does the market reward storage duration fairly? |
| Renewable firming | Make solar or wind output more dispatchable | Does the contract value flexibility as well as energy? |
| Network support | Reduce local congestion or defer grid upgrades | Is there a regulated or contracted mechanism to pay for that benefit? |
How to Read BESS Statistics Without Overstating the Market
BESS statistics can be overstated when every number is treated the same way. Installed capacity, energy capacity, power capacity, pipeline, tenders, market value, and 2030 targets describe different things and should be labeled clearly.
This distinction is especially important in country comparisons. The U.S. may report GW additions, India may publish GWh requirements, the UK may describe MW pipeline capacity, and Australia may report both power and energy capacity. Each number is useful, but only when the unit and development stage are clear.
Measurement rules for BESS statistics
• GW measures power capacity, which shows how much electricity a system can discharge at one moment.
• GWh measures energy capacity, which shows how long a battery can sustain output over time.
• A four-hour battery with 100 MW of power capacity usually implies about 400 MWh of energy capacity before efficiency and operating constraints are considered.
• Pipeline statistics should be separated from operational capacity because projects can be delayed, redesigned, withdrawn, or resized before commissioning.
• Market-value forecasts should be compared with capacity forecasts because dollar growth can be affected by battery prices, equipment mix, inflation, and services included in the forecast.
| Statistic type | Best use | Common mistake |
|---|---|---|
| Operational capacity | Shows what is already connected and available | Treating it as total future market potential. |
| Project pipeline | Shows developer interest and future opportunity | Assuming all projects will be built. |
| Tender volume | Shows procurement momentum | Confusing awarded or tendered capacity with commissioned assets. |
| Market value | Shows commercial spending opportunity | Comparing it directly with capacity without noting cost assumptions. |
| Duration | Shows how the system is intended to operate | Ignoring whether a market needs short power response or longer energy shifting. |
Battery Energy Storage System Market Statistics FAQ
Common questions
• What is the battery energy storage system market?
It includes batteries, power conversion systems, controls, software, installation, and services used to store electricity for later use across residential, C&I, and utility-scale projects.
• How large is the global BESS market?
One forecast places the global BESS market at USD 50.81 billion in 2025 and USD 105.96 billion by 2030, although estimates vary by segment and system scope.
• How much battery storage is needed by 2030?
The IEA pathway places total global storage at 1,500 GW by 2030, with battery storage at 1,200 GW and grid-scale batteries near 970 GW.
• Which countries are important in the BESS market?
China, the United States, India, Australia, the United Kingdom, and major European markets are central because they combine deployment scale, renewable growth, policy support, and large pipelines.
• Why is utility-scale battery storage growing?
Utility-scale BESS is growing because grids need fast capacity for renewable balancing, peak support, frequency response, curtailment reduction, and reliability.
• What is the difference between MW and MWh in BESS?
MW measures discharge power; MWh measures stored energy. A 100 MW two-hour battery stores about 200 MWh, while a four-hour system stores about 400 MWh.
• Which battery technology is most common in BESS?
Lithium-ion remains dominant for short-duration BESS, while LFP, flow batteries, sodium-ion, and hybrids support specialized or longer-duration use cases.
• What are the biggest barriers to BESS deployment?
Major barriers include interconnection delays, permitting, fire-safety rules, revenue uncertainty, supply-chain constraints, financing costs, degradation, and local acceptance.
Final Takeaway
Battery energy storage systems are becoming central to the global electricity transition. The IEA pathway points to 1,500 GW of total storage, 1,200 GW of battery storage, and nearly 970 GW of grid-scale batteries by 2030. Those figures show that BESS is no longer a side category; it is infrastructure for renewable-heavy power systems.
Regional and country-level numbers make the story more practical. The U.S. is adding utility-scale capacity but faces interconnection limits. China shows scale, India shows future demand, Australia shows the role of big batteries in high-renewables grids, and the UK shows why pipeline should not be confused with operational capacity.
The strongest BESS analysis separates market value, installed MW, installed MWh, duration, pipeline, grid connection, technology choice, investment, and risk. A market can look large in dollars but slow in commissioning; another can have a smaller fleet but a credible tender pipeline. That difference turns statistics into useful market intelligence.


