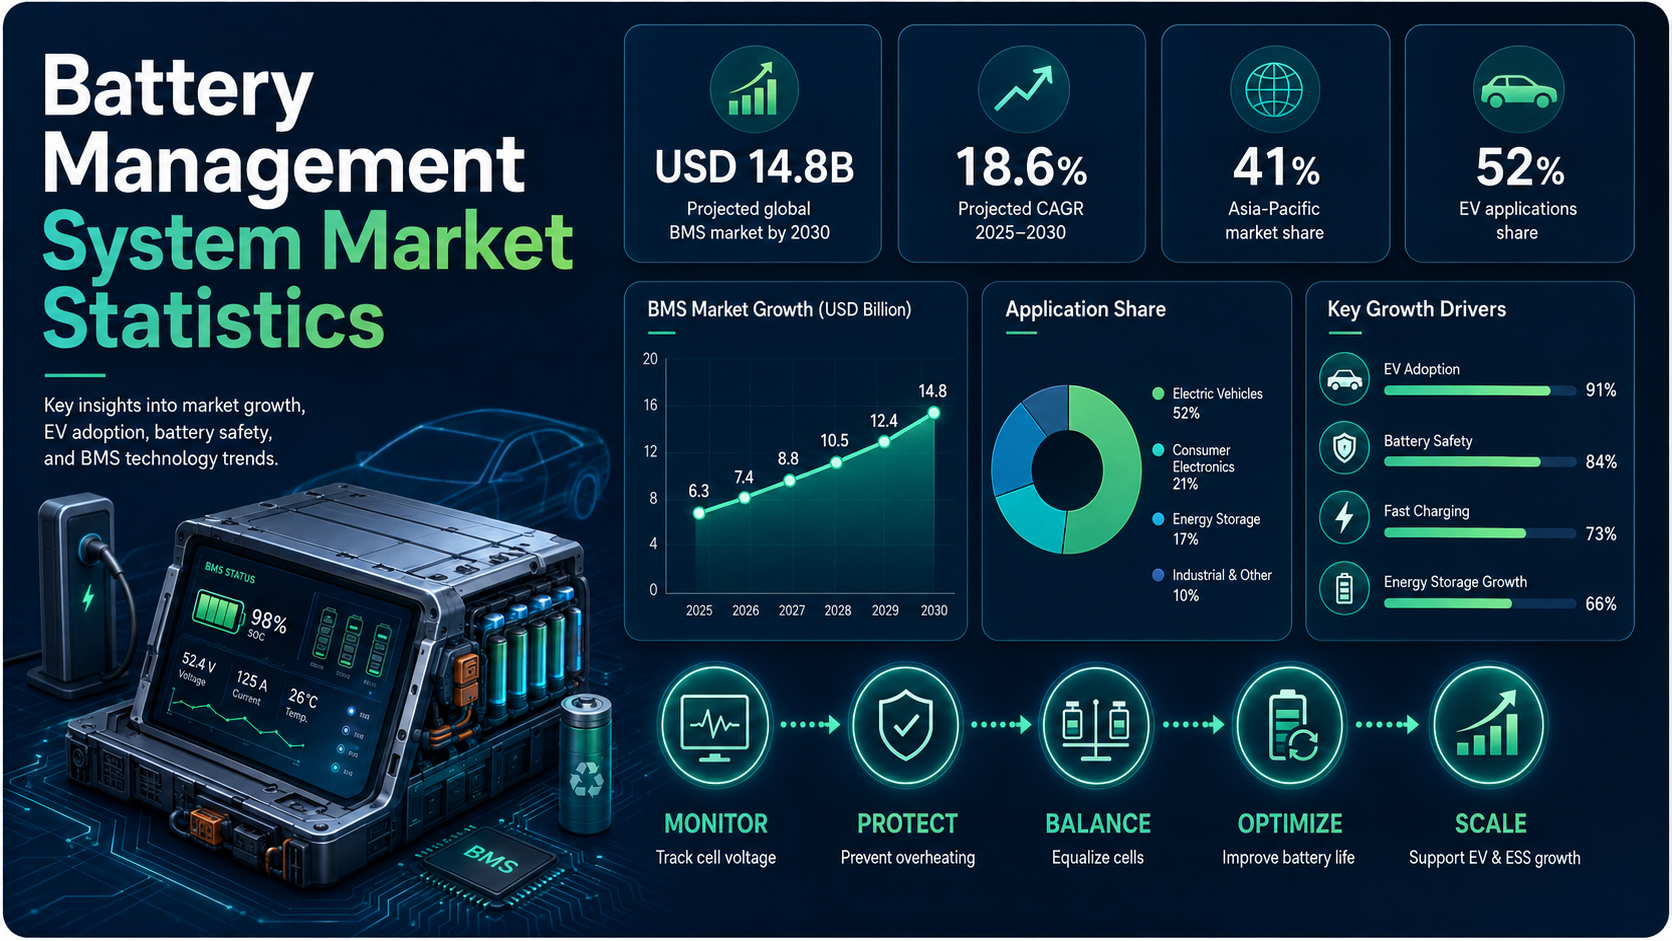
Battery management systems have become one of the most important control layers in the battery economy. A BMS monitors voltage, current, temperature, state of charge, state of health, cell balance, charge protection, discharge protection, and fault conditions. In small devices, that work may feel invisible. In electric vehicles, grid-scale storage, data-center backup systems, industrial batteries, and solar-plus-storage projects, it becomes central to safety, reliability, warranty protection, and asset value.
The strongest market statistics show why BMS has moved from a component discussion into a strategic market category. Market sand Markets estimates the global BMS market at USD 9.10 billion in 2024 and USD 21.00 billion by 2030, while Marcantel places the market at USD 8.56 billion in 2024 and USD 25.31 billion by 2030. Higher-growth forecasts point to even larger long-term values, including USD 66.09 billion by 2033 and USD 86.9 billion by 2035. At the same time, electric car sales exceeded 20 million worldwide in 2025, EVs reached one-quarter of global car sales, and China accounted for 60% of global EV battery deployment.
This article is organized for scanning rather than raw data dumping. It starts with executive BMS benchmarks, then separates global market forecasts from EV demand, stationary storage, regional intelligence, country-level signals, applications, technology trends, safety requirements, supply chain factors, risks, diagnostic models, analyst metrics, FAQ, and a final takeaway. The goal is to show which statistics help explain where BMS demand is growing and why that demand is becoming more software-led, safety-critical, and regionally concentrated.
Executive BMS Benchmarks
These headline figures frame the market. They show the difference between market-value forecasts, physical battery demand, regional leadership, EV adoption, and safety-driven technology change. The most useful BMS benchmark set connects battery demand with the electronics and software needed to control that demand.
The numbers that define the BMS market
- Market sand Markets estimates the global BMS market at USD 9.10 billion in 2024 and USD 21.00 billion by 2030.
- The same forecast implies a 14.6% CAGR and about USD 11.90 billion of additional market value between 2024 and 2030.
- Marcantel estimates the global BMS market at USD 8.56 billion in 2024 and USD 25.31 billion by 2030.
- Marcantel’s forecast implies a 19.8% CAGR and roughly a threefold increase from 2024 to 2030.
- Grand View Research places the market at USD 10.17 billion in 2025 and USD 66.09 billion by 2033.
- Research Nester projects a longer-term BMS market value of USD 86.9 billion by 2035.
- Asia-Pacific is expected to be the largest BMS region with a 48.5% share by 2035 in one regional outlook.
- Electric car sales exceeded 20 million worldwide in 2025, up 20% from 2024.
- Electric cars represented 25% of global car sales in 2025.
- Battery electric cars made up 65% of total electric car sales in 2025.
- China accounted for 60% of global EV battery deployment in 2025, compared with almost 15% for the European Union and 10% for the United States.
- Global electric two-wheeler sales rose 15% to nearly 10 million units in 2025.
- India electric two-wheeler sales reached 1.3 million units in 2025, while China sold more than 7 million electric two-wheelers.
- Modular topology held the largest share of the BMS market in Marcantel’s segmentation.
- BMS functions now extend beyond protection into state-of-health estimation, battery passport data support, cloud analytics, predictive maintenance, wireless connectivity, and cybersecurity monitoring.
Why BMS Has Become a Market-Scale Technology
BMS demand is rising because battery systems are becoming larger, more expensive, and more mission-critical. In an electric vehicle, the BMS helps protect one of the highest-value components in the car. In a stationary storage asset, it supports uptime, cell balancing, thermal control, and safe operation. In industrial and telecom systems, it helps batteries deliver power reliably in environments where maintenance windows may be limited.
The market has also changed because BMS is no longer only a hardware protection circuit. Advanced systems support diagnostics, cloud monitoring, wireless communication, cybersecurity, battery passport data, predictive maintenance, and integration with vehicle control units or energy-management systems. That shift makes BMS part of the software-defined battery stack.
Battery demand and safety signals
- Global electric car sales exceeded 20 million in 2025 and are projected around 23 million in 2026.
- EVs are expected to approach 30% of global car sales in 2026.
- The global EV fleet is nearly 80 million vehicles today and could reach as many as 510 million vehicles by 2035.
- More than 100 countries recorded electric car sales growth in 2025.
- In one-third of countries with EV sales growth, EVs represented at least 10% of new car sales.
- Southeast Asia annual EV sales more than doubled in 2025, with EV sales share reaching nearly 20%.
- Latin America EV sales grew by 75% in 2025.
- Average BEV battery size remained close to 70 kWh in the European Union in 2025.
- China battery pack prices were 30% lower than North America in 2025, while China prices were about 25% lower than Europe.
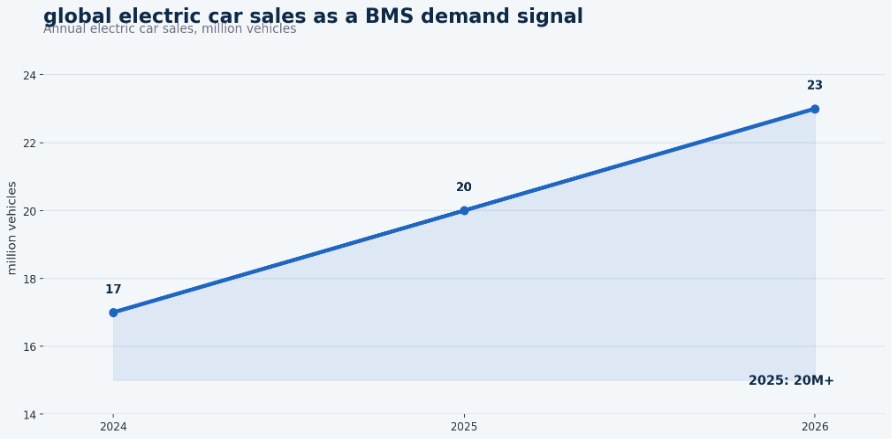
Figure 1. BMS demand rises with electric-vehicle sales because every large battery pack needs monitoring, safety control, and lifecycle management.
Global BMS Market Size and Forecast
Market-size forecasts should be read carefully because each source defines the BMS market differently. Some forecasts focus on automotive systems, while others include energy storage, consumer electronics, industrial batteries, sensors, software, installation, and services. This is why the most useful article compares several forecast views rather than relying on one headline number.
The overall direction is consistent: every cited market outlook points to strong BMS expansion. The difference is the scale of growth. Moderate forecasts show the market more than doubling by 2030, while longer-horizon forecasts show much larger expansion as EVs, stationary storage, software diagnostics, and connected battery platforms mature.
Market-size and forecast benchmarks
- Market sand Markets places the global BMS market at USD 9.10 billion in 2024 and USD 10.60 billion in 2025.
- The same forecast reaches USD 21.00 billion by 2030.
- MarkNtel places the global BMS market at USD 8.56 billion in 2024 and USD 25.31 billion by 2030.
- Grand View Research estimates USD 10.17 billion in 2025 and USD 66.09 billion by 2033.
- Research Nester estimates USD 14.2 billion in 2025 and USD 86.9 billion by 2035.
- Research Nester’s long-term forecast implies about USD 72.7 billion of additional value from 2025 to 2035.
- Precedence Research places the market at USD 9.54 billion in 2024 and USD 40.95 billion by 2034.
- Fortune Business Insights estimates the market at USD 10.2 billion in 2025 and USD 32.36 billion by 2032.
| Market view | Forecast signal | Article interpretation |
|---|---|---|
| MarketsandMarkets | USD 9.10B in 2024 | USD 21.00B by 2030 | 14.6% CAGR | Mainstream 2030 growth view |
| MarkNtel | USD 8.56B in 2024 | USD 25.31B by 2030 | 19.8% CAGR | Higher 2030 market value |
| Grand View | USD 10.17B in 2025 | USD 66.09B by 2033 | 27.1% CAGR | Longer-horizon acceleration |
| Research Nester | USD 14.2B in 2025 | USD 86.9B by 2035 | 22.3% CAGR | Largest long-term value |
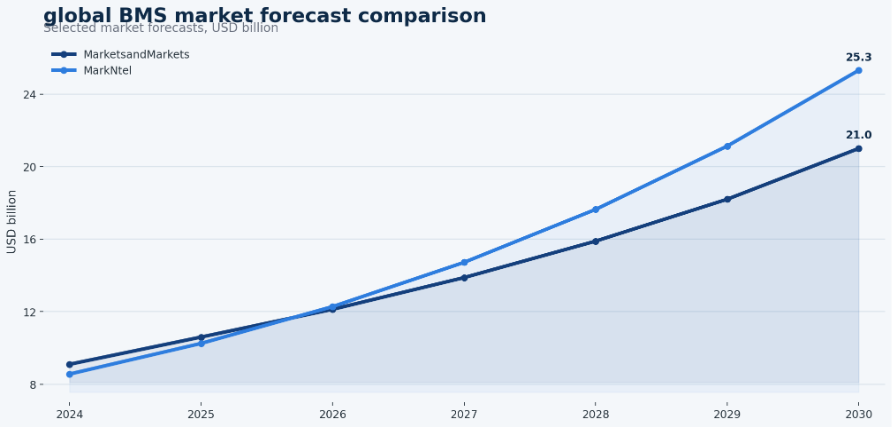
Figure 2. Global BMS market forecasts show strong growth, but source definitions affect the exact market value.
EV and Automotive BMS Demand
Electric vehicles are the main demand engine for advanced battery management systems. A passenger EV battery pack can contain thousands of cells and must be managed for voltage, temperature, current, charging speed, safety, degradation, and warranty. A weak BMS can reduce usable range, slow charging, accelerate battery wear, or create safety risk.
EV growth also changes the value of BMS data. Automakers need pack-level data for warranty analytics, safety validation, charging behavior, diagnostics, over-the-air software updates, and second-life battery decisions. As vehicles become more software-defined, the BMS becomes part of the vehicle intelligence layer rather than a passive electronics board.
EV demand benchmarks
- Electric car sales topped 17 million worldwide in 2024 and exceeded 20 million in 2025.
- Global electric car sales grew by more than 25% in 2024 and by 20% in 2025.
- The 3.5 million additional electric cars sold in 2024 versus 2023 exceeded all electric car sales in 2020.
- China electric car sales exceeded 11 million in 2024.
- Battery electric cars accounted for 65% of total electric car sales in 2025.
- Extended-range EVs dropped below 7% of total electric car sales in 2025.
- China accounted for 60% of global EV battery deployment in 2025.
- The European Union accounted for almost 15% of global EV battery deployment in 2025.
- The United States accounted for 10% of global EV battery deployment in 2025.
- EMDEs excluding China accounted for 6% of global EV battery deployment in 2025.
| EV market signal | Why it matters for BMS |
|---|---|
| Rising EV sales | More battery packs need monitoring and control |
| Larger packs | More cells increase balancing complexity |
| Fast charging | Thermal and voltage control become critical |
| Warranty pressure | BMS data supports performance claims |
| Safety regulation | Monitoring reduces pack-level risk |
| Software-defined vehicles | BMS becomes part of vehicle intelligence |
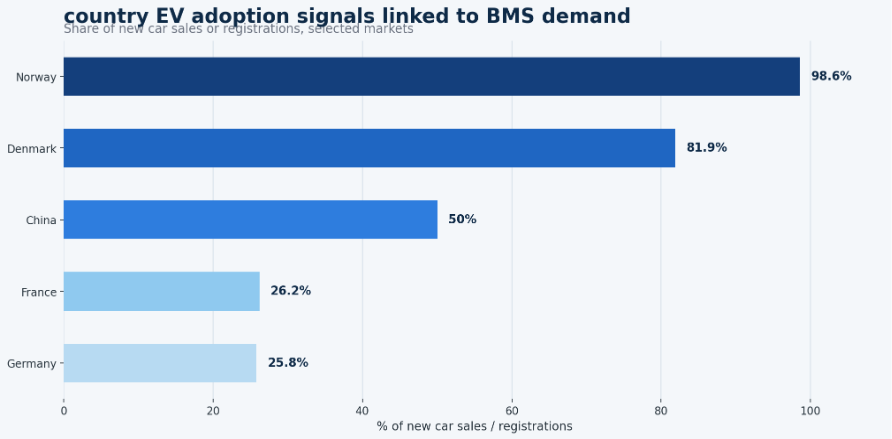
Figure 3. Country EV adoption signals show where automotive BMS demand and pack-control requirements are strongest.
Energy Storage and Stationary BMS Demand
Stationary batteries create a second growth engine for BMS suppliers. Grid-scale storage systems, commercial batteries, residential solar batteries, telecom backup, and data-center backup systems all need safe and reliable battery control. The BMS must monitor cells, manage operating limits, support thermal safety, identify faults, and communicate with higher-level energy-management systems.
Stationary storage also changes the BMS value proposition. In an EV, BMS performance affects range and vehicle safety. In a storage project, it affects uptime, bankability, fire risk, warranty, grid-service revenue, and asset life. That makes BMS reliability important to developers, utilities, lenders, insurers, and operators.
Stationary storage benchmarks
- IEA coverage in the workbook shows battery and storage deployment as a key demand driver for BMS functions.
- Utility-scale energy storage increases demand for BMS systems that can support cell monitoring, diagnostics, uptime, and system communication.
- Commercial storage systems need BMS support for demand-charge management, backup power, and safe operation.
- Residential storage systems need compact, cost-efficient, and reliable BMS designs for solar self-consumption and backup power.
- Data centers create a high-reliability battery-management use case because backup power depends on rapid response and battery health visibility.
- Telecom backup batteries need BMS systems that support remote operation and low-maintenance monitoring.
- Industrial batteries need BMS support for heavy-duty cycling, rugged environments, diagnostics, and lifecycle control.
| Application | BMS role | Market implication |
|---|---|---|
| Utility-scale BESS | Safety, uptime, cell monitoring | Advanced BMS and EMS integration |
| Commercial storage | Peak control and backup | Supports savings and resilience |
| Residential storage | Solar storage and backup | Compact, reliable systems |
| Data centers | Backup power reliability | Fast response and monitoring |
| Telecom backup | Remote uptime | Low-maintenance control |
| Industrial batteries | Heavy-duty cycling | Diagnostics and durability |
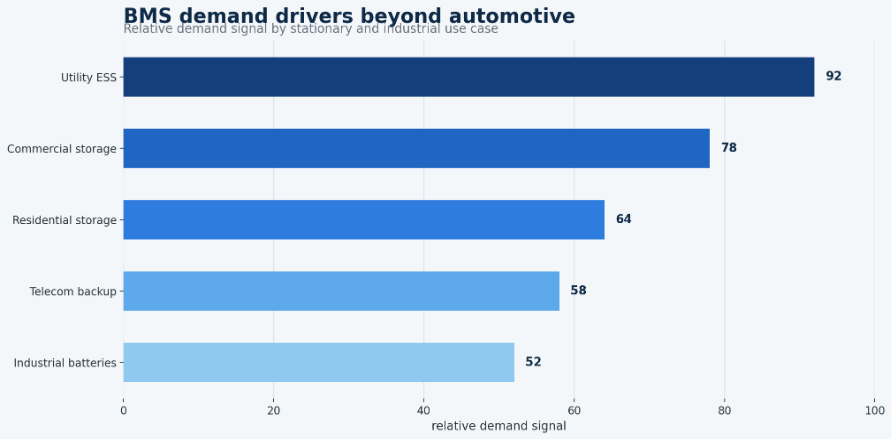
Figure 4. Stationary storage adds a second growth engine for BMS suppliers beyond electric vehicles.
Regional BMS Market Intelligence
Regional BMS data matters because battery demand is not distributed evenly. Asia-Pacific has the strongest combination of EV scale, battery manufacturing, electronics production, and energy-storage demand. North America is shaped by EV production, grid storage, battery plants, and high-value safety requirements. Europe is influenced by automotive regulation, battery rules, EV adoption, and OEM quality standards. Latin America and the Middle East & Africa remain smaller but important for automotive supply chains, storage, backup power, and reliability-led demand.
Regional market benchmarks
- Asia-Pacific is expected to be the largest BMS region with a 48.5% share by 2035 in one outlook.
- If Asia-Pacific holds 48.5% of a USD 86.9 billion 2035 BMS market, its implied regional value is about USD 42.15 billion.
- An illustrative North America allocation of 22.0% of the same 2035 market equals about USD 19.12 billion.
- An illustrative Europe allocation of 20.0% equals about USD 17.38 billion.
- An illustrative Latin America allocation of 5.0% equals about USD 4.34 billion.
- An illustrative Middle East & Africa allocation of 4.5% equals about USD 3.91 billion.
- North America is cited as the fastest-growing BMS region in Research Nester’s regional outlook.
- MarkNtel identifies Asia-Pacific as the region presenting growth prospects during 2025-2030.
| Region | Core signal | Article interpretation |
|---|---|---|
| Asia-Pacific | EV scale and manufacturing | China, India, Japan, Korea | Largest growth engine |
| North America | EVs, ESS, battery plants | U.S. and Canada | High-value growth market |
| Europe | EV regulation and OEM transition | Germany, France, Norway, UK | Compliance-led demand |
| Latin America | EV and auto manufacturing | Brazil and Mexico | Emerging demand base |
| Middle East & Africa | Backup power and renewables | Reliability signals | Early-stage growth |
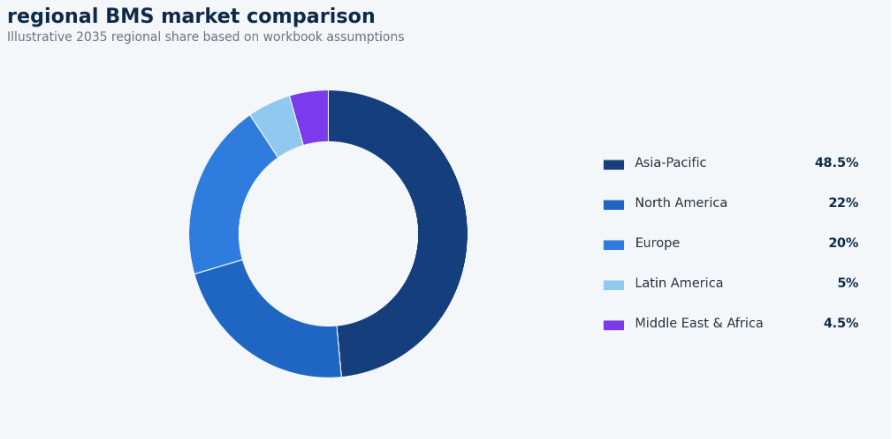
Figure 5. Regional BMS market comparison shows why Asia-Pacific leads while North America and Europe remain high-value markets.
Country-Level BMS Statistics
Country statistics make the market more concrete because each country creates BMS demand in a different way. China creates scale through EV sales and battery manufacturing. The United States creates high-value demand through EVs, grid storage, and battery plants. India creates future demand through two-wheelers, three-wheelers, storage, and domestic manufacturing. Europe includes mature EV adoption markets and major automotive manufacturing countries.
China
- Over half of new cars sold in China were electric in 2025.
- China electric car sales exceeded 11 million in 2024.
- China represented 60% of global EV battery deployment in 2025.
- Average BEV battery size remained below 60 kWh in China in 2025.
- Average plug-in hybrid battery size in China increased by almost 10% in 2025 and reached more than 25 kWh.
- China sold more than 7 million electric two-wheelers in 2025.
China is the scale benchmark for BMS demand because it combines EV sales, battery manufacturing, two-wheeler electrification, and large battery deployment.
United States
- The United States accounted for 10% of global EV battery deployment in 2025.
- The U.S. is listed among dominating BMS countries in Research Nester’s market outlook.
- North America is cited as the fastest-growing BMS region in the same regional outlook.
- Illustrative North America BMS value reaches about USD 19.12 billion by 2035 under the regional allocation used in the workbook.
- U.S. demand is tied to EV production, energy storage, battery plants, safety standards, and software-defined vehicle platforms.
The U.S. BMS opportunity is a high-value market where automotive electrification and stationary storage both matter.
India
- India is listed among emerging BMS countries in Research Nester’s market outlook.
- India electric two-wheeler sales reached 1.3 million units in 2025.
- Electric two-wheelers represented about 6% of India’s total two-wheeler sales in 2025.
- Over two-thirds of three-wheelers sold domestically in India in 2025 were electric.
- China, India and Türkiye accounted for over 95% of electric three-wheeler sales in 2025.
- India’s future BMS demand is linked to two-wheelers, three-wheelers, buses, passenger EVs, storage, and local battery manufacturing.
India is a future-demand market where small mobility, commercial mobility, and energy storage can expand BMS volume quickly.
Germany, France, Norway and Denmark
- BEVs made up 25.8% of German new registrations in April 2026.
- BEVs made up 26.2% of French new registrations in April 2026.
- BEVs made up 98.6% of Norwegian new registrations in April 2026.
- BEVs made up 81.9% of Danish new registrations in April 2026.
- BEV registrations reached 201,541 in April 2026 across 15 European countries.
- BEV registrations grew 34.1% year over year in April 2026 across those 15 European countries.
- BEV registrations totaled 740,021 in the first four months of 2026 across 15 European countries.
Europe shows both mature EV adoption and regulation-led quality demand, which makes BMS performance, safety, and data compliance important.
Japan and South Korea
- Japan is listed among dominating BMS countries in Research Nester’s market outlook.
- South Korea is listed among dominating BMS countries in the same market outlook.
- Both countries are important because of battery manufacturing, automotive technology, electronics, and advanced battery ecosystems.
- BMS demand in Japan is linked to hybrid and EV platforms, industrial batteries, consumer electronics, and energy storage.
- BMS demand in South Korea is linked to battery suppliers, EV platforms, and high-end pack technology.
Japan and South Korea matter less as pure adoption stories and more as technology, manufacturing, and supplier ecosystems.
Australia, Canada, Brazil, Mexico, Indonesia and Vietnam
- Australia and Canada are included in the workbook as country-level demand-signal markets tied to EVs, storage, and supply chains.
- Brazil and Mexico are listed among emerging BMS countries in Research Nester’s market outlook.
- Indonesia and Vietnam are also listed among emerging BMS countries.
- Southeast Asia annual EV sales more than doubled in 2025, with EV share reaching nearly 20%.
- Latin America EV sales grew by 75% in 2025.
- These markets are smaller than China, the U.S., and Europe, but they help broaden BMS demand beyond the largest EV economies.
Emerging markets can create BMS demand through two-wheelers, local assembly, battery materials, storage projects, and backup-power applications.
| Country / market | Key signal | Best article angle |
|---|---|---|
| China | EV and battery manufacturing scale | High-volume demand | Scale leader |
| United States | EVs, ESS, battery plants | High-value demand | Policy and storage growth |
| India | Two-wheelers and storage expansion | Future demand | Small mobility and storage |
| Germany / France | Automotive OEM transition | Premium BMS demand | Regulation and quality |
| Norway / Denmark | High EV penetration | Adoption benchmark | Mature EV use case |
| Japan / South Korea | Battery technology ecosystems | Supplier role | Advanced battery platforms |
BMS by Application
The BMS market should not be treated as one application. Automotive BMS prioritizes range, charging, safety, and warranty. Energy-storage BMS prioritizes uptime, fire-risk control, remote monitoring, and asset life. Consumer electronics BMS prioritizes size and cost. Industrial and telecom systems prioritize durability and low-maintenance reliability.
Application demand signals
- EVs are the largest growth driver because every electric vehicle requires pack-level control and monitoring.
- Energy storage systems create a fast-growing second driver as stationary batteries become grid and backup-power assets.
- Consumer electronics remain a mature high-volume BMS use case, but individual systems are smaller and lower value than EV or ESS packs.
- Industrial batteries require BMS designs that can support rugged duty cycles and longer service lives.
- Telecom and backup-power systems need BMS support for remote reliability and low maintenance.
- Battery type coverage in MarkNtel’s segmentation includes lithium-ion, lead-acid, nickel, flow, and other batteries.
| Application | BMS priority | Market signal |
|---|---|---|
| EVs | Automakers | Range, charging, safety | Largest growth driver |
| ESS | Utilities and developers | Uptime and safety | Fast-growing second driver |
| Consumer electronics | Device makers | Compact control | Mature high-volume market |
| Industrial batteries | Equipment operators | Durability | Reliability-led demand |
| Telecom / backup | Infrastructure owners | Low maintenance | Resilience-driven demand |
BMS Technology, Safety and Software Trends
BMS architecture is moving from basic monitoring toward connected battery intelligence. Centralized systems remain useful in simpler packs, while modular, distributed, wireless, AI-enabled, and cloud-connected systems become more important as packs grow larger and more complex. The technology trend is not only about hardware; it is also about diagnostics, data quality, cybersecurity, and lifecycle analytics.
Safety is the central reason these technologies matter. A BMS helps prevent overcharge, over-discharge, over-current, short-circuit conditions, overheating, and cell imbalance. It also helps estimate state of charge and state of health, log data, communicate faults, support battery passport reporting, and provide evidence for warranty or second-life decisions.
Architecture and safety benchmarks
- Modular topology held the largest share of the BMS market in MarkNtel’s segmentation.
- BMS systems support state of charge monitoring, making the electronics and software layer central to battery performance.
- BMS systems support state of health estimation, which affects warranty, resale, and second-life assessment.
- Cell balancing remains a core BMS function because imbalanced cells reduce usable pack performance.
- Thermal monitoring and thermal runaway mitigation are critical as battery packs become larger and more energy dense.
- BMS systems support over-voltage, under-voltage, over-current, short-circuit, charge-control, and discharge-control protections.
- Advanced systems now support data logging, vehicle-control communication, fault diagnostics, isolation monitoring, cloud analytics, predictive maintenance, wireless BMS connectivity, and cybersecurity monitoring.
| Technology / issue | Current role and strength | Limitation |
|---|---|---|
| Centralized BMS | Simple packs | Lower cost | Less scalable |
| Distributed BMS | Larger packs | Module-level control | More components |
| Modular BMS | Flexible packs | Easier scaling | Integration complexity |
| Wireless BMS | Advanced EV packs | Less wiring | Validation and cybersecurity |
| AI-enabled BMS | Diagnostics layer | Better prediction | Data quality matters |
| Cloud-connected BMS | Fleet monitoring | Remote insights | Connectivity and privacy |
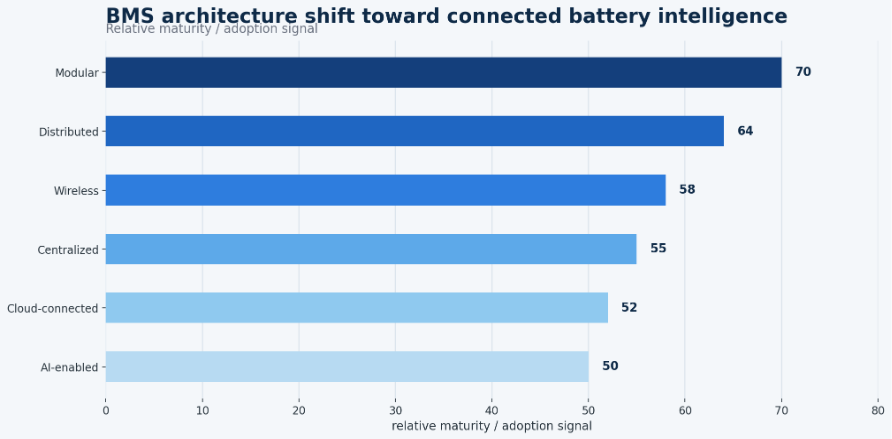
Figure 6. BMS architecture is shifting toward connected battery intelligence as packs become larger, more digital, and more safety-critical.
Supply Chain, Manufacturing and Vendors
BMS demand depends on more than battery volume. It also depends on battery cells, pack design, sensors, semiconductors, microcontrollers, communication chips, software, testing, validation, and OEM integration. A BMS supplier must fit the battery chemistry, pack architecture, communication protocol, safety requirements, and cost target of the final product.
The supplier landscape is broad because BMS touches battery manufacturing, automotive electronics, industrial power systems, and software. The workbook source index lists several named BMS market players and semiconductor or engineering companies, including NXP Semiconductor, Nuvation Engineering, Elithion, Johnson Matthey, Ventec, Venture, and Linear Technologies.
| Layer | Examples | Why it matters |
|---|---|---|
| Battery cells | LFP, NMC, sodium-ion | Chemistry affects monitoring |
| Modules | Pack architecture | Determines BMS complexity |
| Sensors | Voltage, current, temperature | Enables accurate control |
| Semiconductors | ICs, MCUs, chips | Core BMS hardware |
| Software | Algorithms and diagnostics | Growing value layer |
| OEM integration | Vehicles and ESS | Controls system fit |
Battery Chemistry and Pack Architecture Implications
Battery chemistry and pack architecture influence what a BMS must measure, how often it must communicate, and how much intelligence is needed at the cell, module, pack, and system levels. Lithium-ion systems dominate many EV and storage applications, but the BMS market is not limited to one chemistry. Lead-acid, nickel, flow, sodium-ion, and other battery types create different monitoring needs, cost pressures, communication requirements, and safety rules.
Architecture is just as important as chemistry. A small consumer battery may use a simpler control board, while an EV or utility-scale storage project may need module-level sensing, isolation monitoring, contactor control, redundancy, fault logging, thermal monitoring, and communication with a vehicle control unit, inverter, charger, energy-management system, or cloud platform. That is why BMS market statistics should not only count battery units. They should also consider pack size, voltage level, cell count, safety requirements, and software complexity.
Chemistry and architecture signals
- MarkNtel segments the BMS market by battery type including lithium-ion, lead-acid, nickel, flow, and other batteries.
- Lithium-ion remains the central growth chemistry for EVs and many stationary storage applications because of energy density, manufacturing scale, and performance.
- Lead-acid batteries still create BMS and monitoring opportunities in backup power, telecom, industrial, and legacy battery applications.
- Flow batteries create a different BMS and control profile because they are often linked to longer-duration stationary storage and balance-of-plant control.
- Battery chemistry affects voltage windows, thermal behavior, degradation profiles, charge limits, and safety monitoring logic.
- Battery architecture affects whether centralized, distributed, modular, wireless, or hybrid BMS approaches are more practical.
| Design factor | Why it matters | BMS implication |
|---|---|---|
| Battery chemistry | Different voltage and thermal behavior | Control logic must be chemistry-specific |
| Pack size | More cells and modules | More sensing and balancing points |
| Voltage level | Higher energy and safety risk | Stronger isolation and protection |
| System duration | Longer storage operation | More lifecycle and thermal monitoring |
| Communication layer | Vehicle or ESS integration | More software and protocol needs |
| Warranty model | Performance commitments | Better state-of-health data |
Battery Data, Cybersecurity and Lifecycle Analytics
The next stage of BMS growth is increasingly data-driven. A modern battery management system does not only react to voltage or temperature limits; it collects operating evidence across charging cycles, driving behavior, thermal events, depth of discharge, calendar aging, and fault history. That data helps automakers, storage operators, insurers, warranty teams, and second-life battery buyers understand whether a pack is healthy, stressed, underused, or approaching a higher-risk operating profile.
This matters because battery value is no longer fixed at the point of sale. EV fleets, grid-storage projects, and industrial batteries all depend on lifetime performance. A BMS that produces accurate state-of-health data can support better charging strategies, more reliable warranty decisions, safer second-life screening, and stronger residual-value confidence. A weak data layer can create the opposite problem: unexplained degradation, unnecessary pack replacements, poor fault diagnosis, and lower trust in battery assets.
Data and analytics benchmarks
- State-of-health estimation is becoming one of the most important BMS software functions because it links battery use to warranty value, resale value, and second-life eligibility.
- Cloud-connected BMS platforms can help fleet operators compare battery performance across vehicles, chargers, climates, routes, and operating profiles.
- Predictive analytics can reduce maintenance risk by identifying abnormal cell behavior before it becomes a pack-level fault.
- Battery passport requirements increase the value of traceable data because manufacturers and operators need cleaner information about battery identity, chemistry, performance, and lifecycle status.
- Wireless BMS designs can reduce harness complexity, but they also raise the importance of communication reliability, validation, and cybersecurity controls.
- Cybersecurity becomes more important as BMS data moves through vehicles, cloud platforms, chargers, energy-management systems, and remote operations centers.
- Second-life battery markets depend on trusted BMS data because used packs need evidence of remaining capacity, degradation history, safety events, and operating conditions.
| Data layer | Why it matters | BMS implication |
|---|---|---|
| State of health | Shows remaining battery condition | Supports warranty and resale decisions |
| Fault history | Records abnormal events | Improves diagnostics and safety review |
| Thermal history | Tracks heat exposure | Helps prevent accelerated degradation |
| Charging behavior | Shows pack stress patterns | Improves charging strategy |
| Cloud analytics | Compares many assets | Enables fleet-level insights |
| Cybersecurity | Protects connected control | Reduces data and safety risk |
How to Read BMS Statistics Without Overstating the Market
Battery management system statistics can be misleading if every number is treated the same way. Market value, EV sales, battery demand, installed storage capacity, regional share, supplier lists, and technology adoption all describe different parts of the market. A forecast may show strong revenue growth, but that does not reveal whether demand is coming from EVs, stationary storage, consumer electronics, industrial systems, or software services.
Country comparisons also need careful labeling. China may dominate EV battery deployment, Norway may lead in EV sales share, the United States may have high-value battery and storage demand, and South Korea may matter because of its battery-manufacturing ecosystem. These are all meaningful BMS signals, but they are not the same type of statistic. A polished statistics article should explain whether the number measures adoption, production, deployment, forecast value, technology mix, or future opportunity.
Measurement rules for BMS statistics
- Market value shows commercial spending, but it does not show the number of battery packs or cells being managed.
- EV sales show pack volume, but they do not show pack size, chemistry, voltage, or BMS software complexity.
- Battery demand in GWh is closer to physical battery opportunity, but it still needs application context.
- Regional share shows concentration, but it can hide differences between manufacturing, adoption, storage, and supplier ecosystems.
- Country EV share is useful for adoption maturity, while country battery deployment is more useful for BMS addressable demand.
- Technology trend statistics should be separated from current adoption because wireless and AI-enabled BMS may be high-growth without yet being dominant.
| Statistic type | Best use | Common mistake |
|---|---|---|
| Market value | Shows commercial scale | Treating it as installed battery volume |
| EV sales | Shows vehicle pack demand | Ignoring battery size and chemistry |
| Battery demand in GWh | Shows physical battery scale | Ignoring application and voltage level |
| Regional share | Shows market concentration | Assuming the same drivers everywhere |
| Technology trend | Shows architecture shift | Confusing emerging demand with dominance |
| Supplier list | Shows ecosystem breadth | Treating presence as market share |
BMS Market Risks and Challenges
The BMS market has strong demand, but suppliers still face important risks. Automakers and storage developers want safer and smarter systems, but they also pressure suppliers on cost. Connected BMS platforms create cybersecurity and data-quality concerns. Chemistry diversity requires flexible control logic. Regulation increases reporting needs. Semiconductor and sensor supply can affect production timing.
| Risk | Why it matters | How the market responds |
|---|---|---|
| Cost pressure | OEMs need affordable packs | Scale and integration |
| Safety failures | Damage trust and compliance | Better validation |
| Cybersecurity | Connected BMS adds risk | Secure communication |
| Data quality | Poor data weakens diagnostics | Better sensors |
| Chemistry diversity | Different batteries need different logic | Flexible architecture |
| Regulation | Raises reporting needs | Traceability features |
| Chip supply | Can slow production | Supplier diversification |
BMS Market Diagnostic Model
A reference-style statistics article should connect numbers to practical questions. A market-value figure answers how large the commercial opportunity may become. EV sales show how many battery packs need control. Battery deployment shares show where the physical demand sits. Technology stats show how BMS architecture is changing. Safety and regulation data show why BMS quality matters.
| Market question | Metric to check | Useful benchmark |
|---|---|---|
| Is the market scaling fast enough? | Market value and CAGR | Global BMS forecasts |
| Which application leads demand? | EV, ESS and electronics mix | Automotive and storage stats |
| Which regions lead growth? | Regional value and share | APAC, North America, Europe |
| Which countries matter most? | EV sales and battery demand | China, U.S., India, Germany |
| Is technology shifting? | Wireless and AI BMS adoption | Technology trend stats |
| Is safety driving adoption? | Regulation and warranty needs | Safety benchmarks |
| Is the market investable? | OEM and supplier activity | Manufacturing and vendor stats |
90-Day BMS Market Review Plan
A practical BMS market review can be organized into a 90-day cycle. The first month should establish the baseline market and demand map. The second month should compare regional and country-level opportunity. The third month should test technology trends, safety rules, supplier positioning, and market risks.
| Timing | What to analyze | Output |
|---|---|---|
| Days 1-30 | Global forecasts, EV demand, ESS demand, and application mix | Baseline market map |
| Days 31-60 | Regional and country-level demand signals | Opportunity ranking |
| Days 61-90 | Technology, safety, vendor, and risk trends | Practical market outlook |
Metrics BMS Market Analysts Should Track
A mature BMS scorecard should be detailed enough to locate demand without becoming a vanity dashboard. Market value shows commercial scale, but it does not show where battery packs are being built. EV sales show mobility demand, but they do not capture stationary storage. Battery demand in GWh shows physical opportunity, but it does not show technology complexity or software value.
| Metric | Why it matters |
|---|---|
| Global BMS market value | Shows commercial scale |
| CAGR | Shows growth speed |
| Automotive BMS share | Shows EV dependence |
| ESS BMS demand | Shows storage opportunity |
| Regional market value | Shows demand concentration |
| Country EV sales | Shows pack-level demand |
| Battery demand in GWh | Shows addressable opportunity |
| Battery manufacturing capacity | Shows supply-side strength |
| Wireless BMS adoption | Shows technology shift |
| Safety and regulation signals | Shows compliance demand |
| Software diagnostics adoption | Shows value beyond hardware |
| Supplier partnerships | Shows commercialization strength |
Common questions
- What is the battery management system market?
The BMS market includes hardware, sensors, software, and control systems used to monitor, protect, and optimize rechargeable batteries. It covers EVs, energy storage, consumer electronics, industrial batteries, telecom backup, and other battery-powered systems.
- How large is the global BMS market?
Forecasts vary by source. Market sand Markets places the market at USD 9.10 billion in 2024 and USD 21.00 billion by 2030, while Marcantel forecasts USD 25.31 billion by 2030. Longer-term estimates are higher, including USD 66.09 billion by 2033 and USD 86.9 billion by 2035.
- Why is EV growth important for BMS demand?
EV battery packs are large, expensive, safety-critical, and software-managed. More EV sales mean more battery packs that need voltage monitoring, thermal control, cell balancing, fault diagnostics, charging management, and state-of-health tracking.
- Which region leads the BMS market?
Asia-Pacific is the strongest region in the workbook outlook because of China’s EV scale, battery manufacturing, electronics production, and storage growth. North America and Europe remain high-value markets because of EV production, safety standards, and regulation.
- How does stationary storage affect BMS demand?
Grid-scale and commercial batteries need BMS for safety, uptime, cell balancing, remote monitoring, and lifecycle control. As storage assets become larger, BMS reliability becomes important to project bankability and revenue protection.
- What is wireless BMS?
Wireless BMS reduces wiring inside battery packs and can improve design flexibility, weight, and assembly efficiency. It also requires strong validation, cybersecurity, communication reliability, and safety testing.
- Why is BMS important for battery safety?
A BMS helps prevent unsafe conditions by monitoring voltage, current, temperature, state of charge, and state of health. It also supports over-voltage protection, under-voltage protection, over-current protection, short-circuit protection, thermal alerts, and fault diagnostics.
Final Takeaway
Battery management systems are becoming essential to the global battery economy. The headline numbers show a market moving from a specialized electronics category into a strategic control layer for EVs, energy storage, industrial systems, consumer devices, and backup-power infrastructure. Depending on the forecast source, the global BMS market may reach USD 21.00 billion by 2030, USD 25.31 billion by 2030, USD 66.09 billion by 2033, or USD 86.9 billion by 2035. The exact number varies, but the direction is clear: battery growth increases BMS demand.
EVs are the largest growth engine because every electric car needs a safe, reliable, and intelligent battery pack. Global electric car sales exceeded 20 million in 2025, EVs represented one-quarter of global car sales, and China accounted for 60% of global EV battery deployment. At the same time, stationary energy storage, commercial batteries, data centers, telecom backup, and industrial systems add a second layer of demand. These applications make BMS important not only for mobility but also for grid reliability, resilience, uptime, and asset management.
The strongest BMS analysis does not treat the market as one number. It separates global forecasts, EV demand, ESS demand, regional leadership, country-level adoption, application mix, architecture trends, software value, safety requirements, regulation, supply chain, and vendor capability. As batteries become larger, more connected, and more valuable, the BMS becomes the intelligence, safety, software, and diagnostics layer that helps the battery economy operate reliably.


