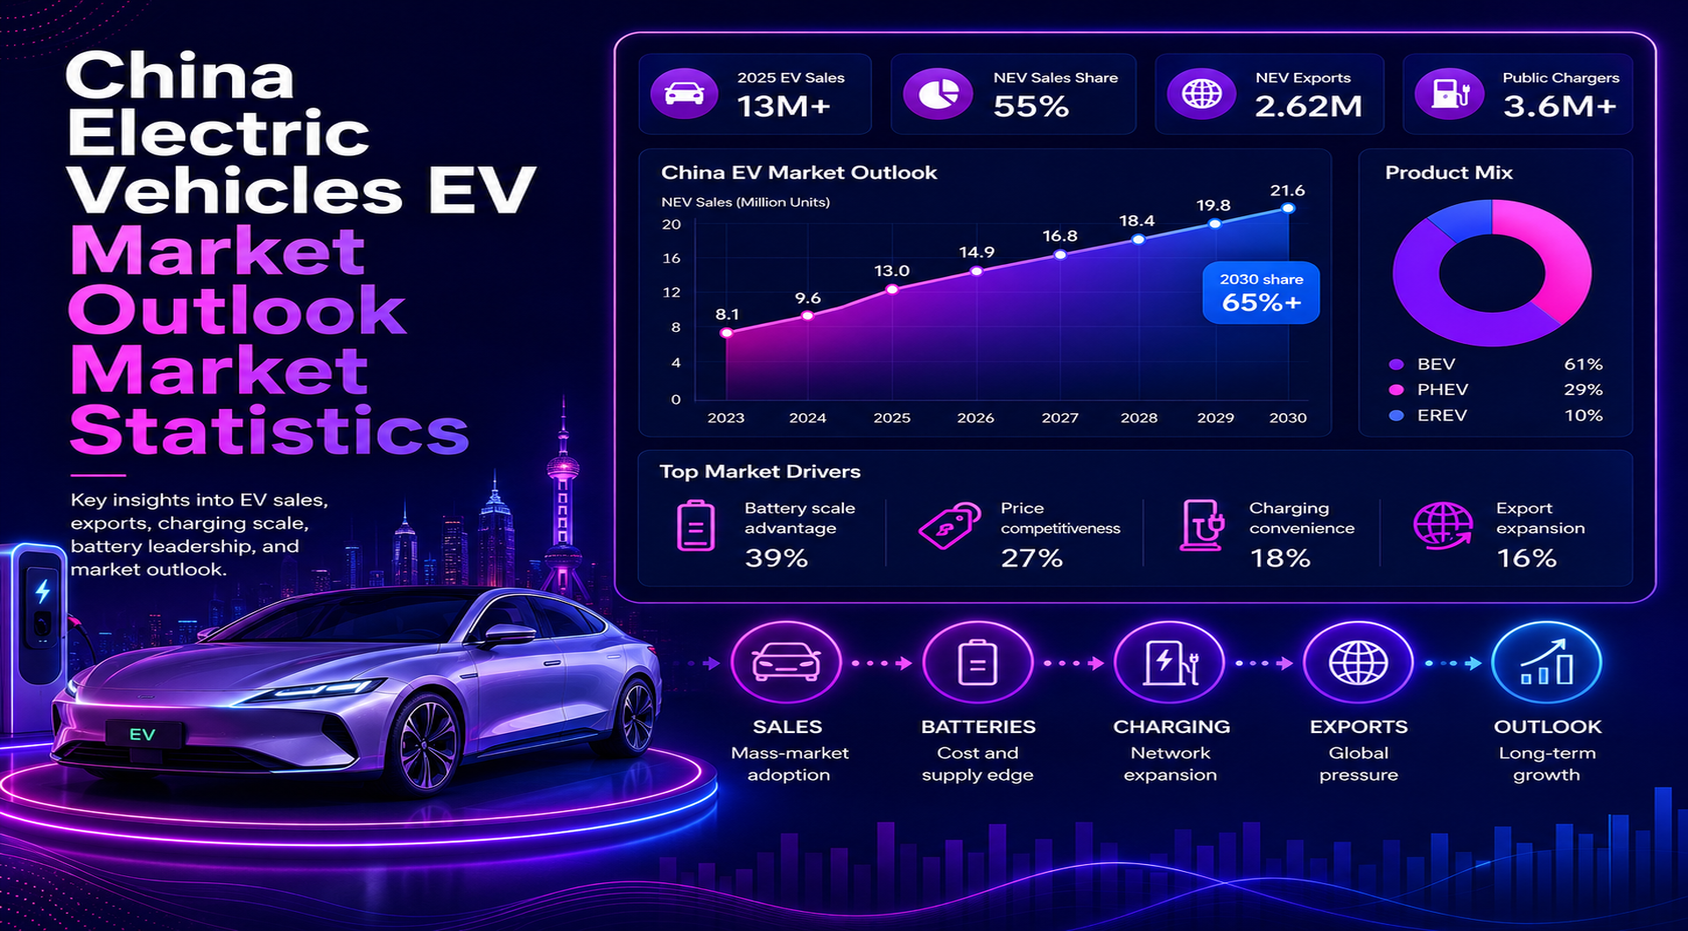
China is now the reference market for the global electric vehicle transition. Its EV story is no longer only about consumer adoption or government support. It is a market system built from high-volume sales, domestic production, batteries, charging infrastructure, export pressure, pricing competition, software-enabled vehicles, and policy discipline. That mix makes China the most important market to study when evaluating where the electric vehicle industry is heading next.
The strongest market signals point in the same direction. China sold more than 13 million electric cars in 2025 according to the IEA, while CAAM data reported 16.49 million new energy vehicle sales including exports. China’s electric car sales share was close to 55% of new-car sales in 2025, monthly share exceeded 50% in most months, and public charging points reached more than 4.7 million by year-end. At the same time, China’s EV exports doubled to more than 2.5 million units, turning domestic scale into a global competitive force.
This article is organized for fast scanning. Each section opens with a short explanation, then uses curated benchmark statistics, a chart or table, and an editorial readout to show which numbers matter for China’s EV outlook.
Executive China EV Market Benchmarks
The executive benchmarks show why China’s EV market cannot be understood through sales volume alone. The market is large, but the more important point is that every supporting system around EV adoption has also scaled. China has the buyers, factories, batteries, chargers, brands, and export channels needed to shape global EV economics.
The numbers that define the China EV outlook
• China sold more than 13 million electric cars in 2025, maintaining its position as the world’s largest electric car market.
• Close to 55% of new cars sold in China were electric in 2025, showing that EVs have moved into mainstream new-car buying.
• CAAM data reported 16.49 million China NEV sales in 2025 including exports, up 28.2% year over year.
• China’s December 2025 NEV sales reached 1.71 million units, a high-volume monthly signal at the end of the year.
• China exported 2.62 million NEVs in 2025, doubling year over year and making exports a larger part of the market outlook.
• China produced about 16 million electric cars in 2025, outstripping domestic demand by roughly 20%.
• China accounted for nearly 75% of global electric car production in 2025, according to the IEA manufacturing outlook.
• China represented more than 80% of global battery cell production in 2025, reinforcing its EV cost advantage.
• China had more than 4.7 million public charge points at the end of 2025, representing more than 65% of the global public charging stock.
• CATL produced 464.7 GWh of EV batteries in 2025 and reached 39.2% global EV battery market share.
• China had nearly 700 electric car models available at the end of 2025, after model availability increased around 25% during the year.
• The IEA expects China’s electric car sales share to approach 60% in 2026, even as growth slows from earlier breakout years.
| Benchmark area | Current signal | Why it matters |
|---|---|---|
| Sales scale | More than 13 million electric cars sold in 2025 | Sets the demand benchmark. |
| Market share | Close to 55% of new-car sales were electric | Shows mainstream adoption. |
| Production | About 16 million electric cars produced in 2025 | Scale supports price competition and exports. |
| Exports | 2.62 million NEVs exported in 2025 | Domestic capacity is moving into global markets. |
| Charging | 4.7 million public charge points | Infrastructure supports mass adoption and fleet use. |
| Battery supply | CATL and BYD together held 55.6% of global EV battery installations | Battery scale supports cost control. |
China EV Sales: Where Market Scale Became the Main Story
China’s EV sales curve is the first signal to review because it shows the transition from early adoption to mass-market volume. The market did not simply grow in a straight line. It accelerated after 2020, widened through plug-in hybrids and range-extended formats, and finished 2025 with a monthly sales base that would have looked like an annual market only a few years earlier.
Sales growth benchmarks
• China annual NEV sales rose from about 1.32 million units in 2020 to 16.49 million units in 2025.
• China NEV sales grew 28.2% in 2025, faster than the overall automotive market’s 9.4% growth.
• China monthly NEV sales reached 1.71 million units in December 2025, compared with 408,000 units in January 2023.
• Monthly electric car sales exceeded a 50% sales share in 11 out of 12 months in 2025, compared with only five months in 2024.
• China accounted for about six out of every ten electric cars sold globally in 2025.
• The IEA expects global electric car sales to reach 23 million in 2026, with China still the largest single market.
• China’s 2026 electric car sales share is expected to reach almost 60%, though growth is projected to be slower than in earlier years.
• The strongest sales signal is not only unit volume; it is the fact that EVs are becoming the default growth engine within China’s broader car market.
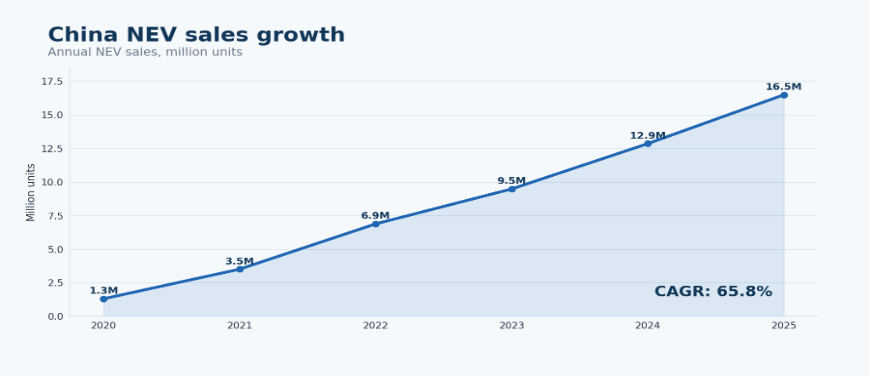
Figure 1. China EV sales growth shows the move from early scale to mass-market volume.
| Year | Sales signal | Market meaning |
|---|---|---|
| 2020 | 1.32 million NEVs | Early scale stage after policy-supported market building. |
| 2021 | Rapid acceleration | Consumer adoption widened and more domestic models entered the market. |
| 2022 | Breakout volume | EVs became a serious replacement category for ICE vehicles. |
| 2023 | High-volume expansion | Monthly data showed EVs moving beyond niche demand. |
| 2024 | Broader adoption | EV share repeatedly crossed the 50% monthly threshold. |
| 2025 | 16.49 million NEVs | China reached majority-style EV behavior in new-car buying. |
EV Adoption: How China Moved Toward Majority-Share Sales
Market share is more important than volume when judging adoption maturity. China’s car market is already large, so high unit sales can exist even when penetration is moderate. The turning point came when EVs began taking a majority-like share of monthly new-car sales, making electric vehicles a normal buying option rather than a separate technology category.
Adoption and penetration benchmarks
• China’s electric car sales share reached close to 55% in 2025, making it the strongest large-market adoption signal globally.
• China monthly NEV penetration reached 52.3% in December 2025, confirming that the year ended above the majority threshold.
• In preliminary April 2026 data, electric car sales in China grew to a record high of over 60% of total car sales.
• BEVs represented 70.5% of China NEV wholesale sales in 2023, while PHEVs represented 29.5%.
• The BEV share declined as PHEVs grew, showing that transition-friendly formats have become more important in recent adoption.
• China had nearly 700 electric car models available at the end of 2025, giving consumers unusually broad choice across segments.
• China had 60% more electric models than conventional models at the end of 2025, a sign that showroom availability now favors EVs.
• In China, 70% of battery electric cars sold in 2025 were already cheaper than the average conventional car, according to IEA analysis.
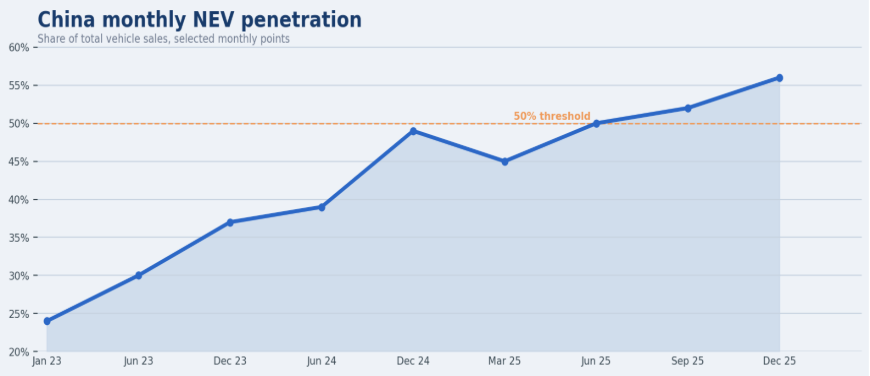
Figure 2. China NEV penetration shows how EVs moved toward majority-share sales.
| Adoption signal | What it measures | Why it matters |
|---|---|---|
| NEV penetration | EV share of total vehicle sales | Shows whether EVs are mainstream or niche. |
| BEV/PHEV mix | Fully electric versus plug-in hybrid demand | Reveals charging confidence and transition behavior. |
| Model availability | Number of EV choices in the market | More models make adoption easier across price tiers. |
| Price parity | EV prices versus ICE equivalents | Lower prices reduce the need for incentives. |
| Monthly share | Short-term share during active buying periods | Shows whether adoption is sustained, not seasonal. |
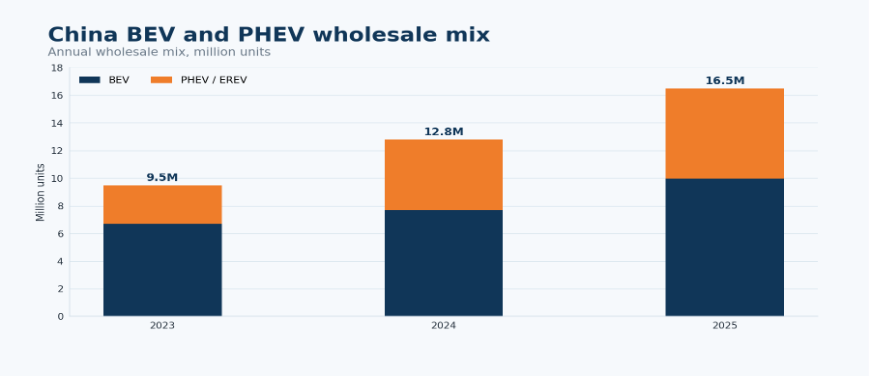
Figure 3. BEV and PHEV mix shows how plug-in hybrids expanded China’s adoption base.
Manufacturing Scale: Why China Controls the EV Cost Curve
China’s EV outlook is also a manufacturing outlook. The domestic market creates demand, but the factory system behind it creates cost pressure and export potential. When production grows faster than domestic demand, the excess capacity does not disappear. It turns into pricing pressure at home and export pressure abroad.
Production and industrial scale benchmarks
• China produced about 16 million electric cars in 2025, primarily led by domestic automakers.
• Global electric car production reached almost 22 million units in 2025, meaning China represented nearly three-quarters of global output.
• China’s 2025 production outstripped domestic demand by roughly 20%, according to IEA manufacturing and trade analysis.
• Electric cars were the primary driver of China’s car export growth in 2025, while conventional car exports remained relatively similar to 2024.
• China’s EV production ecosystem includes vehicle assembly, batteries, motors, power electronics, software, and charging-related suppliers.
• The number of electric car models available in China increased around 25% in 2025, strengthening competition across segments.
• Nearly 700 electric car models were available in China by the end of 2025, creating strong consumer choice but also intense brand pressure.
• China had 60% more electric models than conventional models at the end of 2025, showing how deeply product pipelines have shifted toward EVs.
| Manufacturing signal | Current outlook | Why it matters |
|---|---|---|
| Production | About 16 million electric cars in 2025 | Supports scale and exports. |
| Domestic suppliers | Batteries, motors, components, and electronics are locally deep | Reduces sourcing friction. |
| Model count | Nearly 700 EV models available | Expands choice and pressure. |
| Overcapacity risk | Production exceeded domestic demand | Drives discounts and exports. |
| Vertical integration | Batteries and vehicle production often sit close together | Improves cost control. |
EV Exports: How China Is Turning Domestic Scale Into Global Pressure
Exports are one of the clearest signs that China’s domestic EV ecosystem is now affecting the global auto market. Strong domestic production gives Chinese automakers more vehicles than the home market can absorb at comfortable margins. That makes export growth a strategy for volume, brand expansion, and factory utilization.
Export and trade benchmarks
• China exported 2.62 million NEVs in 2025, a 100% year-over-year increase according to CAAM data reported by CnEVPost.
• China’s December 2025 NEV exports reached 300,000 units, one of the clearest monthly signals of export momentum.
• IEA analysis says Chinese electric car exports doubled in 2025 to a record high of more than 2.5 million units.
• More than 35% of China’s car exports were EVs in 2025, up from 20% in 2024.
• Imports from China accounted for 55% of electric car sales in 2025 in countries outside Europe and the United States.
• More than half of electric cars sold in Southeast Asia in 2025 were by Chinese brands.
• China overtook the European Union in 2024 to become the largest exporter of cars, according to the IEA executive summary.
• Trade barriers, tariffs, localization rules, and national industrial policies are becoming central export risks for Chinese EV makers.
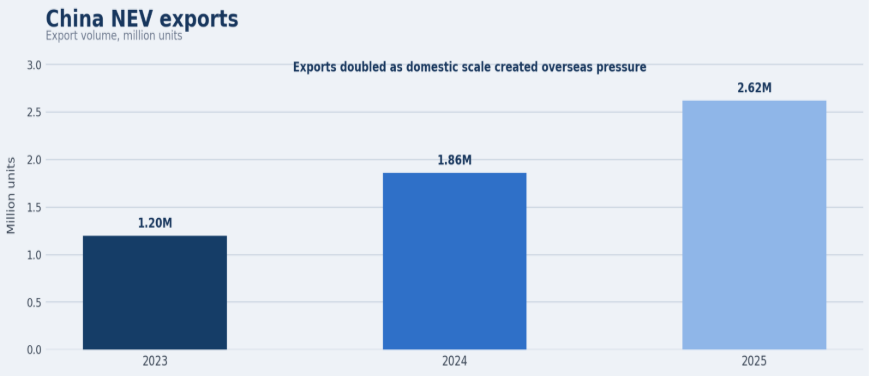
Figure 4. China NEV exports show how domestic scale is turning into global pressure.
| Export signal | Market meaning | Strategic implication |
|---|---|---|
| Rising NEV exports | Domestic brands are expanding overseas | Global automakers face price and feature pressure. |
| Southeast Asia adoption | Chinese brands are strong in emerging EV markets | Local production and distribution networks may expand. |
| Europe exposure | Chinese EVs compete in mature EV markets | Tariff and compliance pressure increases. |
| Latin America opportunity | Affordable EVs can accelerate adoption | Brands can diversify beyond Europe and the U.S. |
| Trade barriers | Tariffs and investigations can limit import-led growth | Chinese automakers may need local assembly. |
Brand Competition: BYD, Tesla China, and the Domestic EV Race
China’s EV brand landscape is unusually competitive because domestic automakers are fighting across price tiers, body styles, battery formats, charging ecosystems, smart-driving features, and international expansion. The brand story is not only about who sells the most vehicles. It is about how fast product cycles move and how much price pressure weaker competitors can survive.
Brand and model competition benchmarks
• BYD is the clearest example of China’s integrated EV model because it competes in vehicles, batteries, plug-in hybrids, and overseas exports.
• Tesla Model Y represented nearly 8% of global BEV sales in 2025, keeping Tesla China relevant even as domestic competition increased.
• Tesla Model 3 represented 3.6% of global BEV sales in 2025, showing continued global importance for the Shanghai-produced sedan ecosystem.
• BYD Seagull represented 3.0% of global BEV sales in 2025, showing the power of affordable small EVs.
• China had nearly 700 EV models available in 2025, which creates buyer choice but makes it harder for smaller brands to build loyalty.
• Industry consolidation risk is rising because price wars, dealer pressure, and software investment requirements make profitability harder.
• NIO, XPeng, Li Auto, Leapmotor, Geely, Changan, SAIC, Chery, and Huawei-linked brands compete through different combinations of price, range, smart cockpit, and assisted-driving features.
• The most important brand question is whether growth can remain profitable after incentives, discounting, export costs, and battery expenses are included.
| Brand or group | Market role | Outlook signal |
|---|---|---|
| BYD | Volume leader with vehicle and battery integration | Strong cost position and export momentum. |
| Tesla China | Global benchmark with Shanghai production base | Still influential but faces stronger domestic competition. |
| SAIC and Chery | Export-oriented Chinese automakers | Important for overseas volume and emerging markets. |
| Geely and Changan | Multi-brand domestic competitors | Compete across mass, premium, and technology-led tiers. |
| NIO, XPeng, Li Auto | Smart EV and premium/new-format players | Differentiate through software, EREVs, services, and assisted driving. |
| Leapmotor and newer entrants | Value-focused challengers | Show how fast competition can shift in lower and mid-price segments. |
Battery Supply Chain: The Hidden Advantage Behind China’s EV Outlook
The battery section is central because China’s EV advantage sits below the vehicle level. Batteries influence vehicle cost, driving range, safety, charging speed, model design, export pricing, and supply security. A country that controls battery manufacturing can influence the economics of the entire EV value chain.
Battery scale and supplier benchmarks
• China represented more than 80% of global battery cell production in 2025, according to the IEA executive summary.
• Global EV battery usage reached 1,187 GWh in 2025, according to SNE Research data summarized in the dataset.
• Global EV battery usage increased 31.7% year over year in 2025, showing that battery demand is rising with vehicle sales.
• CATL produced 464.7 GWh of EV batteries in 2025, up 35.7% year over year.
• CATL’s global EV battery market share reached 39.2% in 2025.
• BYD ranked second globally with 194.8 GWh of EV battery usage in 2025.
• CATL and BYD combined EV battery installations reached 659.5 GWh in 2025.
• CATL and BYD together accounted for 55.6% of global EV battery installations in 2025.
• China’s LFP battery strength supports lower-cost EVs and helps explain why price competition can be so aggressive.
• Battery recycling, second-life use, material security, and safety standards will become more important as China’s EV fleet grows.
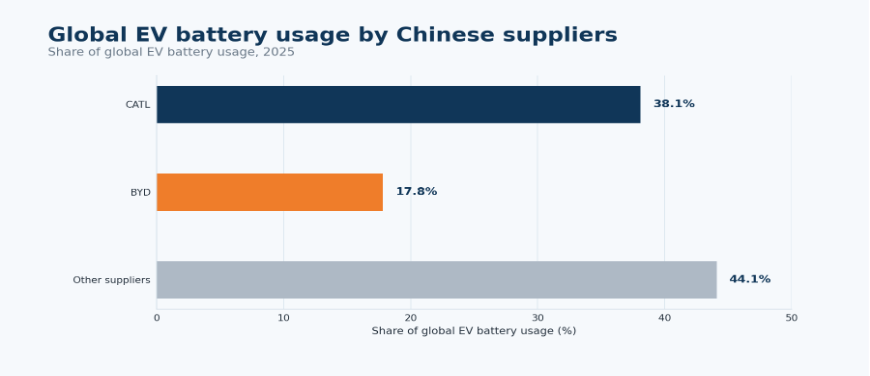
Figure 5. Battery supplier scale explains China’s structural EV cost advantage.
| Battery signal | Current meaning | Why it matters |
|---|---|---|
| Cell production | China represents more than 80% of global battery cell production | Supports vehicle production and export pricing. |
| CATL scale | 464.7 GWh and 39.2% global share | Gives China a global battery champion. |
| BYD integration | 194.8 GWh of battery usage in 2025 | Connects vehicle and battery cost control. |
| LFP chemistry | Strong lower-cost chemistry position | Helps affordable EVs compete with ICE vehicles. |
| Recycling and materials | Battery lifecycle management is becoming more important | Can reduce long-term supply and waste risks. |
Charging Infrastructure and Regional Adoption
Charging infrastructure is the practical bridge between EV interest and EV ownership. China’s charging stock is already the largest in the world, but the next stage is about quality as much as quantity. Charger location, reliability, fast-charging availability, utilization, grid connection, and regional coverage will matter more as adoption moves beyond early urban buyers.
Charging infrastructure benchmarks
• China had nearly 3.4 million public charge points at the end of 2024 and over 4.7 million at the end of 2025.
• China represented more than 65% of public charging points globally at the end of 2025.
• China accounted for more than 75% of global public charging-point growth in 2025.
• There were ten electric light-duty vehicles per public charging point in China at the end of 2025.
• China had 1.5 million fast and ultra-fast chargers in 2024 and 2.2 million in 2025.
• China’s fast and ultra-fast charger stock grew 40% in 2025.
• High charging coverage supports apartment dwellers, taxi fleets, ride-hailing drivers, and long-distance users who cannot rely only on home charging.
• Regional charging gaps still matter because Tier 1 cities, coastal provinces, industrial regions, lower-tier cities, and rural markets do not have the same income, grid, or charger-utilization profile.
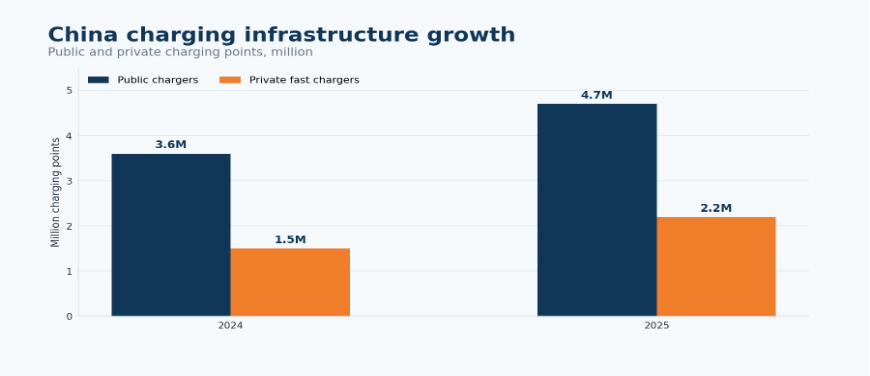
Figure 6. China charging growth supports mass adoption but raises utilization questions.
| Charging signal | What it shows | Why it matters |
|---|---|---|
| Public charging | Access outside the home | Supports urban households and apartment users. |
| Fast chargers | Higher-speed charging for heavier use | Supports taxis, fleets, highways, and commercial vehicles. |
| EVs per charger | Relationship between fleet growth and infra | Shows whether charging expansion keeps pace with adoption. |
| Regional coverage | Where chargers are actually located | Explains city and province adoption differences. |
| Grid readiness | Ability to support charging peaks | Becomes more important as the fleet expands. |
China vs Global EV Market Comparison
China leads the world in EV volume, but country comparisons explain why the outlook is more nuanced. Norway shows what high penetration looks like in a small market. Europe shows how regulation and incentives shape demand. The United States remains a large profit pool but has slower adoption. Southeast Asia and Latin America show where Chinese exports can accelerate adoption through affordability.
Global and regional comparison benchmarks
• Global electric car sales exceeded 20 million in 2025, equal to about one-quarter of all new cars sold globally.
• The IEA expects global electric car sales to reach 23 million in 2026, or about 28% of total car sales.
• China accounted for roughly 60% of global electric car sales in 2025.
• Europe sold 4.2 million electric cars in 2025, after sales increased by more than 30%.
• Europe’s electric car sales share reached 28% in 2025 and is expected to approach one in three cars in 2026.
• North America represented around 15% of the global EV market in 2025, much smaller than China’s share.
• Sales across Asia-Pacific countries other than China are expected to grow by more than 50% in 2026, according to the IEA.
• Latin American electric car sales are projected to rise by 45% in 2026, showing that emerging markets are becoming more important.
• Chinese imports represented 55% of electric car sales in 2025 in countries outside Europe and the United States.
• More than half of Southeast Asian electric cars sold in 2025 were by Chinese brands, while one-third came from a Vietnamese manufacturer.
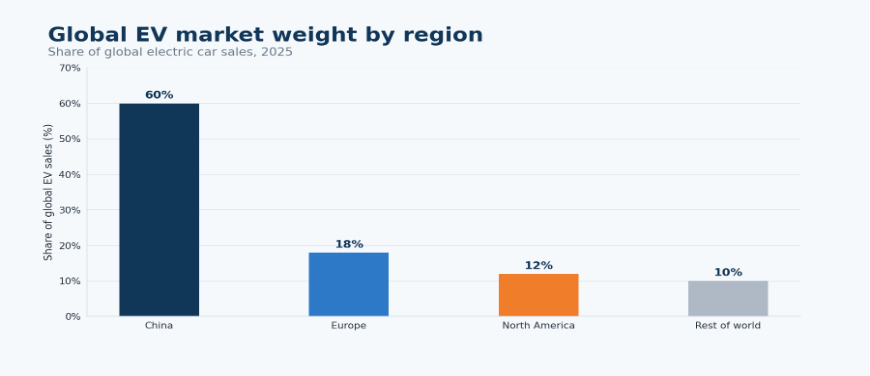
Figure 7. Global EV comparison shows why China is the reference market for scale.
| Country or region | EV market signal | What the China comparison shows |
|---|---|---|
| China | Largest EV market and close to 55% new-car EV share | Combines scale, production, batteries, and exports. |
| Europe | 4.2 million electric cars sold in 2025 | Policy and emissions targets continue to shape demand. |
| United States | Large market but slower share growth | Infrastructure, pricing, and policy remain key adoption barriers. |
| Norway | Very high penetration in a small market | Shows maturity but not industrial scale. |
| Southeast Asia | Fast emerging market with Chinese brand strength | Affordable Chinese EVs can shift market structure. |
| Latin America | Projected 2026 growth of 45% | New export destination for affordable EVs and plug-in hybrids. |
Policy, Pricing, and Consumer Demand
China’s EV policy story has changed. The early market was helped by subsidies and local incentives, but the mature market depends more on tax treatment, replacement schemes, city rules, product affordability, model availability, and domestic competition. Policy still matters, but buyers now compare EVs against conventional cars as practical purchase options.
Policy and affordability benchmarks
• China’s 2025 trade-in scheme offered CNY 20,000 for replacing an older vehicle with a new electric car.
• The same trade-in scheme offered CNY 15,000 for replacing an older vehicle with a new conventional vehicle.
• China’s trade-in scheme attracted 11.5 million applications in 2025.
• Nearly 60% of China trade-in applications were for new energy vehicles by November 2025.
• The average global BEV price premium declined to around 20% in 2025, improving affordability compared with earlier years.
• The share of BEVs sold below the average price of ICE equivalents surpassed 30% in 2025, compared with around 15% in 2021.
• In China, 70% of battery electric cars sold in 2025 were already cheaper than the average conventional car.
• Electric cars have already largely displaced conventional car sales in China’s small-car segment, according to IEA analysis.
• China had nearly 700 electric car models available in 2025, giving buyers more choices across price tiers.
• Model availability increased around 25% in China in 2025, showing that automakers are still expanding the EV product pipeline.
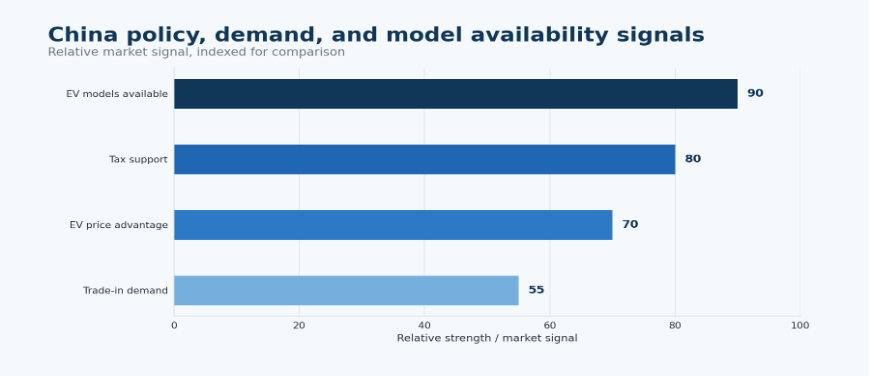
Figure 8. Policy support and model availability reinforce China’s EV demand.
| Demand signal | What it means | Market impact |
|---|---|---|
| Trade-in support | EV replacement receives stronger support than conventional replacement | Helps maintain demand during a slower auto cycle. |
| Price competition | Many EVs are cheaper than conventional equivalents | Pushes adoption but pressures margins. |
| Model availability | Nearly 700 EV models available | Lets consumers choose EVs across more use cases. |
| Small-car displacement | EVs dominate parts of the small-car market | Shows where affordability has already shifted behavior. |
| PHEV growth | Plug-in hybrids appeal to cautious buyers | Broadens adoption beyond pure BEV confidence. |
Market Risks and 2030 Outlook
A strong China EV outlook needs balance. The country leads the global EV market, but leadership does not remove risk. The next phase will test profitability, export access, battery discipline, charging economics, grid readiness, brand consolidation, and the quality of vehicles sold during price-war conditions.
Risk and future outlook benchmarks
• China’s EV sales are expected to grow in 2026, but the IEA expects the growth rate to be slower than in previous years.
• The IEA expects China’s electric car sales share to reach almost 60% in 2026.
• Preliminary April 2026 data showed China monthly electric car sales reaching a record high of over 60% of total car sales.
• China’s EV production exceeded domestic demand by about 20% in 2025, making overcapacity and export reliance important risks.
• The global EV fleet is projected to grow more than sixfold by 2035 from 2025 levels to as many as 510 million vehicles.
• The IEA exploratory scenarios push the global EV share of car sales to around 50% in 2035.
• In China, price dynamics help electric cars exceed 90% of total car sales in 2035 in IEA exploratory scenarios.
• EVs displaced around 1 million barrels per day of oil demand in China in 2025 and are set to displace 2.7 million barrels per day annually by 2030.
• Electric truck sales more than doubled globally in 2025, and China accounted for the vast majority of that growth.
• One in four trucks sold in China was electric in 2025, showing that electrification is expanding beyond passenger cars.
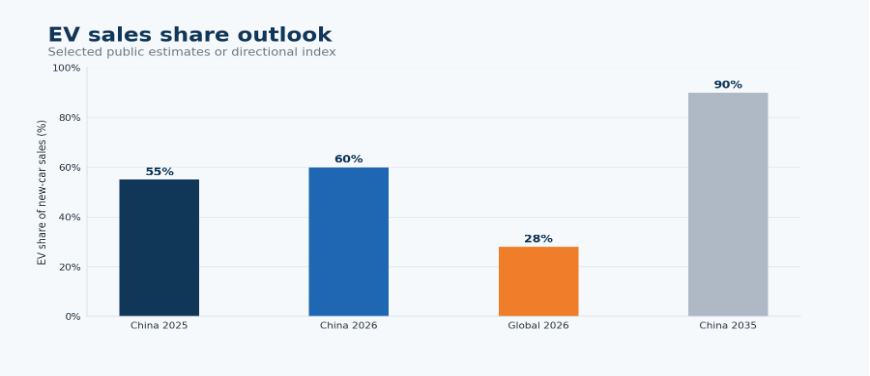
Figure 9. China EV outlook shifts from fast adoption to profitable global competition.
| Risk area | Warning signal | Why it matters |
|---|---|---|
| Price war | Frequent discounts and incentives | Can weaken margins even while unit sales rise. |
| Overcapacity | Production grows faster than domestic demand | Pushes brands toward exports and lower prices. |
| Trade barriers | Tariffs, investigations, and local-content rules | Can limit import-led overseas growth. |
| Materials | Input cost and supply-chain volatility | Affects price stability and profit. |
| Charging economics | Large charger stock with uneven utilization | Tests operators and grid planners. |
| Consolidation | Too many brands chasing the same buyers | Market share may concentrate among stronger players. |
| Grid load | More high-speed charging and electric trucks | Requires energy planning, demand response, and upgrades. |
Metrics EV Market Leaders Should Track
A useful EV market scorecard should locate the market signal rather than overwhelm the reader. The right metrics connect demand, infrastructure, trade, cost, and profitability. For China, the minimum scorecard should show whether EV growth is healthy, exportable, profitable, and supported by the charging and battery system around it.
| Metric | Why it matters |
|---|---|
| NEV sales volume | Shows the overall market scale and direction of demand. |
| EV penetration rate | Shows whether EVs are mainstream within new-car sales. |
| BEV versus PHEV mix | Reveals pure-electric confidence and plug-in hybrid transition demand. |
| Domestic sales versus exports | Separates home-market demand from overseas capacity absorption. |
| EV production volume | Shows factory scale and possible overcapacity pressure. |
| Battery cost and supplier share | Explains vehicle pricing and supply-chain control. |
| Public and fast-charger stock | Shows whether ownership infra is keeping pace. |
| EVs per public charger | Measures infra pressure as the fleet grows. |
| Average selling price and discounts | Shows how much growth depends on aggressive pricing. |
| Brand profit | Tests whether volume is translating into sustainable business performance. |
| Export tariff exposure | Shows how sensitive global expansion is to trade policy. |
| Used values | Reflects consumer confidence, battery trust, and residual-value stability. |
Regional and Province-Level Demand Signals
China’s national EV statistics are powerful, but they hide important differences inside the country. A market with more than a billion people cannot be read as one uniform adoption curve. Tier 1 cities, coastal provinces, manufacturing hubs, interior provinces, lower-tier cities, and rural areas all face different combinations of income, charger access, driving patterns, license rules, electricity prices, and brand availability.
The regional story matters because the first wave of EV demand was easier to create in dense, wealthier, policy-active cities. The next wave is more demanding. It requires lower-priced models, reliable chargers outside premium districts, better after-sales service, simpler financing, stronger used-vehicle confidence, and enough model variety for families, fleets, commercial users, and rural drivers. That is why national sales volume should be read together with regional adoption quality.
Regional adoption signals to separate
• Tier 1 cities usually have stronger charging density, higher income, license-plate incentives, and greater consumer familiarity with EVs.
• Coastal provinces tend to benefit from stronger infrastructure, higher household purchasing power, and more exposure to domestic EV brands.
• Industrial provinces matter because EV manufacturing, supplier clusters, commercial fleets, and logistics demand can reinforce each other.
• Interior and lower-tier regions may offer the next layer of growth, but adoption depends more heavily on affordability and charging confidence.
• Rural EV adoption is more sensitive to vehicle price, durability, service coverage, winter performance, and private charging access.
• Regional charging density can change the BEV versus PHEV mix because buyers without reliable charging are more likely to prefer plug-in hybrids or range-extended vehicles.
• City-level policy still matters because parking, license plates, fleet rules, taxi electrification, and local subsidies can create adoption pockets faster than national averages suggest.
• Regional after-sales networks are becoming a competitive advantage as EV penetration moves beyond early adopters into family and replacement buyers.
| Region type | Likely EV adoption signal | Market implication |
|---|---|---|
| Tier 1 cities | High EV familiarity and dense charging access | Premium BEVs, smart EVs, and fast charging can scale faster. |
| Coastal provinces | Higher income and stronger dealer/infra networks | Replacement demand can support both premium and mass-market EVs. |
| Industrial provinces | Vehicle and component manufacturing clusters | Local production can support fleets, logistics, and supplier ecosystems. |
| Lower-tier cities | Growing EV interest but stronger price sensitivity | Affordable BEVs, PHEVs, and EREVs become more important. |
| Rural markets | More dependence on practicality, service, and private charging | Durability, low cost, and after-sales coverage become adoption levers. |
Commercial EVs, Trucks, Buses, and Fleet Electrification
Passenger cars receive most of the attention, but China’s EV market outlook also depends on commercial adoption. Buses, taxis, ride-hailing vehicles, logistics vans, municipal vehicles, and trucks generate high mileage, visible emissions benefits, and heavy charging demand. These segments can accelerate electrification because total cost of ownership often matters more than brand preference or lifestyle appeal.
The commercial side also changes the infrastructure question. A private car can charge slowly at home or at work. A taxi, delivery van, bus, or electric truck needs predictable uptime, high-power charging, depot planning, battery durability, software scheduling, and grid coordination. That means commercial EV adoption can reveal infrastructure weakness faster than private-car adoption.
Fleet and commercial EV benchmarks
• Electric truck sales more than doubled globally in 2025 compared with 2024, according to the IEA.
• The vast majority of electric truck sales growth in 2025 came from China.
• One in four trucks sold in China in 2025 was electric, making China the strongest heavy-vehicle electrification signal globally.
• Electric trucks remain two to three times more expensive to purchase than diesel trucks in many markets, but total cost of ownership is already competitive in China.
• China’s fast and ultra-fast charger stock reached 2.2 million in 2025, which is important for high-utilization fleets.
• Battery swapping remains relevant for selected taxi, fleet, and premium use cases where downtime is more costly than infrastructure complexity.
• Urban logistics electrification is helped by predictable routes, depot charging, local emissions rules, and high daily mileage.
• Fleet electrification increases the need for charger reliability, demand management, vehicle scheduling, and battery-health monitoring.
| Fleet segment | EV opportunity | Main constraint |
|---|---|---|
| Buses | Predictable routes and depot charging make electrification easier | Depot planning, grid capacity, and schedule reliability. |
| Taxis and ride-hailing | High mileage can improve fuel-saving economics | Downtime, fast charging, battery wear, and service access. |
| Urban logistics vans | Delivery routes fit depot and overnight charging | Payload, utilization, and city-level charging access. |
| Medium and heavy trucks | High fuel savings and emissions reduction potential | Battery weight, purchase price, and high-power charging. |
| Municipal fleets | Public-sector rules can accelerate adoption | Procurement cycles and local charging budgets. |
90-Day China EV Market Benchmark Plan
Statistics become useful when they are translated into a repeatable market review. A China EV market dashboard should not only report sales every month. It should separate demand quality, production pressure, export dependence, charging readiness, battery economics, and profitability. The goal is to understand whether growth is healthy, not only whether it is large.
A 90-day review works well because China’s EV market moves quickly. Prices can change within weeks, new models can shift segment competition, export rules can alter overseas economics, and monthly penetration can move above or below key thresholds. A quarterly scorecard helps teams compare the national story against actual signals from customers, automakers, suppliers, and policy updates.
Quarterly review structure
• Days 1–30 should establish the baseline: NEV sales, penetration, BEV/PHEV mix, exports, production, prices, and public charger additions.
• Days 31–60 should diagnose pressure points: discounting, inventory, capacity utilization, brand margin pressure, tariff exposure, and charger utilization.
• Days 61–90 should convert the data into decisions: where to expand, which price tiers are weakening, which regions need chargers, and which export markets require localization.
• The review should separate China domestic demand from export-driven production because the two signals can move in different directions.
• Monthly penetration should be evaluated with price and model data because a rising EV share can still be margin-negative if it is driven by heavy discounts.
• Charging growth should be reviewed with utilization and EVs-per-charger data because charger count alone does not prove charging quality.
• Battery data should include supplier share, chemistry mix, cost direction, and material risk because battery economics shape the whole vehicle market.
• Export growth should be read together with tariff, shipping, local assembly, and destination-market incentive rules.
| Timing | What to review | Output |
|---|---|---|
| Days 1-30 | Sales, penetration, BEV/PHEV mix, exports, production, chargers, battery supply | Baseline dashboard that separates demand, supply, and infra. |
| Days 31-60 | Pricing, discounts, inventory pressure, production-demand gap, charger utilization, export risk | Short list of pressure points and owners. |
| Days 61-90 | Regional demand, brand profit, policy changes, local production options, 2030 outlook assumptions | Decision-ready view of profitable growth and risk exposure. |
China Electric Vehicles EV Market Outlook FAQ
How big is China’s EV market?
China is the world’s largest electric vehicle market. The IEA reports more than 13 million electric cars sold in China in 2025, while CAAM data reported 16.49 million NEV sales including exports. The difference comes from the scope of the metric, but both numbers show the same market reality: China is operating at a scale no other EV market currently matches.
What percentage of new cars sold in China are electric?
China’s electric car sales share reached close to 55% in 2025. Monthly electric car sales exceeded a 50% share in 11 out of 12 months in 2025, and preliminary April 2026 data showed a record monthly share above 60%. That means EVs are no longer a side category in China’s new-car market.
Is China the largest EV market in the world?
Yes. China accounted for roughly 60% of global electric car sales in 2025. It also led global electric car production and represented more than 80% of battery cell production, making it the largest EV market not only by demand but also by industrial scale.
Why is China leading the EV market?
China leads because demand, production, batteries, charging infrastructure, model availability, and policy support have scaled together. A large domestic market gives automakers volume, while the battery and supplier ecosystem helps reduce cost. The result is a market where EVs can compete aggressively across price tiers.
Which companies matter most in China’s EV market?
BYD is the clearest volume and integration leader, while Tesla China remains an important global benchmark through the Shanghai production base. CATL and BYD are critical battery players. NIO, XPeng, Li Auto, Geely, SAIC, Changan, Chery, Leapmotor, and Huawei-linked brands add competition across premium, mass-market, export, and smart-EV segments.
How important are China EV exports?
Exports are increasingly important because China produced more electric cars than domestic demand absorbed in 2025. China exported 2.62 million NEVs in 2025, and IEA analysis says Chinese electric car exports doubled to more than 2.5 million. Exports help absorb capacity, but trade barriers and localization requirements are rising risks.
Does China have enough charging infrastructure?
China has the largest public charging network in the world, with more than 4.7 million public charge points at the end of 2025. It also had around 2.2 million fast and ultra-fast chargers. The next question is not only quantity, but also reliability, utilization, grid readiness, and regional coverage.
What role do batteries play in China’s EV advantage?
Batteries are one of the main reasons China can compete on EV cost. China represented more than 80% of global battery cell production in 2025. CATL and BYD together accounted for 55.6% of global EV battery installations, giving China a powerful position in the most expensive part of an electric vehicle.
What are the biggest risks for China’s EV market?
The main risks are price-war pressure, weaker margins, overcapacity, export tariffs, battery material volatility, uneven charging utilization, grid stress, brand consolidation, and used-EV value uncertainty. Scale is a major advantage, but it does not automatically guarantee profitability.
What is the China EV outlook through 2030 and beyond?
The outlook remains strong, but the market is shifting from early rapid growth to mature competition. The IEA expects China’s EV share to approach 60% in 2026, and its longer-term scenarios show EVs exceeding 90% of China car sales by 2035. The next stage will focus on profitability, exports, batteries, charging quality, software, and industrial resilience.
Final Takeaway
China’s EV market outlook is strong because it is supported by more than one advantage. The country leads in sales, penetration, production, batteries, charging infrastructure, model availability, and export momentum. More than 13 million electric cars were sold in China in 2025, NEV sales including exports reached 16.49 million units, and electric cars were close to 55% of new-car sales. Those numbers show that China has already moved beyond early adoption.
The next phase will be more difficult than the first. China’s EV market is becoming a maturity story, where volume growth must be judged alongside profitability, battery cost, product quality, charging reliability, trade exposure, and consumer confidence. Price competition can help adoption, but it can also weaken margins. Export growth can absorb domestic capacity, but it also brings tariffs, localization pressure, and geopolitical risk.
For automakers, suppliers, investors, policymakers, and infrastructure planners, China is the market that shows what happens when EV adoption becomes a system rather than a product trend. Its scale will continue to pressure global vehicle prices, battery supply chains, charging networks, and government policy. The central question is no longer whether China will lead the EV market. The central question is how profitable, exportable, and resilient that leadership will be through the next decade.


