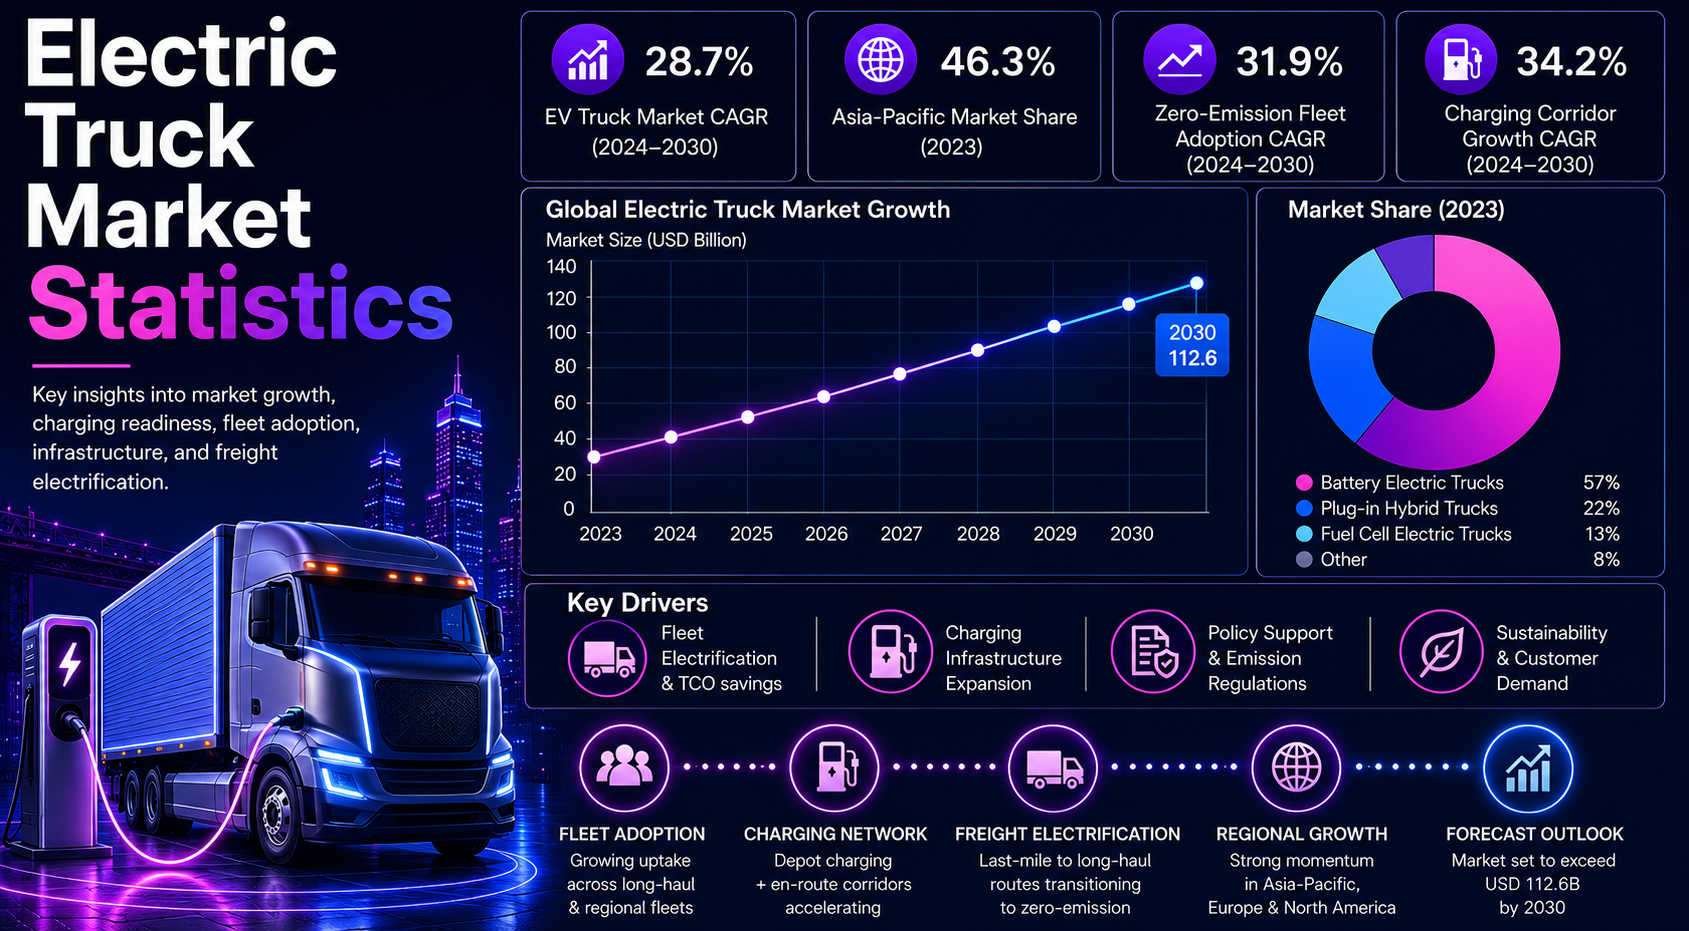
Electric trucks are no longer only test vehicles for sustainability teams. They are becoming part of freight planning, depot design, port operations, municipal purchasing, and logistics cost control. The strongest statistics show a market that is growing quickly but unevenly: the International Energy Agency reported that electric truck sales reached 9% of global truck sales in 2025, while China accounted for over 90% of global electric truck sales after volumes surpassed 400,000 units. Market research also points to rapid long-term growth, with one global estimate placing the electric trucks market at USD 39.30 billion in 2025 and projecting USD 193.40 billion by 2033.
The market story is not simply that trucks are becoming electric. It is that fleet operators are learning where battery-electric trucks make commercial sense first. Return-to-base routes, urban delivery, drayage, refuse collection, municipal service, and regional freight are easier to plan because charging windows and daily mileage are more predictable. Long-haul freight still needs stronger highway charging, larger batteries, faster charging standards, and more confidence around payload, uptime, and residual value.
For this article, electric truck statistics are treated as a market scorecard. The sections below connect market size, sales share, regional adoption, country-level deployment, vehicle class, charging infrastructure, cost, policy, barriers, and forecast outlook. The goal is not to list every number. The goal is to explain what the numbers mean for fleets, manufacturers, charging providers, logistics companies, regulators, and investors.
Executive Electric Truck Benchmarks
These are the headline statistics that frame the article. They show why electric trucks matter as a commercial vehicle category and why adoption must be measured by region, vehicle class, charging readiness, and fleet economics rather than by market value alone.
- The IEA reported that electric truck sales reached 9% of all truck sales worldwide in 2025, after more than doubling from 2024 levels.
- China is the center of current volume: IEA data shows electric truck sales surpassed 400,000 units in 2025, with China accounting for over 90% of the global total.
- In China, one in four trucks sold in 2025 was electric, showing how much further the Chinese market has moved compared with most other regions.
- Grand View Research estimated the global electric trucks market at USD 39.30 billion in 2025 and projected it to reach USD 193.40 billion by 2033.
- The same forecast implies a strong 20.9% CAGR from 2026 to 2033, driven by emissions rules, charging investment, lower battery costs, and logistics-fleet adoption.
- The heavy-duty electric trucks segment was estimated at USD 1.93 billion in 2025 and projected to reach USD 6.45 billion by 2033, showing that heavier freight is growing from a smaller base.
- CALSTART reported more than 59,000 zero-emission trucks operating in the United States by mid-2025, turning policy and pilot programs into visible fleet deployment.
- Europe remains earlier than China in volume, but battery-electric truck registrations are rising as CO2 standards, city restrictions, and OEM transition plans reshape procurement.
- Medium-duty, depot-based, and urban delivery trucks are the strongest near-term use cases because their routes are more predictable than long-haul freight.
- Charging remains the main operating bottleneck: depot power, utility timelines, charger count, and corridor coverage often decide whether fleet electrification can move beyond pilot scale.
- Total cost of ownership depends on more than fuel savings. Fleets must include purchase incentives, charging investment, maintenance savings, electricity tariffs, utilization, driver schedules, and residual value risk.
- The biggest deployment barriers are still high upfront cost, charging gaps, grid delays, payload and range limits, model availability, and uptime risk.
| Benchmark Area | What the Statistic Shows | Why It Matters |
|---|---|---|
| Global sales share | Electric trucks reached 9% of truck sales in 2025 | The category is no longer only experimental. |
| China volume | China produced more than 90% of global sales | Global averages are heavily China-weighted. |
| Market value | USD 39.30B in 2025 to USD 193.40B by 2033 | Forecasts expect fast commercial scaling. |
| U.S. deployments | 59,000+ zero-emission trucks in operation | Fleet use is becoming visible beyond pilots. |
| Main bottleneck | Depot and corridor charging | Infrastructure decides scale-up speed. |
Why Electric Trucks Are Becoming a Freight Planning Issue
Electric trucks are important because trucking is both economically essential and emissions-intensive. A diesel truck cannot be replaced by an electric model simply because the model exists. Fleet managers need proof that a vehicle can complete the route, carry the load, charge at the right time, and stay available during business-critical delivery windows.
- Truck electrification is strongest first in return-to-base operations, where vehicles come back to the same depot and charging can be scheduled overnight or between shifts.
- Urban delivery, refuse collection, port drayage, and municipal service are early-fit applications because daily routes are more predictable than long-haul freight.
- Charging infrastructure is now part of procurement. A fleet may select the truck, but depot power and utility approval can decide whether the project starts on time.
- Fleet operators evaluate electric trucks through uptime, payload, range, driver scheduling, maintenance, safety, and TCO rather than through emissions benefits alone.
- Policy changes in China, Europe, California, and other U.S. states are pulling electric trucks into medium-term procurement plans before diesel restrictions become binding.
- The strongest adoption cases combine route fit, incentives, electricity cost advantages, available chargers, and predictable utilization.
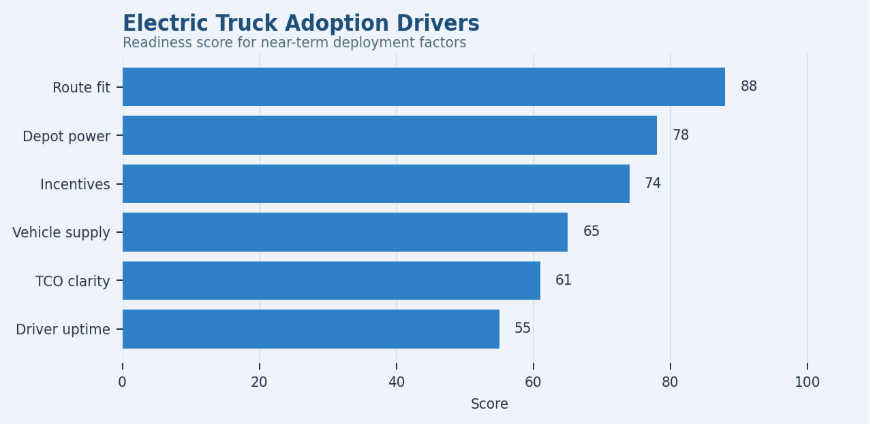
Figure 1. Electric truck adoption depends on route fit, charging access, fleet economics, and policy pressure moving together.
| Adoption Factor | Market Signal | Why It Matters |
|---|---|---|
| Route fit | Daily mileage and payload | Determines whether electrification works. |
| Depot charging | Return-to-base operations | Makes early charging easier to control. |
| Policy pressure | Rules and incentives | Pulls fleet planning forward. |
| Operating cost | Fuel and maintenance savings | Supports long-term TCO. |
| Grid readiness | Power at depots | Decides deployment speed. |
Market Size and Forecast: How Fast Electric Trucks Are Scaling
Market-size estimates vary because research firms define electric trucks differently. Some include light, medium, and heavy commercial trucks together; others focus on heavy-duty battery-electric vehicles only. Even with those differences, the direction is clear: the category is expected to grow much faster than the broader commercial vehicle market.
- Grand View Research estimated the electric trucks market at USD 39.30 billion in 2025, creating a large enough base for OEMs, charger suppliers, software vendors, and fleet-finance providers.
- The same estimate projects the market reaching USD 193.40 billion by 2033, showing how quickly the category could scale if policy, supply, and infrastructure continue improving.
- The implied 20.9% CAGR from 2026 to 2033 reflects stricter emissions rules, charging expansion, falling battery costs, and logistics-sector adoption.
- Heavy-duty electric trucks are smaller but important: one global estimate placed the heavy-duty segment at USD 1.93 billion in 2025 and USD 6.45 billion by 2033.
- Forecasts should be read as staged growth. Medium-duty and depot-based trucks can scale earlier, while long-haul vehicles need faster charging corridors and stronger range confidence.
- The growth outlook is strongest where fleets can combine grants, tax credits, lower energy cost, and predictable utilization into a credible TCO case.
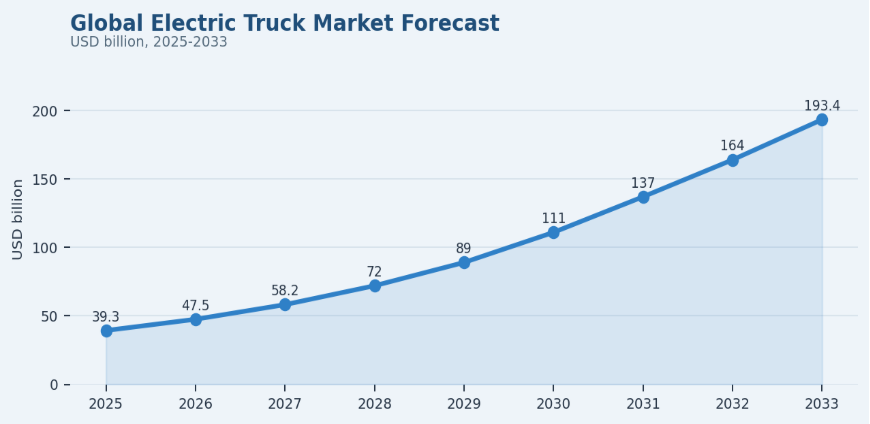
Figure 2. Global electric truck market value is rising, but adoption depends on charging readiness and fleet economics.
| Forecast Signal | Value / Direction | Market Meaning |
|---|---|---|
| Current market value | USD 39.30B in 2025 | Shows today’s commercial base. |
| Forecast market value | USD 193.40B by 2033 | Shows long-term scale. |
| Growth rate | 20.9% CAGR | Shows expected speed. |
| Main driver | Regulation and fleet economics | Explains demand expansion. |
| Main restraint | Charging and upfront cost | Explains uneven adoption. |
Sales Momentum: Where Electric Trucks Are Moving Beyond Pilots
Sales and deployment statistics are more useful than market value when the goal is to understand adoption. A fleet can spend heavily on a few pilot vehicles, but market momentum appears when those pilots become repeat orders, multi-site deployments, and standardized charging plans.
- IEA data shows electric truck sales more than doubled in 2025 compared with 2024, the clearest signal that the category is moving beyond early tests.
- Electric trucks reached 9% of all global truck sales in 2025, which is still early but high enough to affect OEM planning and charging investment.
- China dominates the sales curve: electric truck sales surpassed 400,000 units in 2025, and China represented over 90% of the global market.
- China also reached a major penetration signal, with one in four trucks sold being electric in 2025.
- Europe and North America grew from much lower levels, meaning their adoption story is more about fleet deployments, policy compliance, and charging preparation than immediate volume leadership.
- Medium-duty trucks and depot-based operations are generally easier to scale because they need less public charging than long-haul tractor-trailers.
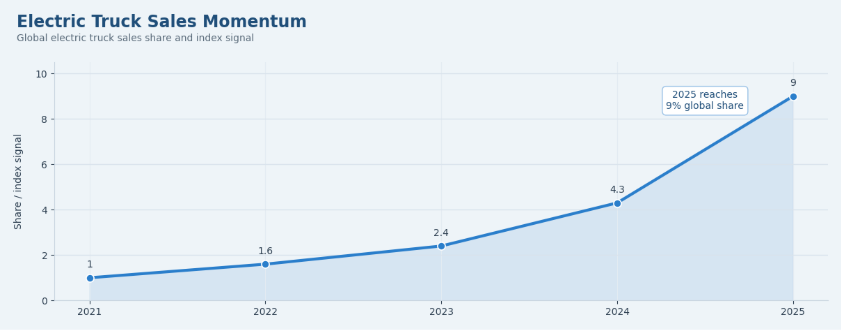
Figure 3. Electric truck sales are moving beyond pilots fastest in markets with strong policy, depot charging, and fleet route planning.
| Adoption Signal | What to Measure | Why It Matters |
|---|---|---|
| Sales share | Electric trucks as % of truck sales | Shows adoption depth. |
| Fleet deployment | Trucks in real service | Shows real operations. |
| Vehicle class | Medium-duty vs heavy-duty | Shows early fit. |
| Route type | Urban, depot, regional, long-haul | Shows route fit. |
| Charging access | Depot and corridor coverage | Shows scale potential. |
Regional Adoption: Why China, Europe, and the U.S. Are Moving Differently
Regional data is one of the most important parts of an electric truck statistics article because global averages hide very different adoption pathways. China is a volume market, Europe is a regulation-led market, and the United States is a state-and-fleet-deployment market. Latin America, the Middle East, and Africa are earlier, but logistics hubs and municipal programs are creating selective opportunities.
- Asia Pacific leads current electric truck volume because China accounts for over 90% of global electric truck sales.
- China’s penetration is also higher than other regions: one in four trucks sold in China in 2025 was electric, according to the IEA.
- North America is growing through state-led programs, depot-based fleets, drayage rules, and corporate logistics commitments rather than broad national volume.
- The United States had more than 59,000 zero-emission trucks operating by mid-2025, showing that fleet deployment is becoming measurable.
- Europe’s transition is being pushed by CO2 standards, city access rules, OEM commitments, and fleet decarbonization targets.
- Latin America and MEA remain smaller, but ports, mining, municipal fleets, and urban delivery programs create early demand pockets.
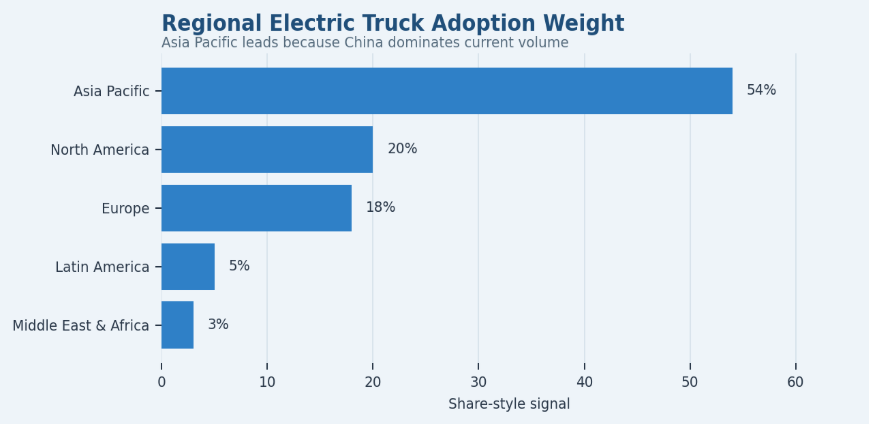
Figure 4. Regional electric truck adoption shows China’s scale, Europe’s policy pressure, and the U.S. fleet-deployment pathway.
| Region | Adoption Signal | Market Meaning |
|---|---|---|
| Asia Pacific | Highest volume, China-led | Sales and manufacturing scale are strongest. |
| North America | State-led deployment | Fleet pilots are becoming larger orders. |
| Europe | Regulation-led transition | OEMs and fleets prepare for CO2 rules. |
| Latin America | Selective early adoption | Urban logistics and ports matter. |
| MEA | Early-stage market | Growth depends on hubs and investment. |
Country-Level Deployment: China’s Scale vs Early Fleet Markets
Country-level statistics give the article real depth because electric truck adoption depends on national freight structure, OEM supply, electricity prices, industrial policy, and charger access. The strongest countries do not all follow the same path.
- China is the clear country leader, with over 400,000 electric truck sales in 2025 and over 90% of global sales volume.
- The United States is smaller in new sales share but important in real-world deployment, with 59,000+ zero-emission trucks reported in operation by CALSTART in mid-2025.
- Germany remains important because it is one of Europe’s largest commercial vehicle markets and a key manufacturing base for heavy trucks.
- The Netherlands is strategically relevant because port operations, logistics corridors, and urban freight make it a useful electric truck test market.
- India is an emerging market where freight demand, state incentives, and logistics electrification could create future growth from a smaller base.
- Brazil, Mexico, the UAE, and South Africa are early-stage markets where ports, mining, municipal fleets, and large logistics operators may lead adoption before broad market penetration.
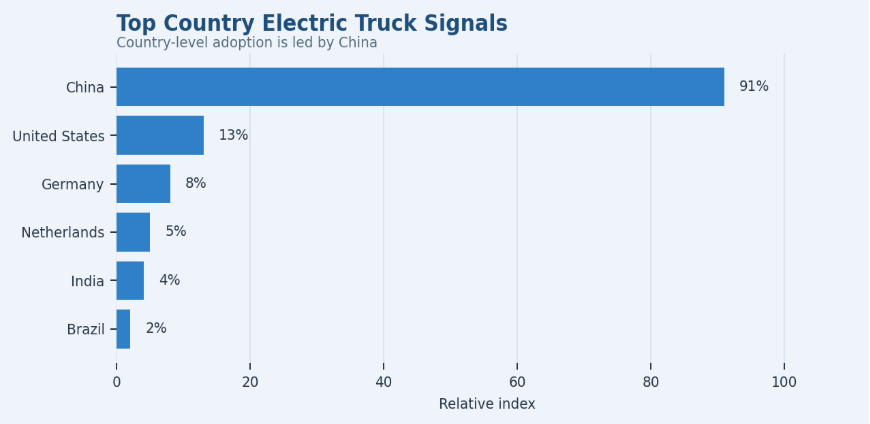
Figure 5. Country-level data highlights the gap between China’s electric truck scale and earlier-stage fleet markets elsewhere.
| Country | Market Signal | Why It Matters |
|---|---|---|
| China | Largest electric truck sales base | Sets the global volume benchmark. |
| United States | Fast-growing deployments | Strong state policy and fleet activity. |
| Germany | Large commercial vehicle market | Important for European heavy trucks. |
| Netherlands | Port and logistics relevance | Useful for drayage and urban fleets. |
| India | Emerging freight electrification | Freight growth supports future demand. |
| Brazil | Early Latin American opportunity | Urban logistics and fleet pilots matter. |
Vehicle Class Mix: Medium-Duty, Heavy-Duty, Drayage, Refuse, and Long-Haul Trucks
Electric truck adoption is not evenly distributed across vehicle classes. Some duty cycles fit batteries much better today because daily mileage is predictable, payload needs are manageable, and vehicles can return to a depot. Other categories need stronger charging, longer range, and greater payload confidence.
- Medium-duty delivery trucks are among the strongest early-fit categories because their routes are predictable and charging can usually happen at the depot.
- Port drayage is a high-potential segment because many trips are short, repetitive, and located near regulated logistics zones.
- Refuse trucks are attractive because stop-start duty cycles can support regenerative braking and because municipal fleets often face public emissions targets.
- Regional haul is more complicated but still promising when routes are known, daily mileage is limited, and charging can be placed at depots or logistics hubs.
- Long-haul freight remains the hardest segment because it needs higher range, faster charging, larger batteries, and more public corridor coverage.
- Heavy-duty electric trucks can create larger emissions benefits than smaller vehicles, but they also create bigger infrastructure and payload challenges.
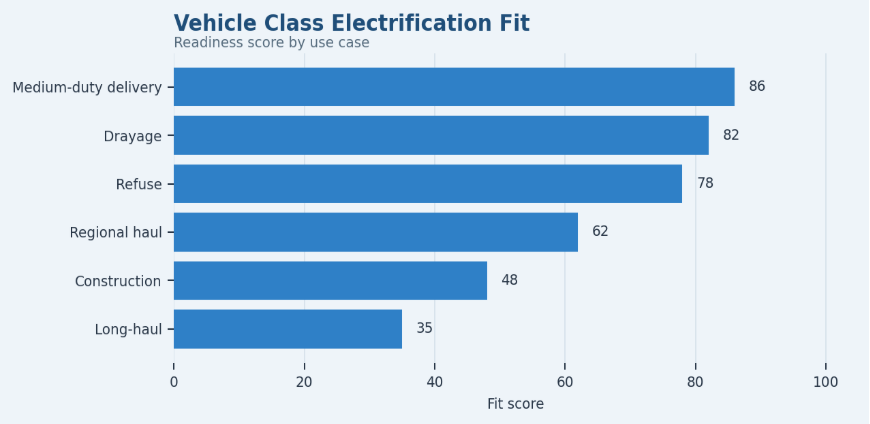
Figure 6. Medium-duty and return-to-base trucks are easier to electrify first because routes and charging windows are more predictable.
| Vehicle Type | Best-Fit Use Case | Adoption Logic |
|---|---|---|
| Medium-duty trucks | Urban delivery and service fleets | Predictable routes and depot charging. |
| Heavy-duty trucks | Regional haul and drayage | High emissions impact but harder charging. |
| Refuse trucks | Municipal routes | Stop-start cycles support electrification. |
| Drayage trucks | Ports and logistics hubs | Regulation and short trips help adoption. |
| Long-haul trucks | Highway freight | Needs faster public charging and range. |
Charging Readiness: The Main Deployment Bottleneck
Charging is the difference between buying an electric truck and operating it successfully. A fleet can place an order quickly, but a depot may need electrical upgrades, utility approvals, charging hardware, software controls, driver training, and operational redesign before vehicles can run daily routes.
- Depot charging is the first backbone of electric truck adoption because many early fleets return to the same site at the end of each shift.
- Grid connection timelines can be a hidden bottleneck; fleets may need months or years to secure enough power for larger truck deployments.
- Public corridor charging remains less mature than passenger EV charging, which slows regional and long-haul electric freight.
- Megawatt charging development is important for heavy-duty and long-haul vehicles because downtime directly affects freight economics.
- Charger utilization matters. A depot with underused chargers has poor capital efficiency, while a crowded depot can create vehicle availability problems.
- Charging software is increasingly important because fleets need to schedule vehicles, avoid peak electricity prices, and protect battery health.
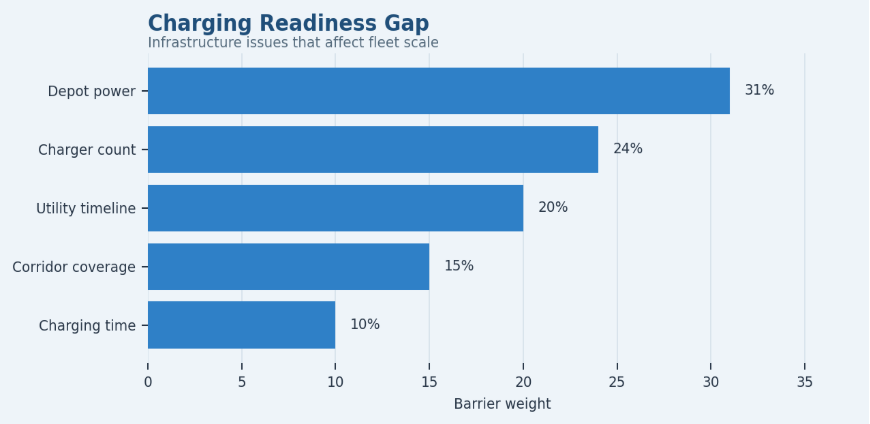
Figure 7. Charging readiness explains why depot-based fleets can scale faster than long-haul electric trucking.
| Charging Issue | What to Measure | Why It Matters |
|---|---|---|
| Depot power | Available grid capacity | Determines fleet scale. |
| Charger count | Chargers per depot | Affects uptime. |
| Corridor access | Highway charging coverage | Supports longer routes. |
| Charging time | Hours per truck | Affects operations. |
| Utility timeline | Connection approval time | Delays deployment. |
Fleet Use Cases: Where Electric Trucks Fit Best Today
Electric trucks are most practical where work patterns are predictable. A vehicle that returns to base, follows similar routes, and has scheduled downtime is easier to electrify than one that travels long distances with uncertain charging access.
- Last-mile delivery is one of the strongest fit areas because vehicles often run short routes and return to the same depot.
- Port drayage is attractive because trips can be repetitive and because port regions often face emissions pressure.
- Refuse collection has a strong use-case logic because municipal fleets operate fixed routes and value lower local pollution.
- Regional haul can work when routes are known and charging is available at terminals, depots, or logistics hubs.
- Cold-chain logistics is possible but more complex because refrigeration loads add energy demand and planning complexity.
- Long-haul freight remains lower-fit today because it requires fast corridor charging, stronger range, and confidence that charging stops will not disrupt delivery schedules.
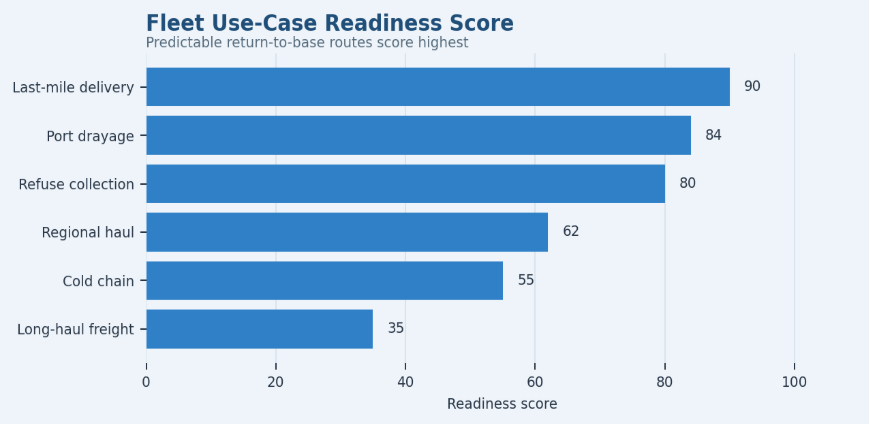
Figure 8. Predictable routes and return-to-base operations create the strongest near-term fit for electric truck deployment.
| Use Case | Electrification Fit | Why It Works |
|---|---|---|
| Last-mile delivery | High | Short routes and depot return. |
| Drayage | High | Port rules and predictable trips. |
| Refuse collection | High | Fixed routes and municipal demand. |
| Regional haul | Medium | Needs route and charging planning. |
| Long-haul freight | Lower today | Requires faster public charging. |
Fleet Economics: When Electric Trucks Start Making Commercial Sense
Electric truck economics are often misunderstood because the vehicle price is visible while operating savings and incentives are harder to compare. A serious market article should explain the cost stack: vehicle purchase, subsidy, charger investment, electricity tariff, diesel savings, maintenance, utilization, financing, and residual value.
- Higher upfront price remains one of the strongest adoption barriers, especially for small fleets with limited access to capital.
- Incentives can materially change the business case by reducing the gap between diesel and electric truck purchase cost.
- Electricity can be cheaper than diesel on a route basis, but the result depends on local tariffs, depot charging schedules, demand charges, and charger utilization.
- Maintenance savings are part of the TCO story because electric drivetrains have fewer moving parts than diesel powertrains.
- Charging investment must be included in the payback calculation; vehicle-level savings can be offset if depot upgrades are expensive or delayed.
- Utilization matters because trucks that run predictable daily miles can spread purchase and infrastructure costs over more revenue-generating work.
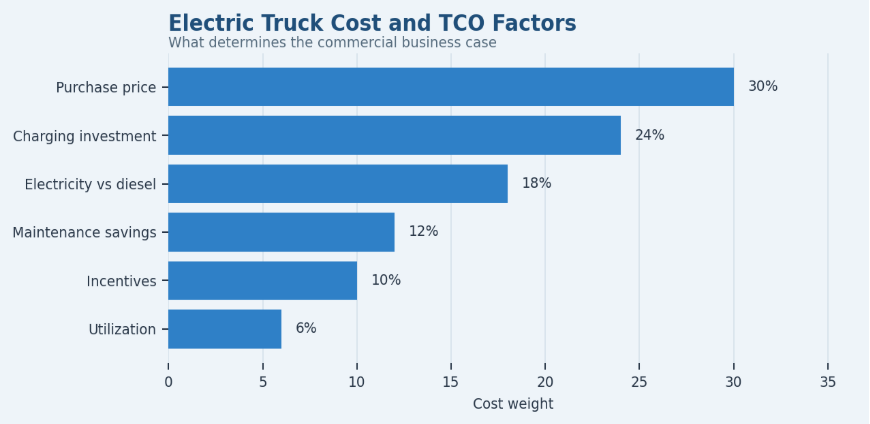
Figure 9. Electric truck economics depend on purchase price, incentives, energy cost, maintenance, and charging investment.
| Cost Factor | Market Effect | Fleet Question |
|---|---|---|
| Upfront price | Slows adoption | Do incentives close the gap? |
| Electricity cost | Improves operating cost | Is charging cheaper than diesel? |
| Maintenance | Supports TCO savings | Are service costs lower? |
| Charging investment | Adds project cost | Can the depot support scale? |
| Utilization | Improves payback | Are trucks used enough daily? |
Policy Pressure: Regulations, Mandates, and Zero-Emission Targets
Policy is not the only driver of electric truck adoption, but it changes planning timelines. When fleets know that emissions standards, low-emission zones, procurement mandates, or grant programs are approaching, they begin route testing and depot planning earlier.
- China’s policy environment and industrial scale have helped create the world’s largest electric truck market by sales volume.
- Europe’s CO2 standards, city restrictions, and OEM transition strategies push fleets and manufacturers toward zero-emission commercial vehicles.
- California and several U.S. states are important because state-level rules and funding programs create adoption pressure even when national truck penetration remains lower.
- Purchase incentives reduce upfront price risk and can turn an otherwise weak TCO case into a viable procurement plan.
- Charging grants matter because depot upgrades are often one of the largest hidden costs in fleet electrification.
- Low-emission zones can change operating value by making electric trucks more useful in cities where diesel access becomes restricted or expensive.
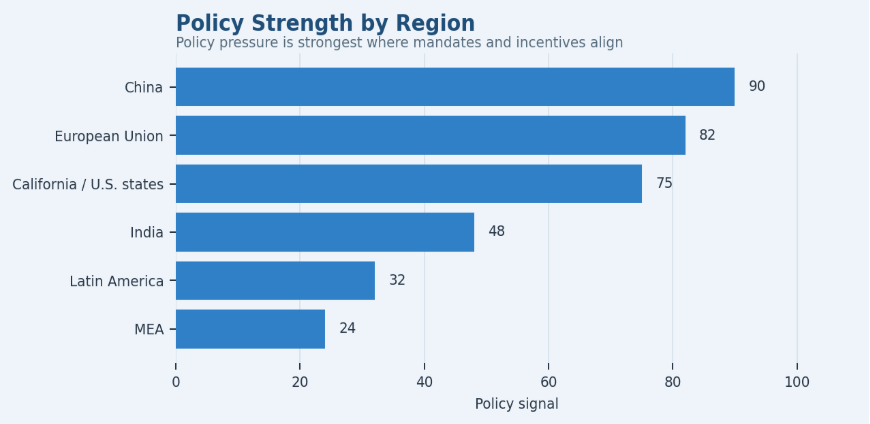
Figure 10. Policy pressure is strongest where emissions rules, fleet mandates, incentives, and charging grants move together.
| Policy Area | Market Impact | Who It Affects |
|---|---|---|
| Fleet mandates | Increases zero-emission purchases | Large fleet operators. |
| Emissions rules | Pushes OEM production | Truck manufacturers. |
| Purchase incentives | Lowers upfront cost | Buyers and fleets. |
| Charging grants | Improves infrastructure readiness | Depots and logistics hubs. |
| Low-emission zones | Changes route economics | Urban freight operators. |
Adoption Barriers: What Still Slows Electric Truck Deployment
Barriers should be treated as deployment leaks, not vague objections. Each problem has a measurable signal: price premium, depot power, charger count, grid approval time, daily mileage, payload loss, driver downtime, model availability, or maintenance readiness. That diagnostic approach keeps the article practical.
- High upfront vehicle cost remains a visible barrier, especially when incentives are uncertain or not available to smaller operators.
- Charging gaps can delay or limit deployments even when fleets want to buy vehicles.
- Grid connection delays can slow projects because utilities may need to upgrade transformers, feeders, or site capacity.
- Payload and range concerns are strongest in heavy-duty and long-haul applications where battery size affects freight economics.
- Charging downtime matters because a truck that is charging during a delivery window is not earning revenue.
- Model availability and service coverage are still uneven, which can make fleets cautious about scaling beyond small pilots.
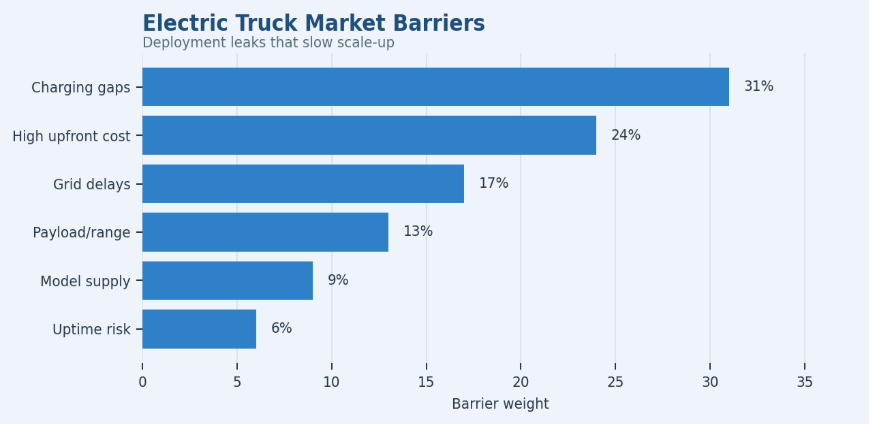
Figure 11. Electric truck barriers are concentrated around cost, charging, payload, range, and uptime.
| Barrier | Core Signal to Measure | Market Response |
|---|---|---|
| Upfront cost | Price premium after incentives | Grants, leasing, and TCO proof. |
| Charging access | Depot power and charger count | Utility coordination and site planning. |
| Range limits | Miles per route and payload | Route matching and battery sizing. |
| Charging downtime | Hours unavailable per truck | Smart scheduling and faster charging. |
| Model availability | OEM supply by class | Broader truck platforms. |
Competitive Landscape: What Electric Truck Makers Compete On
Electric truck competition is no longer only about producing a vehicle with a battery. Fleet buyers compare range, payload, charging speed, uptime, service network, warranty, software, financing, and depot support. The winning offer often looks more like an operating system than a standalone truck.
- Chinese manufacturers benefit from domestic scale and battery supply-chain depth, which supports faster volume growth in several truck categories.
- Established European OEMs such as Volvo Trucks, Daimler Truck, MAN, Scania, and Renault Trucks compete through fleet relationships, service networks, and regulatory readiness.
- North American brands and specialist entrants compete around Class 6-8 applications, drayage, regional haul, and fleet partnerships.
- Battery range matters, but it is not enough without a credible charging strategy and service plan.
- Payload remains a competitive issue because fleets cannot sacrifice freight revenue just to reduce emissions.
- Fleet software is becoming more important because charging schedules, routing, battery health, and depot energy management affect operating cost.
| Competitive Factor | Why It Matters | Best-Fit Strategy |
|---|---|---|
| Range | Determines route fit | Target specific duty cycles. |
| Payload | Protects freight economics | Improve battery and chassis design. |
| Charging speed | Reduces downtime | Pair vehicles with charger strategy. |
| Service network | Protects uptime | Support fleet confidence. |
| Software | Manages charging and routes | Improve utilization. |
Forecast Outlook: What Could Change Through 2030 and 2035
The forecast outlook should stay practical. Electric trucks are likely to grow quickly, but the growth pattern will be uneven. Medium-duty and return-to-base fleets can scale earlier, while long-haul freight depends on megawatt charging, grid upgrades, and better highway coverage.
- The global electric trucks market is projected by Grand View Research to rise from USD 39.30 billion in 2025 to USD 193.40 billion by 2033.
- China is likely to remain the largest volume market in the near term because it already accounts for over 90% of global electric truck sales.
- Europe’s forecast depends heavily on CO2 standards, OEM production plans, charger rollout, and the economics of regional freight.
- The United States could accelerate through state rules, grants, drayage requirements, depot-based fleets, and corporate logistics commitments.
- India and other emerging markets may grow from smaller bases as freight demand, urban logistics, and local incentives improve.
- Long-haul adoption remains the major uncertainty because highway charging and payload economics must improve before large-scale conversion becomes routine.

Figure 12. Electric truck growth through 2030 and 2035 depends on charging deployment, policy strength, and fleet economics improving together.
| Forecast Area | Expected Direction | Reason |
|---|---|---|
| Global sales | Upward | Regulation and fleet economics. |
| China | Strong leadership | Scale and manufacturing depth. |
| Europe | Regulation-led growth | CO2 rules and OEM transition. |
| United States | State-led acceleration | Incentives and fleet deployments. |
| Heavy-duty trucks | Gradual growth | Charging and payload remain constraints. |
90-Day Electric Truck Market Planning Framework
Statistics become more useful when they are converted into a practical planning model. For an electric truck market article, a 90-day framework keeps the research focused on what readers actually need: adoption evidence, infrastructure signals, cost logic, and forecast implications.
| Timing | What to Review | Output |
|---|---|---|
| Days 1-30 | Map global, regional, country, vehicle-class, and policy statistics | Electric truck demand map. |
| Days 31-60 | Review charging, route fit, fleet economics, incentives, and barriers | Market positioning framework. |
| Days 61-90 | Build article sections, charts, diagnostic tables, FAQ, and KPI dashboard | Production-ready statistics article. |
Electric Truck Market KPI Dashboard
The final dashboard should connect market value with operational readiness. Electric truck growth depends on vehicle supply, route fit, charging availability, policy pressure, and fleet economics. Tracking only market size would miss the actual adoption story.
| KPI | Why It Matters |
|---|---|
| Global electric truck market size | Shows total commercial opportunity. |
| Electric truck sales share | Measures adoption penetration. |
| Regional share | Shows where deployment is concentrated. |
| Country-level adoption | Identifies leading and emerging markets. |
| Medium-duty share | Shows practical early adoption. |
| Heavy-duty share | Tracks harder-to-electrify freight. |
| Depot charger count | Measures infrastructure readiness. |
| Charging cost | Affects fleet economics. |
| Battery range | Determines route suitability. |
| Incentive value | Changes purchase economics. |
| Fleet deployment count | Shows real-world commercial use. |
| TCO parity timeline | Shows when adoption can scale. |
Electric Truck Market Statistics FAQ
How big is the electric truck market?
Grand View Research estimated the global electric trucks market at USD 39.30 billion in 2025 and projected it to reach USD 193.40 billion by 2033. That forecast makes electric trucks one of the faster-growing commercial vehicle categories, but the growth is not evenly distributed. China leads current sales volume, while Europe and North America are still building the charging, policy, and fleet procurement systems needed for broader deployment.
What is the expected CAGR of the electric truck market?
One major estimate projects a 20.9% CAGR from 2026 to 2033 for the global electric trucks market. CAGR should be read with context because forecasts differ by vehicle class and definition. A market that includes light, medium, and heavy electric trucks will usually look larger than one focused only on heavy-duty vehicles. The practical takeaway is that growth is expected to be strong, but dependent on infrastructure and fleet economics.
Which country leads electric truck sales?
China is the clear country leader. IEA data shows electric truck sales surpassed 400,000 units in 2025, with China accounting for over 90% of global electric truck sales. China also reached a strong domestic penetration signal, with one in four trucks sold being electric in 2025. That gives China a much larger current scale than the United States, Europe, India, or Latin America.
Why is China so dominant in electric trucks?
China combines industrial policy, battery supply-chain depth, commercial EV manufacturing scale, urban logistics demand, and local fleet adoption. The result is a market where electric trucks are not only pilot vehicles. They are being sold at substantial volume. The IEA’s over 90% global sales share signal shows that global electric truck statistics are currently heavily shaped by China’s domestic market.
How many zero-emission trucks are deployed in the United States?
CALSTART reported more than 59,000 zero-emission trucks operating in the United States by mid-2025. That number is important because it reflects real-world deployment, not only vehicle announcements. U.S. adoption is strongest in state-led and fleet-led settings, especially where grants, drayage rules, return-to-base operations, and depot charging make commercial deployment more practical.
Which electric truck segments are growing fastest?
The easiest early segments are usually medium-duty delivery, port drayage, refuse collection, municipal service, and other return-to-base fleets. These use cases work because daily routes are predictable, vehicles can return to the same depot, and charging can be scheduled around shifts. Heavy-duty and long-haul trucks have large potential, but they face tougher requirements around range, payload, charging speed, and highway infrastructure.
Are electric trucks cheaper to operate than diesel trucks?
Electric trucks can be cheaper to operate on routes where electricity cost, maintenance savings, incentives, and utilization offset the higher purchase price and charging investment. The business case is strongest for predictable, high-mileage routes where trucks return to a depot. A simple fuel-cost comparison is not enough. Fleets need a route-level TCO model that includes vehicle price, grants, tariffs, chargers, maintenance, uptime, and residual value.
What is the biggest barrier to electric truck adoption?
Charging is often the biggest practical barrier because it affects every part of daily operations. Depot power, charger count, utility timelines, charging speed, driver schedules, and software all decide whether electric trucks can operate reliably. Upfront cost, payload concerns, model availability, and range also matter, but charging readiness is the key bridge between vehicle sales targets and actual fleet deployment.
How important is charging infrastructure for electric trucks?
Charging infrastructure is central to electric truck adoption. A fleet can buy vehicles, but deployment can stall if the depot lacks power, chargers arrive late, or utility approvals take too long. Corridor charging is also important for regional and long-haul freight. That is why infrastructure data should sit beside market-size and sales data in any serious electric truck statistics article.
What is the future outlook for electric trucks by 2030 and 2035?
The outlook is positive but uneven. Market value forecasts point to strong growth through 2030 and 2035, and one projection reaches USD 193.40 billion by 2033. Growth should be fastest where policy, charging, fleet economics, and vehicle availability align. Medium-duty and return-to-base fleets are likely to scale first, while long-haul adoption depends on megawatt charging, grid upgrades, and stronger highway corridors.
Final Takeaway
Electric truck market statistics point to a market that is growing quickly but unevenly. The strongest adoption is happening where policy, fleet economics, vehicle availability, and charging infrastructure align. China has already created the world’s largest volume base, while Europe is being shaped by emissions regulation and OEM transition plans. The United States is moving through state-level rules, grants, port programs, and fleet deployments. Emerging markets are still earlier, but logistics hubs, urban delivery, mining, ports, and municipal fleets can create targeted demand.
For fleets, the question is not only whether electric trucks are cleaner. The practical question is whether a specific route, depot, charger, power connection, incentive package, vehicle class, and service model can work as a reliable commercial system. A truck that fits one city delivery route may not fit a long-haul route. A strong TCO case in one state may not work in another if electricity prices, grants, or depot upgrade costs differ.
For manufacturers, charging providers, policymakers, and logistics companies, the next phase is about reducing deployment friction. The market needs more suitable models, stronger charging corridors, faster utility coordination, better depot planning, clearer incentives, and fleet software that protects uptime. The best electric truck statistics article should therefore do more than report market value. It should explain where adoption is real, where it is still blocked, and which signals show whether electric trucks are moving from pilots into repeatable fleet operations.


