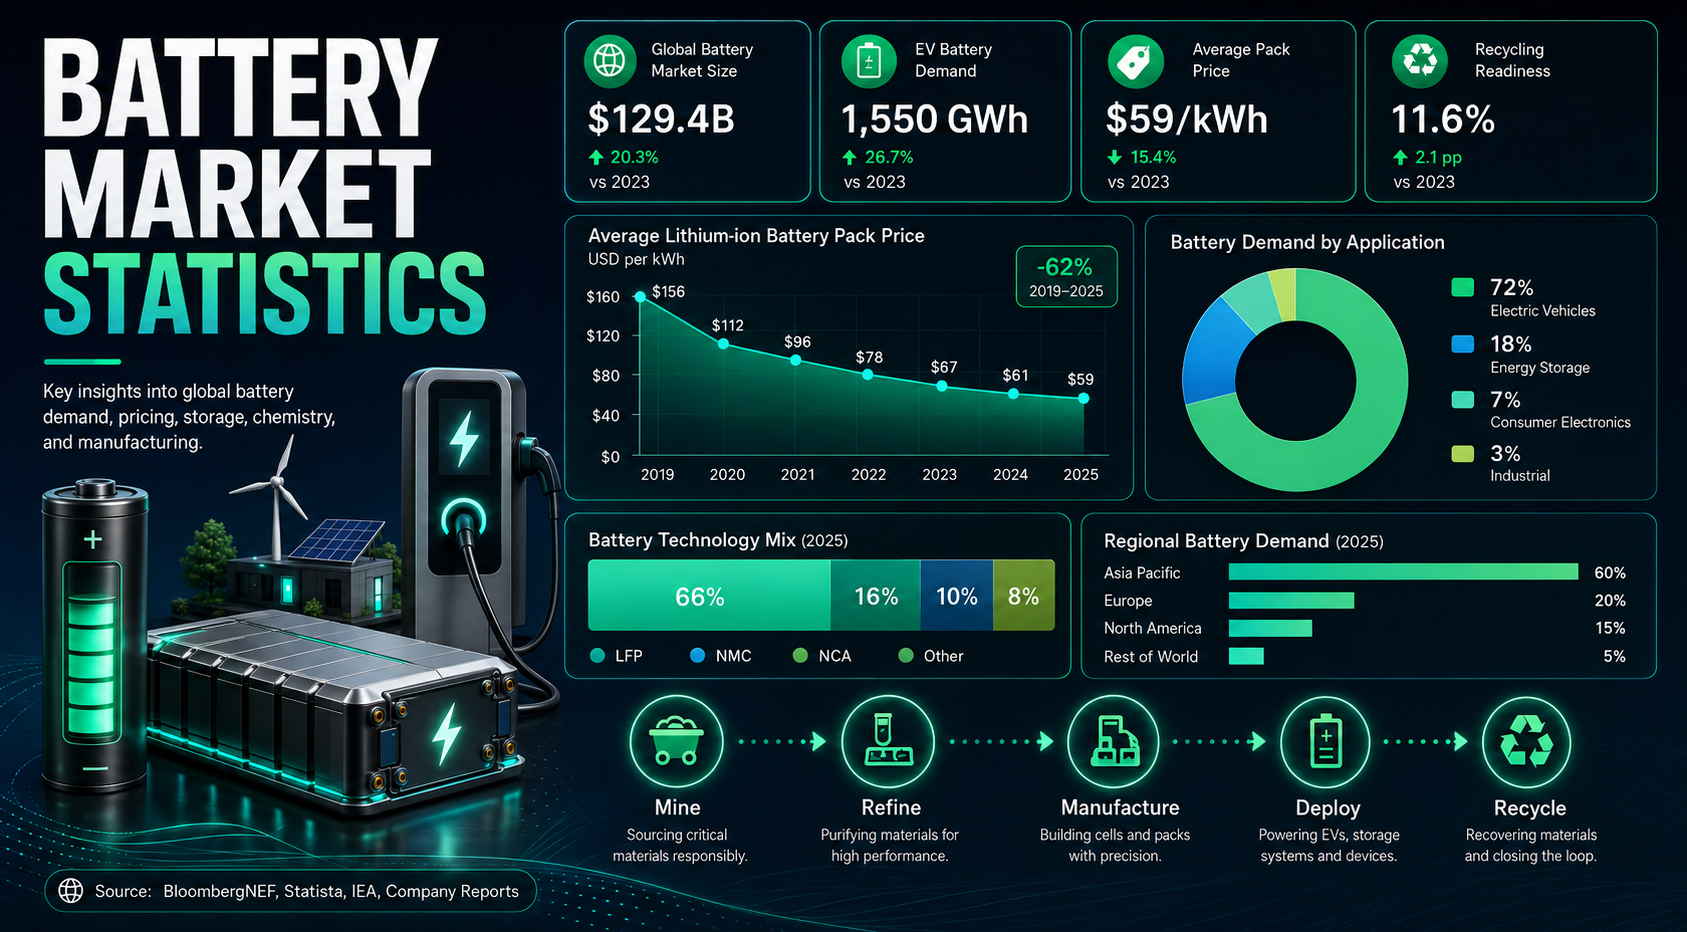
Battery markets have moved from a narrow device category into one of the main measurement points for electrification, grid flexibility, industrial resilience and national supply-chain strategy. The numbers now matter to automakers, utilities, data-center operators, mineral suppliers, recyclers, investors and policy teams because each group reads battery demand through a different risk lens.
The strongest battery-market signals are not only the largest numbers. Market value, EV deployment, storage additions, chemistry mix, pack prices, mineral concentration, manufacturing capacity and recycling readiness all explain a different part of the same system. Read together, they show where demand is expanding, where bottlenecks can appear, and which benchmarks leaders should track before making investment or procurement decisions.
Executive Battery Market Benchmarks
The executive benchmark view turns the battery market into a short set of signals without forcing readers through a raw data list. Market value is useful, but demand, regional share, storage additions, price direction and mineral exposure need to be read together so each number has business meaning.
- At USD 150 billion+, the lithium-ion battery market is now large enough to sit inside energy, mobility and industrial-planning decisions, not just consumer electronics.
- EV batteries still set the volume story: deployment is around 1.2 TWh, so vehicle mix and pack size remain the first demand signals to watch.
- China represents about 60% of global EV battery deployment, which is why its chemistry choices, cell capacity and vehicle demand affect global pricing and supply confidence.
- The European Union is closer to 15% of deployment, but its regulations, import exposure and localization goals make it more influential than volume alone suggests.
- The United States is near 10% of deployment, yet larger vehicles and higher pack sizes can make its battery intensity stronger than its sales share appears.
- Annual storage additions near 106 GW show that grid batteries are no longer a side story; they now influence procurement, interconnection and project-finance planning.
- Storage demand matters because utilities and developers buy batteries for grid flexibility, peak management, renewable integration and uptime rather than vehicle range.
- Portable electronics have dropped below 5% of deployment, showing how far battery growth has shifted from phones and laptops toward vehicles and infrastructure.
- LFP chemistry is now a major cost and safety benchmark because it lowers nickel and cobalt exposure while supporting mainstream EV and storage use cases.
- NMC and NCA still matter where range, weight and performance carry more value than the lowest possible cell cost.
- Battery-price direction is one of the clearest adoption signals because every cost movement changes EV affordability, storage payback and replacement-cycle economics.
- Critical minerals remain the supply-chain pressure point because mining, refining and cell manufacturing are concentrated in different places and move at different speeds.
- Recycling is still early as a volume signal, but it becomes more important as installed EV and storage batteries age into recoverable material streams.
- The practical takeaway is simple: battery markets should be read as a system where demand, price, chemistry, storage, minerals, manufacturing and recycling move together.
These benchmarks work best when they are read together. A strong demand number is less useful if prices rise, mineral supply tightens or manufacturing capacity cannot qualify fast enough. That is why the article treats each statistic as a signal inside a wider operating system rather than as a standalone fact.
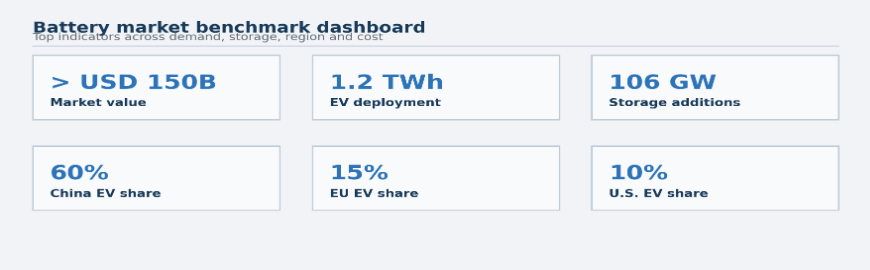
Figure 1. The dashboard groups market value, deployment, storage, regional share and price pressure into one benchmark view.
| Area | Current signal | Market meaning |
|---|---|---|
| Lithium-ion batteries | Market above USD 150B | Core engine for EVs and storage |
| EV batteries | Deployment near 1.2 TWh | Largest volume and procurement signal |
| Stationary storage | Annual additions near 106 GW | Fast grid-linked growth category |
| Battery prices | Multi-year cost index falling | Main affordability benchmark |
| Critical minerals | Lithium, nickel, cobalt, graphite | Supply-chain pressure signal |
| Recycling | Recovered materials and black mass | Circular supply readiness signal |
Battery Demand Sources
Battery demand is most useful when it is separated by use case. EVs dominate deployment, but grid storage, industrial backup and long-tail applications are what turn batteries into a wider infrastructure market. That mix is why the same industry now serves automakers, utilities, households, factories and data centers at the same time.
- EVs carry the largest share of deployment, but the real demand signal comes from vehicle type, pack size and regional model mix, not sales volume alone.
- Grid storage supplied more than 15% of lithium-ion deployment in 2025, which is large enough to influence cell procurement, project queues and utility planning.
- Portable electronics now contribute below 5% of deployment, so they remain useful for quality signals but no longer define market growth.
- Industrial backup is smaller by volume, yet it carries business value because downtime, automation and data-center reliability turn battery performance into an operating issue.
- Marine, two-wheelers, off-grid systems and specialty equipment add long-tail demand that can grow quickly in regions where passenger EV adoption is still early.
- Separating demand sources prevents an EV-only story from hiding the growth of grid, industrial and specialty battery buyers.
This split also changes how the numbers should be interpreted. Automakers care about pack size, cost and range; utilities care about duration, uptime and interconnection; industrial users care about continuity and reliability. The same battery market therefore serves buyers with very different definitions of value.
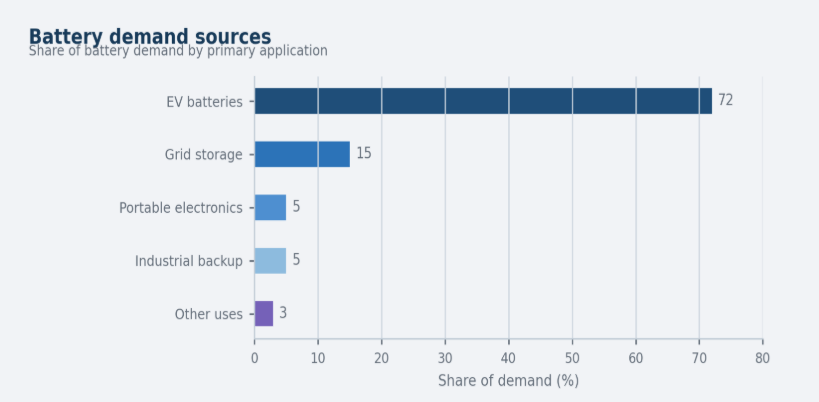
Figure 2. Battery demand remains EV-led, while storage and backup use cases explain why buyers now read batteries as infrastructure.
| Demand source | Signal to watch | Why it matters |
|---|---|---|
| EV batteries | GWh/TWh deployment | Largest volume driver |
| Grid storage | GW/GWh additions | Fastest infrastructure use case |
| Portable electronics | Device battery demand | Mature, slower-growth segment |
| Industrial backup | Reliability demand | Supports factories and data centers |
| Other uses | Specialty battery demand | Shows long-tail market depth |
EV Battery Demand and Regional Concentration
EV battery demand is the strongest growth engine, but vehicle counts alone do not tell the full story. Battery capacity depends on pack size, vehicle type, regional model mix, driving-range expectations, climate, charging access and policy incentives. A smaller EV market with larger packs can create a larger battery signal than sales share suggests.
- Global EV battery deployment of roughly 1.2 TWh confirms that transport remains the largest lithium-ion use case, but the demand story changes by market.
- China accounts for about 60% of global EV battery deployment, so any global battery view has to start with Chinese demand, supply and chemistry mix.
- Europe is around 15%, yet its policy and localization signals make it a strategic benchmark beyond the pure deployment number.
- The United States is around 10%, but larger average packs can raise battery intensity even when vehicle-count share is lower.
- Emerging markets outside China are smaller today, but two-wheelers, buses and storage can build battery demand before passenger-car penetration matures.
- Regional EV battery demand is really a concentration benchmark, not just an automotive sales map.
- Pack-size differences explain why battery demand can rise even when vehicle volumes grow unevenly across regions.
The regional picture is therefore not a simple leaderboard. China sets scale, Europe shapes policy expectations, the United States changes the pack-size reading and emerging markets can grow through buses, two-wheelers and storage before passenger EVs dominate.
This is where the article needs a human reading of the data. A percentage share tells the reader where demand sits today, but the surrounding explanation shows why the same share can mean different things in different markets. Policy, vehicle size, charging access, local manufacturing and buyer income all change the meaning of regional battery statistics.
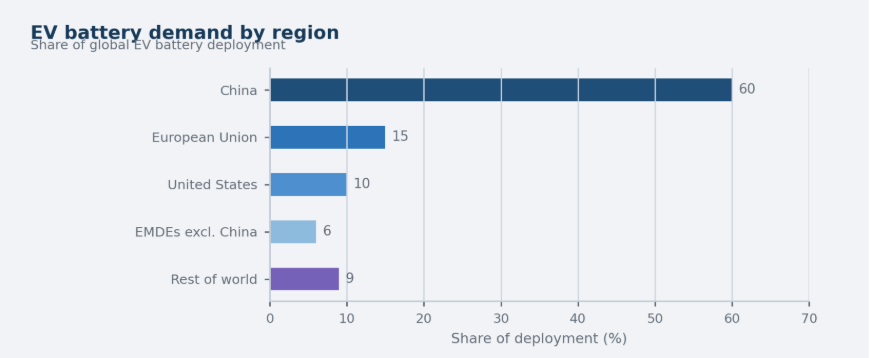
Figure 3. Regional battery demand is concentrated enough that China, Europe and the United States need separate benchmark readings.
| Region | Battery signal | Why it matters |
|---|---|---|
| China | Largest deployment base | Scale and cost leadership |
| European Union | Regulation and imports | Localization pressure |
| United States | Larger pack sizes | High battery-intensity signal |
| EMDEs excl. China | Early growth layer | Next adoption market |
| Rest of world | Smaller but expanding demand | Long-term market broadening |
Battery Market Value and Growth
Market value helps readers understand the economic scale of batteries, but it should not be treated as the only benchmark. A rising value line can reflect volume growth, chemistry changes, storage projects, manufacturing investment, price changes and upstream supply pressure. The trend is strongest when read alongside deployment, not in isolation.
- A lithium-ion market above USD 150 billion puts batteries in the same strategic conversation as large energy, mobility and industrial supply chains.
- Growth through 2030 depends less on one headline forecast and more on EV deployment, grid-storage additions and usable manufacturing capacity arriving together.
- Market value can keep rising even when unit prices decline because volume growth is expanding faster than cost compression in many segments.
- Storage projects add a second growth channel tied to grid planning, renewable integration and interconnection timing rather than vehicle replacement cycles.
- Industrial and data-center demand can support the market when consumer cycles soften because uptime and power reliability remain operational priorities.
- A useful market-size reading compares value, volume and price direction together instead of treating any one metric as the full story.
This is the reason market value should sit beside deployment and cost metrics. A larger market can reflect more batteries, higher-value systems, new storage projects or a temporary price shift. Human readers need that context so a big number does not become a misleading headline.
| Area | Current signal | Growth meaning |
|---|---|---|
| Lithium-ion batteries | Market-value growth | Broad market expansion |
| EV batteries | Deployment volume | Core demand engine |
| Stationary storage | GW/GWh additions | Grid-linked growth |
| Industrial batteries | Backup and uptime demand | Reliability-driven use |
| Recycling | Recovered material flow | Circular supply development |
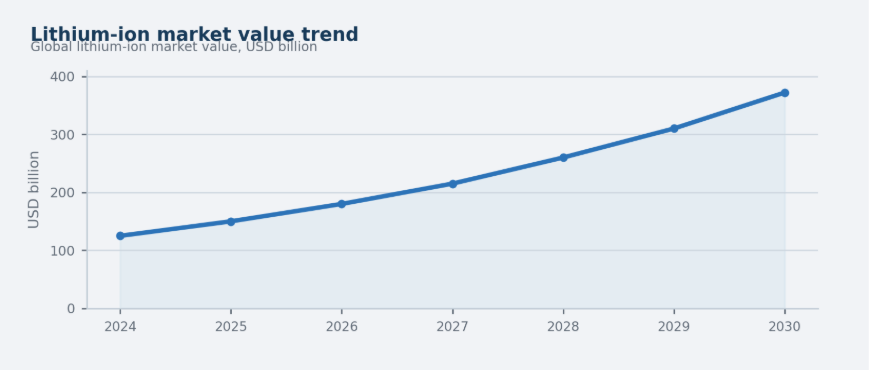
Figure 4. Market value growth shows how batteries have moved from component supply into energy-infrastructure scale.
Battery Storage Statistics
Battery storage is the clearest sign that batteries are no longer only a transport technology. Storage systems help grids absorb renewable power, shift demand, reduce curtailment, provide backup capacity and support reliability. That makes storage statistics especially important for utilities, developers, data centers, campuses and industrial buyers.
- Annual energy storage additions near 106 GW show that grid-linked battery demand is scaling quickly enough to shape cell procurement and power-market planning.
- Utility-scale projects create the strongest storage signal because they are tied directly to renewable integration, capacity planning and grid flexibility.
- Commercial systems grow for a different reason: they help businesses manage demand charges, backup needs and site-level energy control.
- Residential storage links batteries to rooftop solar, backup power and household energy independence rather than fleet electrification.
- Data centers and AI infrastructure increase the value of reliable power, which makes backup capacity and fast response more valuable.
- For many storage projects, duration, interconnection queues and project finance now matter as much as the cell price itself.
Storage also brings battery statistics closer to infrastructure finance. A cheaper cell does not automatically make a project viable if interconnection is delayed, warranty terms are weak or the revenue stack is unclear. The better benchmark is the whole delivered system, not the cell alone.
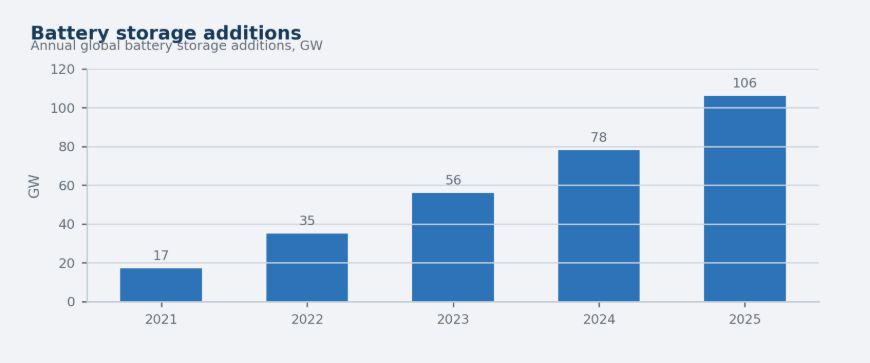
Figure 5. Storage additions show how quickly grid-side demand is becoming a second growth pillar beside EV deployment.
| Storage type | Main buyer | Benchmark signal |
|---|---|---|
| Utility-scale | Grid operators/developers | GW/GWh additions |
| Commercial | Businesses and campuses | Demand-charge savings |
| Residential | Households | Backup and solar self-use |
| Data centers | Cloud and AI operators | Reliability and uptime |
| Industrial | Factories and sites | Power continuity |
Battery Chemistry Statistics
Chemistry statistics explain why battery demand is also a mineral and manufacturing story. Different chemistries change cost, energy density, safety, charging behavior and exposure to lithium, nickel, cobalt, manganese, iron, phosphate and graphite. The chemistry mix therefore helps readers understand both market strategy and supply risk.
- LFP has become a major benchmark because it supports cost-sensitive EVs and storage systems while reducing exposure to nickel and cobalt.
- NMC and NCA remain important for vehicles where range, weight and performance justify higher material exposure.
- Sodium-ion is still small, but it matters as a potential low-cost option for selected applications where lithium exposure is a concern.
- Solid-state batteries remain more of a future premium signal than a current mass-market volume driver.
- Chemistry choice also changes recycling economics because recovered material value differs sharply by cathode composition.
- Battery buyers now compare chemistry through cost, safety, life cycle, mineral exposure and supply security, not energy density alone.
That makes chemistry a decision lens rather than a technical footnote. A fleet buyer, a utility and a consumer-electronics manufacturer may all prefer different trade-offs, so chemistry statistics need explanation around use case and operating risk.
For example, a lower-cost chemistry may help storage projects reach financial close, while a higher-energy chemistry may still be preferred where vehicle weight, range and premium positioning matter. The statistic only becomes useful when it is tied to the buyer decision it affects.
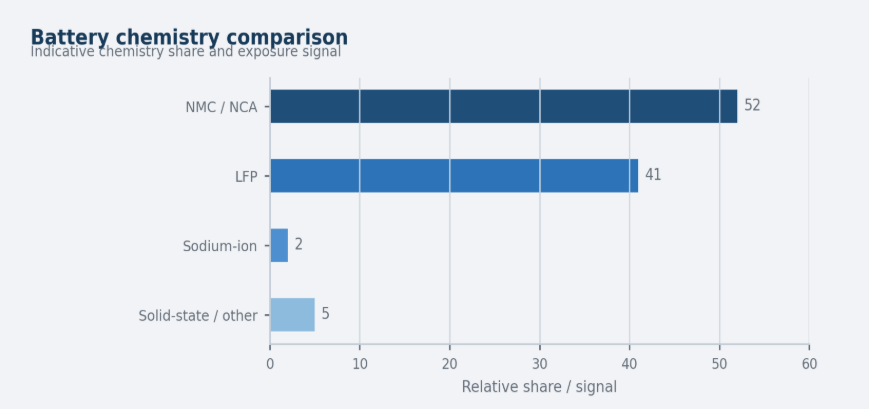
Figure 6. Chemistry benchmarks connect cost, range, safety and mineral exposure in one market signal.
| Chemistry | Market role | Supply-chain meaning |
|---|---|---|
| LFP | Cost and safety | Reduces nickel/cobalt exposure |
| NMC/NCA | Range and performance | Higher nickel/cobalt exposure |
| Sodium-ion | Emerging low-cost option | Reduces lithium exposure |
| Solid-state | Future premium segment | Still commercialization-stage |
Battery Price and Cost Statistics
Battery prices remain one of the strongest adoption indicators because they affect EV affordability, storage project economics, replacement cycles and business-case timing. Price analysis should use a multi-point trend because a two-point line can hide volatility from raw materials, shipping, factory utilization and technology shifts.
- Long-term battery-cost decline has helped EVs and storage projects move from early adoption into mainstream planning cycles.
- A BESS price index moving from 100 in 2020 to about 61 in 2025 shows why storage economics can improve even when project costs remain site-specific.
- Short-term price pressure can still return when lithium, nickel, graphite or shipping costs move faster than buyers can adjust procurement.
- Factory utilization matters because underused plants can weaken unit economics even when headline capacity looks sufficient.
- Pack price remains the clearest affordability benchmark because it links cells, integration, safety systems and manufacturing cost into one buyer-facing signal.
- Recycling can reduce long-term material pressure, but it cannot remove the need for primary supply during a fast-growth phase.
Cost data should be read with the same caution. Falling price indexes support adoption, but real projects still face permitting, installation, warranty, freight and financing costs. A human benchmark view explains what the price signal can and cannot tell the buyer.
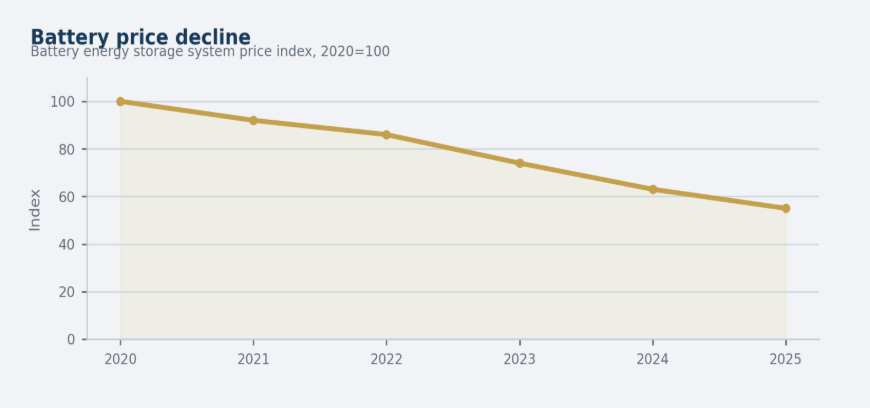
Figure 7. Battery price direction is an affordability signal for EVs, storage projects and backup systems.
| Cost driver | Signal to watch | Why it matters |
|---|---|---|
| Pack price | USD/kWh or index | Direct EV/storage affordability |
| Lithium | Raw-material price | Affects cathode and electrolyte cost |
| Nickel | High-energy chemistry exposure | Raises cost volatility |
| Factory utilization | Production scale | Improves unit economics |
| Recycling | Recovered material supply | Reduces long-term material pressure |
Regional and Country-Level Battery Roles
Country-level statistics are often misleading when countries are ranked with unrelated measures. A cleaner benchmark approach groups countries by market role. Some lead demand, some control manufacturing capacity, some supply minerals, some scale storage projects, and others push technology, recycling or policy standards.
- China is the largest demand and manufacturing benchmark because it combines EV adoption, cell production and strong LFP scale in one market.
- The United States is a storage and large-pack benchmark because vehicle size, storage projects and policy support shape a different demand profile.
- Germany represents European demand and manufacturing pressure through automotive scale, regulation and localization needs.
- South Korea and Japan remain important technology and cell-manufacturing benchmarks even when their domestic deployment shares are smaller.
- Australia, Chile, Indonesia and the DRC matter because raw-material supply can shape global battery costs, project timing and supply security.
- Country roles should be compared by function; one market may lead in demand while another controls minerals, refining or cell technology.
This functional view prevents country statistics from becoming a flat ranking. A country can matter because it buys batteries, manufactures cells, refines minerals, installs storage or recovers materials. Each role creates a different kind of market influence.
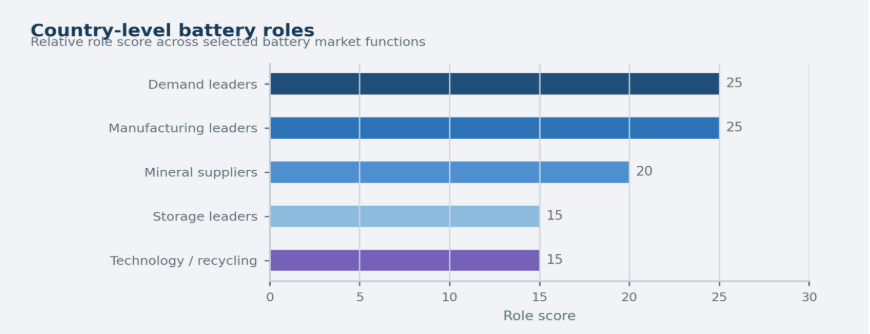
Figure 8. Country roles show whether leadership comes from demand, manufacturing, minerals, storage or technology.
| Role | Countries | Market meaning |
|---|---|---|
| Demand leaders | China, U.S., Germany | Drive deployment volume |
| Manufacturing leaders | China, Korea, Japan, Poland, Hungary | Control cell supply |
| Mineral suppliers | Australia, Chile, DRC, Indonesia | Shape raw-material exposure |
| Storage leaders | U.S., China, Australia, UK | Drive grid battery adoption |
| Technology/recycling leaders | Japan, Korea, Europe, U.S. | Improve lifecycle value |
Critical Minerals and Supply Chain Risk
Battery supply-chain risk is concentrated because mining, refining and cell manufacturing are not evenly distributed. Mineral statistics therefore explain why a battery market can grow quickly while still facing bottlenecks. Lithium, nickel, cobalt, graphite and manganese all affect different parts of the chemistry and cost story.
- Cobalt mining remains highly concentrated, so geography becomes a direct risk signal for NMC and NCA supply chains.
- Graphite refining concentration is a major anode risk because processing capacity can matter as much as raw mining supply.
- Lithium supply is broader than cobalt, but rapid demand growth can still create price, permitting and project-timing pressure.
- Nickel matters most for higher-energy chemistries and can become volatile when stainless steel and battery demand compete.
- Manganese is important in cathode formulations and can support cost, performance and chemistry optimization.
- Mineral concentration should be measured with clean comparison charts rather than mixed-unit country rankings that blur the risk signal.
Supply-chain risk is not only about scarcity. It is also about processing location, permitting speed, shipping exposure, battery-grade qualification and how quickly buyers can switch chemistry. That is why mineral statistics need short explanations around the number.
A market can have enough material in theory but still face delays if refining, qualification, shipping, permitting or customer validation moves too slowly. That is why the mineral section explains the operating risk behind the concentration numbers instead of presenting them as isolated facts.
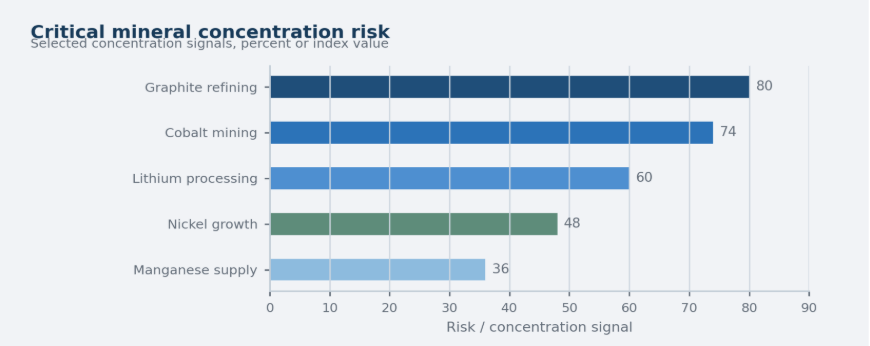
Figure 9. Mineral concentration benchmarks show where supply-chain risk can rise even when demand is strong.
| Material | Core battery use | Risk signal |
|---|---|---|
| Lithium | Cathodes and electrolyte | Demand growth and refining concentration |
| Nickel | High-energy cathodes | Price and supply volatility |
| Cobalt | Cathode stability | Geographic concentration |
| Graphite | Anodes | Refining concentration |
| Manganese | Cathode formulations | Cost and availability |
Manufacturing and Gigafactory Statistics
Manufacturing statistics connect battery demand to physical output. Gigafactory announcements can look impressive, but market readiness depends on whether factories are built, qualified, staffed, supplied with materials and operating at useful utilization rates. Capacity without throughput does not solve battery supply risk.
- Cell-making capacity is the clearest manufacturing benchmark because it determines how much usable battery supply can reach EV and storage buyers.
- Refining and cathode/anode capacity can become bottlenecks even when new cell plants have been announced.
- Pack assembly matters because cells still have to become safe, certified systems for vehicles and stationary storage.
- Factory utilization is as important as headline capacity because low utilization weakens unit economics and delays learning curves.
- Localization policies can shift investment even when the underlying demand signal remains global.
- Manufacturing risk should be tracked across the full chain rather than through plant announcements alone.
Announced capacity is useful, but it is not the same as qualified output. A factory needs materials, trained labor, yield improvement, customer validation and stable demand before it becomes a reliable supply benchmark.
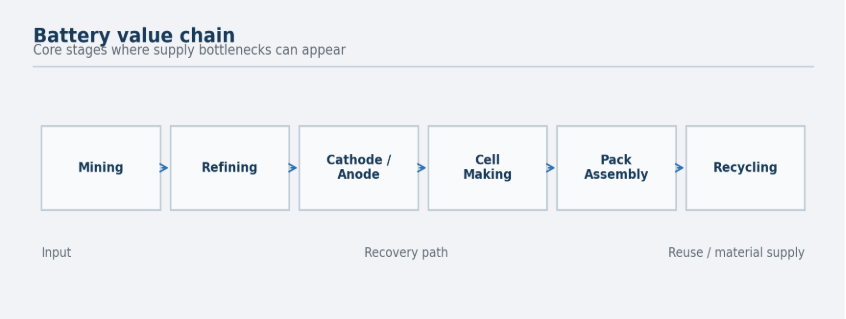
Figure 10. Value-chain control points show where market growth can be delayed by upstream or midstream bottlenecks.
| Stage | Signal to watch | Why it matters |
|---|---|---|
| Mining | Material supply | Sets raw input availability |
| Refining | Processing capacity | Creates bottleneck risk |
| Cathode/anode | Component capacity | Links minerals to cells |
| Cell making | GWh capacity | Determines battery output |
| Pack assembly | System integration | Turns cells into usable systems |
| Recycling | Recovery capacity | Supports circular supply |
Battery Recycling and Second-Life Battery Statistics
Recycling and second-life statistics are becoming more important as the installed battery base grows. The market is still early compared with primary mining and manufacturing, but recycling supports long-term material recovery, waste reduction, safety management and supply-chain resilience. Its value increases as more EV and storage batteries reach end of life.
- Battery collection is the first recycling benchmark because feedstock availability determines whether recycling plants can operate efficiently.
- Sorting and chemistry identification matter because recovery value differs by battery type and contamination can lower material quality.
- Black mass production is an intermediate benchmark showing whether end-of-life batteries are actually moving into recoverable material streams.
- Recovered materials still need refining before recycled metals can return to battery-grade supply chains.
- Second-life use can extend value in selected cases, but safety, warranty and performance requirements limit broad application.
- Recycling readiness should be tracked before large end-of-life volumes arrive, not after capacity is already needed.
Recycling data becomes more meaningful when it is tied to timing. Early markets may have limited feedstock, while later markets need collection, sorting and refining systems ready before old batteries arrive in large volumes.
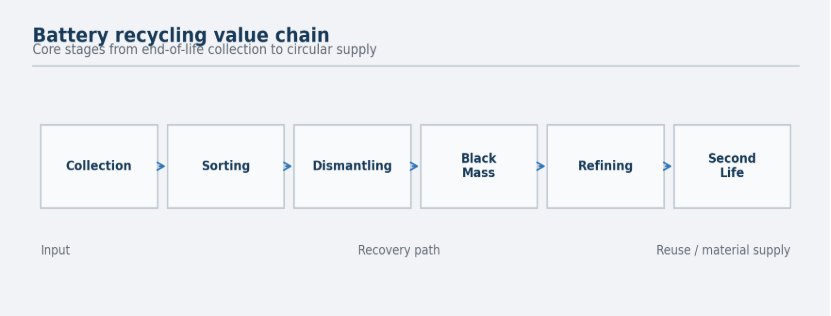
Figure 11. Recycling becomes more important as installed EV and storage batteries age into recoverable material streams.
| Recycling stage | Signal to watch | Market meaning |
|---|---|---|
| Collection | End-of-life battery volume | Defines feedstock availability |
| Sorting | Chemistry identification | Improves recovery quality |
| Dismantling | Safe processing | Reduces handling risk |
| Black mass | Recovered material output | Main intermediate product |
| Refining | Material recovery | Returns metals to supply chain |
| Second life | Reuse potential | Extends battery value |
Battery Investment Statistics
Investment statistics show where the market expects pressure, opportunity and policy support. Capital does not move only to cell plants. It also moves to storage projects, mineral supply, refining, recycling, new chemistries, software, safety systems and manufacturing localization. That investment mix is a practical signal of where market actors expect constraints or growth.
- Cell-plant investment remains central because supply scale is needed for both EV and storage growth.
- Storage investment reflects grid flexibility, renewable integration and reliability requirements rather than vehicle demand alone.
- Mineral and refining investment often responds to supply-security concerns before shortages appear in finished battery prices.
- Recycling investment is a forward-looking signal tied to future feedstock, circular supply and policy expectations.
- Solid-state and sodium-ion investment shows that buyers still expect technology shifts even though current deployment is led by established chemistries.
- Investment works best as a mix of signals rather than one headline spending number, because capital follows risk across the full battery system.
Investment therefore says as much about perceived bottlenecks as it says about opportunity. When capital moves into refining, storage or recycling, it often reveals where the market expects pressure before that pressure appears in headline demand numbers.
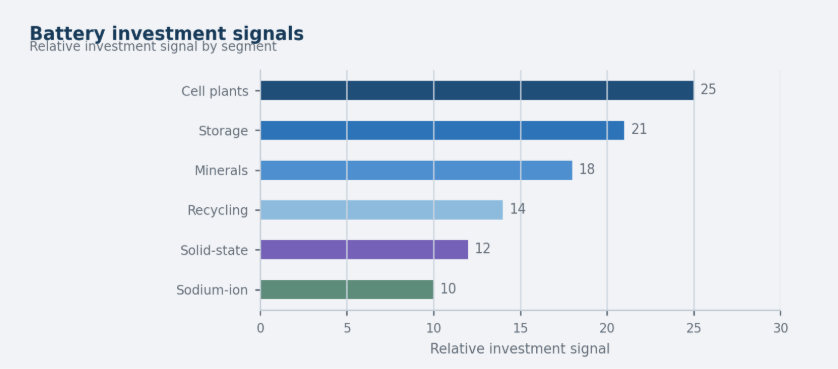
Figure 12. Investment spreads across cells, storage, minerals, recycling and next-generation chemistries because risk sits across the full system.
| Investment area | Signal to watch | Why it matters |
|---|---|---|
| Cell plants | GWh capacity | Determines supply scale |
| Storage | Project pipeline | Shows grid-side growth |
| Minerals | Mine/refining projects | Shows supply security |
| Recycling | Recovery facilities | Shows circular readiness |
| New chemistry | Sodium-ion/solid-state funding | Shows next technology wave |
Battery Market Risk Diagnostic
A strong benchmark report ends with a diagnostic view because market leaders need to know what to monitor next. Battery risk is distributed across demand concentration, minerals, cost, storage execution, manufacturing capacity, recycling readiness and quality. The diagnostic view turns those risks into signals that can be checked repeatedly rather than read once and forgotten.
| Problem area | Core signal | Useful benchmark |
|---|---|---|
| Demand concentration | EV deployment by region | China/EU/U.S. shares |
| Mineral pressure | Lithium, nickel, cobalt, graphite demand | Annual demand growth |
| Cost pressure | Pack prices and raw materials | USD/kWh or BESS index |
| Storage execution | GW/GWh additions | Annual storage additions |
| Manufacturing risk | Capacity vs utilization | GWh capacity and output |
| Recycling readiness | Feedstock and processing capacity | Recycling volume |
| Quality risk | Warranty, degradation, recalls | Cycle life and safety metrics |
90-Day Battery Benchmark Plan
A 90-day plan helps convert market statistics into a repeatable monitoring system. The first month should establish the baseline, the second should test supply-chain exposure, and the third should turn the work into a scorecard that teams can update without rebuilding the report from scratch.
| Timing | What to do | Output |
|---|---|---|
| Days 1-30 | Build baseline across demand, storage, region, chemistry and price | Battery benchmark map |
| Days 31-60 | Review minerals, manufacturing, recycling and policy signals | Supply-chain risk list |
| Days 61-90 | Compare demand, cost, capacity and recycling readiness | Repeatable battery scorecard |
Metrics Battery Market Leaders Should Track
Battery leaders need a small group of metrics that can be updated consistently. The goal is not to track every public statistic. The goal is to maintain a scorecard that reflects demand, cost, chemistry, minerals, storage, manufacturing, recycling and quality with enough frequency to support decisions.
The scorecard is deliberately narrow. A battery team does not need every public figure every month; it needs the few indicators that show whether demand is expanding, costs are moving, supply risk is changing and recycling readiness is improving.
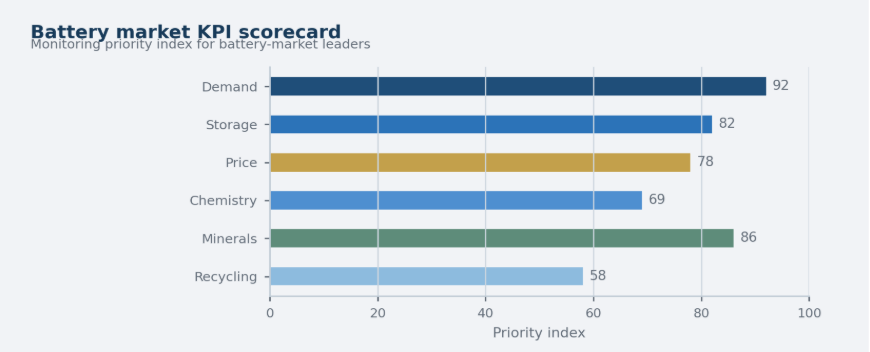
Figure 13. A compact KPI dashboard keeps market tracking focused on signals that affect procurement, investment and strategy.
| KPI | What it measures | Why it matters |
|---|---|---|
| EV battery deployment | Transport demand | Largest volume driver |
| Storage additions | Grid battery scale | Infrastructure demand |
| Battery price | Affordability | EV/storage economics |
| Chemistry mix | Supply exposure | Mineral dependency |
| Mineral concentration | Supply-chain risk | Bottleneck exposure |
| Recycling capacity | Circular readiness | Long-term resilience |
How to Use Battery Market Benchmarks
Battery benchmarks work best when they are used as a compact decision system, not as a long list of disconnected statistics. Different teams may start from different signals, but the most useful view separates demand, cost, supply chain, region and recycling before drawing conclusions.
- Demand benchmarks should start with EV battery deployment, storage additions and end-use mix because these signals show where market pull is strongest.
- Price benchmarks should combine pack cost, BESS price index and installed system cost because delivered economics change by chemistry, warranty and installation.
- Regional benchmarks should keep China, Europe, the United States and emerging markets separate because policy, pack size and manufacturing exposure differ by region.
- Supply-chain benchmarks should track minerals, refining, cathode/anode capacity, cell output and logistics rather than treating all countries as comparable on one scale.
- Recycling benchmarks should be read by feedstock timing, chemistry sorting, black mass output and refining capacity because circular supply depends on process readiness.
Table. Battery benchmark use guide
The best use of the benchmark table is not to treat every row equally. Procurement teams may start with price and chemistry, investors may start with capacity and utilization, and grid planners may start with storage duration and interconnection. The report becomes more useful when each team can enter through its own decision point and still arrive at the same market picture.
| Benchmark area | What to check | Why it matters |
|---|---|---|
| Demand | EV deployment; storage additions | Shows market pull |
| Cost | Pack price; BESS index; installed cost | Shows adoption pressure |
| Supply chain | Minerals; refining; cell output | Shows bottleneck risk |
| Region | China; Europe; U.S.; EMDEs | Shows concentration |
| Recycling | Feedstock; black mass; refining | Shows circular readiness |
Segment-by-Segment Battery Market Interpretation
A closer benchmark view separates battery markets by buyer, use case and operating risk. EVs, storage, industrial backup, consumer electronics, manufacturing, minerals, recycling, investment, policy and safety do not move in the same way, so each segment needs its own signal set.
- EV demand should be read with pack size and vehicle mix, not only sales volume.
- Storage demand needs both GW and GWh context because duration changes battery content.
- Industrial batteries are smaller by volume, but they matter because uptime has direct business value.
- Consumer electronics remain useful as a quality benchmark even though their deployment share is now smaller.
- Manufacturing capacity should distinguish announced, qualified and operating output.
- Mineral benchmarks should focus on battery-grade processed supply, not raw resources alone.
- Recycling should be measured through collection, sorting, black mass and recovered materials.
- Policy and safety signals decide which projects can scale smoothly and which face delay.
Table. Segment interpretation guide
Segment interpretation keeps the statistics from becoming a flat list. EVs, storage, industrial backup and recycling all use batteries, but they are measured through different operating questions. A human-written benchmark report should make those differences clear before the reader compares the numbers.
| Segment | Signal | Meaning |
|---|---|---|
| EV batteries | Deployment and pack size | Shows the largest volume signal. |
| Grid storage | GW, GWh and duration | Separates power rating from energy need. |
| Industrial backup | Reliability and uptime | Links battery use to business continuity. |
| Manufacturing | Qualified operating capacity | Shows usable supply rather than announcements. |
| Minerals | Battery-grade processed supply | Identifies the real bottleneck layer. |
| Recycling | Recovered materials | Shows circular supply readiness. |
| Policy | Local-content and safety rules | Changes where projects can scale. |
Battery Data Quality and Market Risk Checks
Battery data needs a quality check before it becomes a chart, table or benchmark. The goal is not to display every available number; the goal is to show the signal that helps a reader make a better decision. Mixed units, mismatched time periods, unclear geography and repeated statistics can make a report look busy while making the market harder to understand.
- Start with units: market value, GWh deployment, GW additions, percentage share and price indexes should not be mixed in one chart unless the purpose is clearly explained.
- Separate timing carefully: historical deployment, current market value, announced capacity and long-range forecasts should not be presented as if they describe the same stage of the market.
- Keep geography clear because China, Europe, the United States and emerging markets often reflect different policy, supply-chain and demand conditions.
- Check visual balance so each page gives readers explanation, a small group of signals and one useful table or chart instead of a dense block of numbers.
- Use emphasis sparingly: only the most important statistics should be bold, and readout text should stay normal so the page does not feel over-marked.
- Keep the sequence logical so the report moves from market scale to operational risk and then to action.
Table. Battery data quality checklist
This quality check is also what keeps charts from becoming misleading. If a figure mixes market value, GWh deployment and percentage share without context, the visual may look polished while the conclusion becomes weak. Clean data logic is part of the writing quality, not only the design quality.
| Check | Question | Fix |
|---|---|---|
| Unit match | Are all values comparable? | Separate value, volume, share and index data. |
| Time layer | Is the statistic historic or forecast? | Avoid mixing deployment with announced capacity. |
| Geography | Is the region clearly defined? | Keep regional benchmarks separate. |
| Chart logic | Does the graph answer one question? | Use bars, lines, columns or flows only where useful. |
| Table logic | Is the table diagnostic? | Use compact Area-Signal-Meaning wording. |
| Emphasis | Are only key numbers highlighted? | Keep bold text selective and controlled. |
Battery Market Statistics FAQ
The FAQ keeps the benchmark view practical. Each answer focuses on how a decision-maker should read the statistic, not on repeating every number already covered in the report.
What is the most important battery market statistic?
The most important statistic depends on the decision being made, but EV battery deployment is usually the first benchmark because it sets the largest demand signal. Market value shows economic scale, storage additions show grid-side growth, price trends show affordability, and mineral concentration shows supply-chain risk. A strong battery-market view uses all of those measures together instead of relying on one headline number.
Why do EV batteries dominate battery-market statistics?
EV batteries dominate because vehicles need large packs and global EV adoption has scaled quickly. A passenger EV can require far more battery capacity than a phone, laptop or small device, so even moderate vehicle adoption creates large GWh demand. EV statistics still need context because pack size, model mix, vehicle weight and regional driving expectations change how much battery capacity each sale represents.
Why are battery storage statistics becoming more important?
Storage statistics matter because batteries now support grids, solar and wind integration, peak management, backup power and reliability. Grid storage creates a different buyer base from EVs and often depends on power-market rules, interconnection timing, project finance and safety standards. That makes storage one of the most important non-vehicle signals in the battery market.
Why does chemistry mix matter?
Chemistry mix matters because it changes cost, performance, safety and mineral exposure. LFP can reduce nickel and cobalt exposure and support cost-sensitive uses. NMC and NCA can remain important where range and performance matter. Sodium-ion and solid-state chemistries are smaller today, but they signal how future cost and supply-chain pressure may change.
Why are critical minerals a risk even when battery demand is strong?
Strong demand does not guarantee secure supply. Mining, refining and processing capacity are concentrated across different countries and can be affected by permitting, logistics, trade rules, qualification timelines and price volatility. Minerals such as lithium, nickel, cobalt and graphite need to be measured from mine supply through battery-grade processing, not just by reserves.
What makes a battery market chart useful?
A useful battery chart answers one reader question. Share and mix visuals should use clean horizontal bars, line charts should show trends, and process visuals should explain bottlenecks. Clear chart logic makes the statistics easier to compare and keeps the report closer to a decision-ready benchmark format.
How should companies use battery market statistics?
Companies should use battery statistics as a monitoring system. Procurement teams can track price, chemistry and supply risk. Investors can watch storage pipelines, manufacturing utilization and mineral projects. Policy teams can compare localization, recycling and grid readiness. The best approach is a short scorecard updated regularly, not a large static file of disconnected numbers.
The best practical use is to revisit the same scorecard on a regular schedule. A one-time market snapshot can age quickly, but a repeated benchmark view shows whether the market is becoming easier to supply, cheaper to adopt or riskier to finance.
Final Takeaway
Battery market growth is no longer a simple story about more electric cars or cheaper cells. EVs still create the largest scale signal, but storage turns batteries into infrastructure, chemistry determines mineral exposure, prices shape adoption, manufacturing controls supply, recycling supports long-term resilience and policy affects where capacity is built.
The strongest battery-market reading connects those signals rather than treating them separately. A rising market value means little if mineral supply cannot keep pace. A large gigafactory pipeline means less if utilization, qualification and component supply are weak. Lower prices help adoption, but only when safety, reliability and supply security remain strong. Recycling improves circularity, but primary supply is still needed during fast growth.
The most useful benchmark approach is therefore practical and repeated: track demand, storage, price, chemistry, minerals, manufacturing, recycling and quality together. That is how the battery market can be read as a complete energy system instead of a collection of disconnected statistics.
The practical test is whether the signals point in the same direction. When EV deployment rises, storage additions accelerate, prices fall and recycling capacity improves, the market has a broader base. When one of those signals weakens, the risk usually appears first in procurement, project finance, factory utilization or mineral contracts.
For that reason, the battery market should be tracked as a connected operating system. Demand shows scale, prices show affordability, chemistry shows exposure, minerals show constraint, manufacturing shows execution, and recycling shows long-term resilience. The strongest market view comes from watching those signals together.
That connected view also makes the article easier to read. Instead of asking readers to remember dozens of isolated facts, each section turns the most important statistics into a market signal and then explains why that signal matters.


