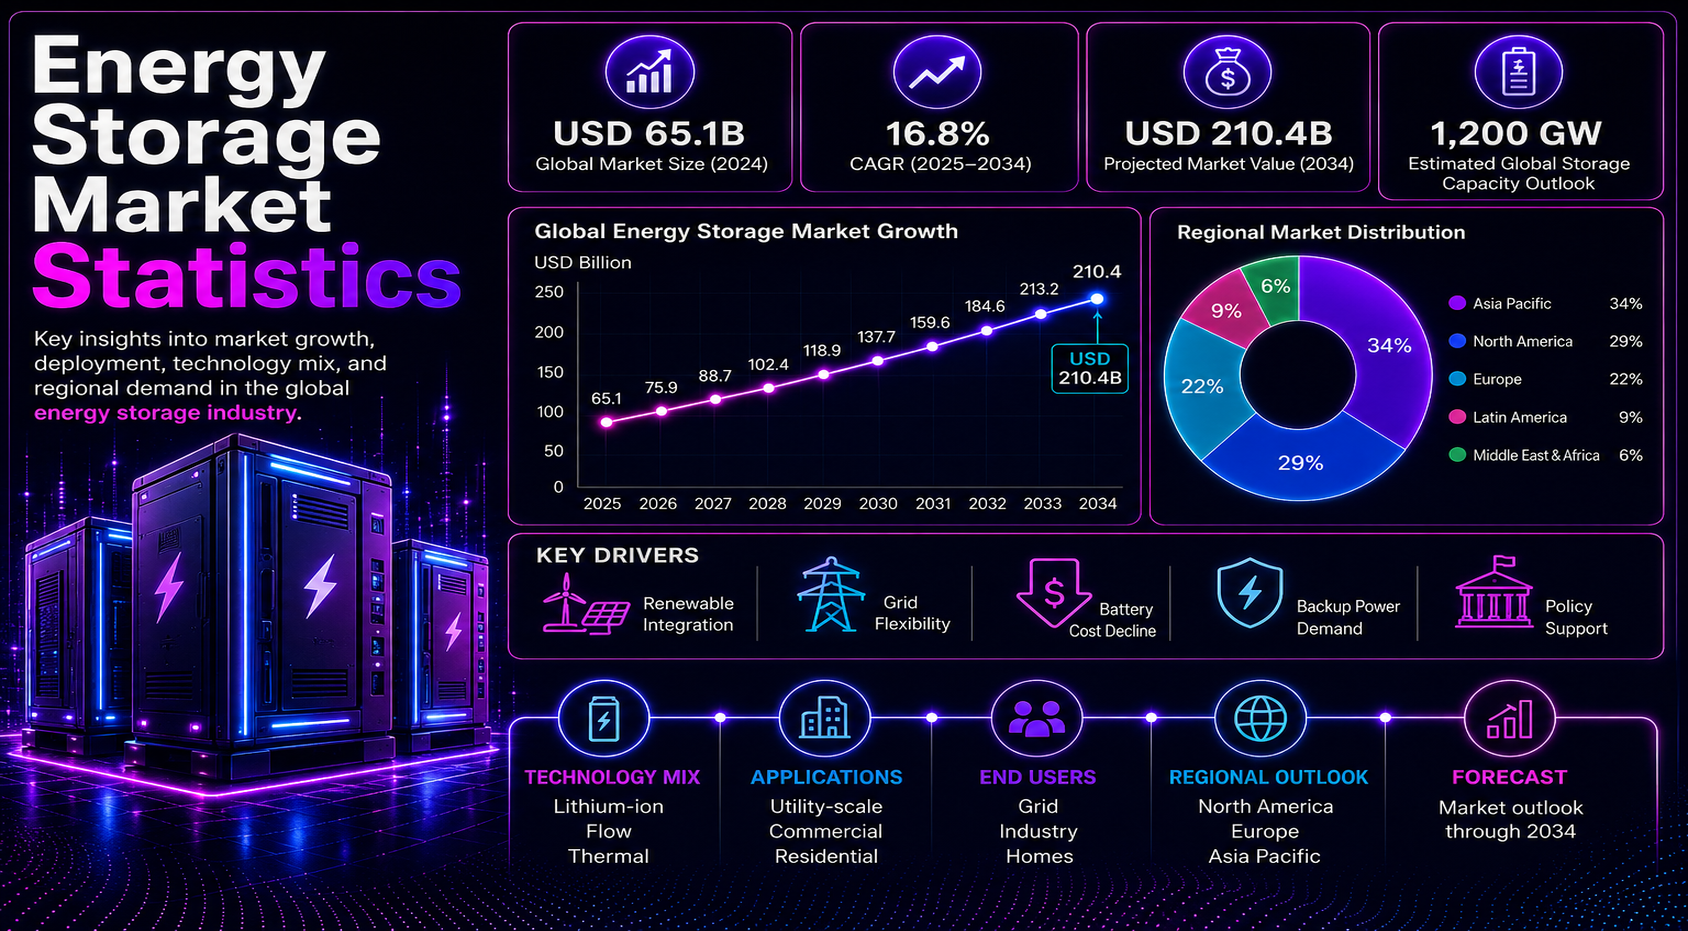
Energy storage has moved from a renewable-power add-on to core grid infrastructure. It helps grids absorb solar and wind, shift energy into peak hours, reduce curtailment, support reliability, and give homes, businesses, and utilities more flexibility. Batteries are the fastest-growing layer, while pumped hydro, thermal storage, flow batteries, compressed-air projects, hydrogen, and behind-the-meter systems each solve different operating needs.
The data shows a market moving from pilots into infrastructure planning. Wood Mackenzie reported 106 GW of global storage additions in 2025, and the IEA projects battery storage rising toward about 1,200 GW by 2030. Those numbers matter because GW shows discharge power, while GWh shows duration. Treating both as the same signal weakens the story.
This article reads storage statistics as operating evidence. It explains what the strongest numbers say about market size, deployment speed, regional demand, country capacity, technology mix, cost pressure, policy support, project economics, and risk. The goal is practical interpretation for utilities, developers, investors, suppliers, regulators, and commercial energy users.
Executive Energy Storage Benchmarks
The executive picture should work like a scorecard, not a spreadsheet. These benchmarks show the scale of new installations, the 2030 capacity path, the difference between GW and GWh, and the split between utility-scale systems, distributed batteries, and legacy bulk storage.
- Global storage additions reached 106 GW in 2025, crossing the 100 GW annual-installation threshold for the first time.
- IEA projects battery storage capacity moving toward about 1,200 GW by 2030, making batteries part of mainstream power-system planning.
- Market models commonly place storage above USD 50 billion in the mid-2020s and above USD 200 billion by 2030 under broader storage definitions.
- Power-sector battery additions doubled to 42 GW in 2023, while grid battery capacity reached about 85 GW before the next wave accelerated.
- Long-run projections point to roughly 1,545 GW by 2034 and around 2 TW / 7.3 TWh by 2035, so duration must be read alongside power capacity.
- Battery storage delivers about 90% of storage-capacity growth in the IEA 2030 outlook, while pumped hydro remains the largest legacy storage base.
| Benchmark area | Signal to carry forward | Why it matters |
|---|---|---|
| Annual additions | 106 GW in 2025 | Crossed the 100 GW milestone |
| 2030 battery path | About 1,200 GW | Frames batteries as grid assets |
| Installed base | 85 GW grid batteries in 2023 | Shows the base before rapid additions |
| Duration lens | 2 TW / 7.3 TWh by 2035 | Keeps power and energy separate |
Why Energy Storage Has Become Grid Infrastructure
Storage matters because modern power systems need flexibility. Solar can peak before demand does, wind varies across hours and seasons, and evening loads often rise as renewable output falls. Storage turns that timing mismatch into a manageable grid resource.
- Solar and wind growth increases the need for flexible capacity because generation is less controllable than fossil fuel dispatch.
- Battery systems can shift electricity from high-generation hours to higher-demand hours, making storage valuable in solar-heavy grids.
- Fast-response batteries support frequency response, reserve capacity, and grid stability in markets with ancillary-service needs.
- Utility-scale storage is increasingly paired with renewable projects to reduce curtailment and improve power-delivery timing.
- Residential storage grows when households want rooftop-solar self-consumption, backup power, and electricity-rate management.
- Long-duration storage becomes more important as grids need reliability across longer renewable gaps, not only short evening peaks.
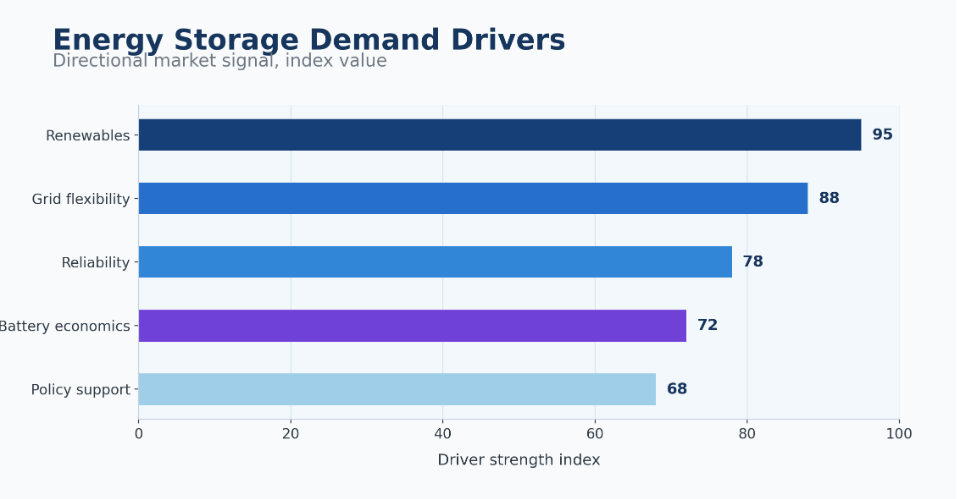
Figure 1. Energy storage demand grows when renewable generation, grid flexibility, reliability needs, and battery economics move together.
| Benchmark area | Current signal | Why it matters |
|---|---|---|
| Annual additions | 106 GW in 2025 | Shows deployment momentum |
| 2030 battery outlook | About 1,200 GW | Frames scale-up need |
| Regional leader | Asia Pacific | Shows supply and demand concentration |
| Technology leader | Lithium-ion batteries | Explains current volume growth |
| Legacy base | Pumped hydro | Shows installed-storage depth |
| Future layer | Long-duration storage | Addresses reliability gaps |
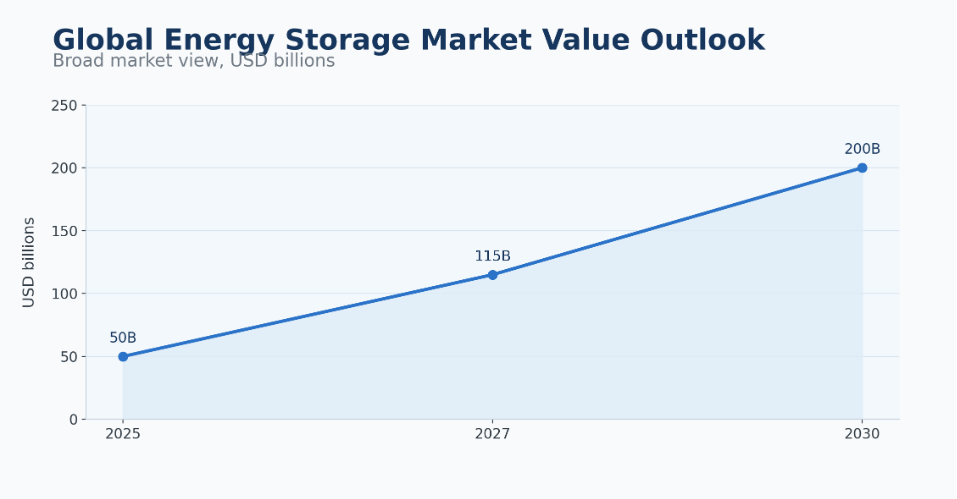
Figure 2. Global storage value rises as batteries move from renewable support to grid-scale infrastructure.
| Adoption factor | Market signal | Why it matters |
|---|---|---|
| Renewable growth | More variable power | Creates flexibility demand |
| Grid reliability | More reserve needs | Supports utility-scale storage |
| Peak demand | Higher evening loads | Encourages load shifting |
| Battery cost | Lower system cost | Improves project economics |
| Policy support | Incentives and rules | Accelerates deployment |
Market Size and Forecast: How Fast Storage Is Becoming Grid Infrastructure
Market size only helps when the scope is clear. Some forecasts cover battery energy storage systems, some include pumped hydro, and others use wider stationary-storage definitions. The article should separate those scopes before comparing totals.
- Broad market forecasts place global energy storage above USD 50 billion in the mid-2020s, depending on whether pumped hydro and non-battery systems are included.
- Under broader market definitions, energy storage can move toward or above USD 200 billion by 2030 as utility-scale batteries, grid projects, and behind-the-meter systems expand.
- Battery energy storage forecasts usually show faster percentage growth than total storage because batteries are adding capacity more quickly from a smaller installed base.
- Grid-scale storage remains the main commercial growth engine in many countries because utilities and developers are building larger projects.
- Behind-the-meter markets are smaller in scale but important in regions with rooftop solar, high retail prices, backup-power needs, or virtual power plant programs.
- Forecasts vary because the market can be measured in dollars, GW, GWh, project count, storage duration, or installed asset value.
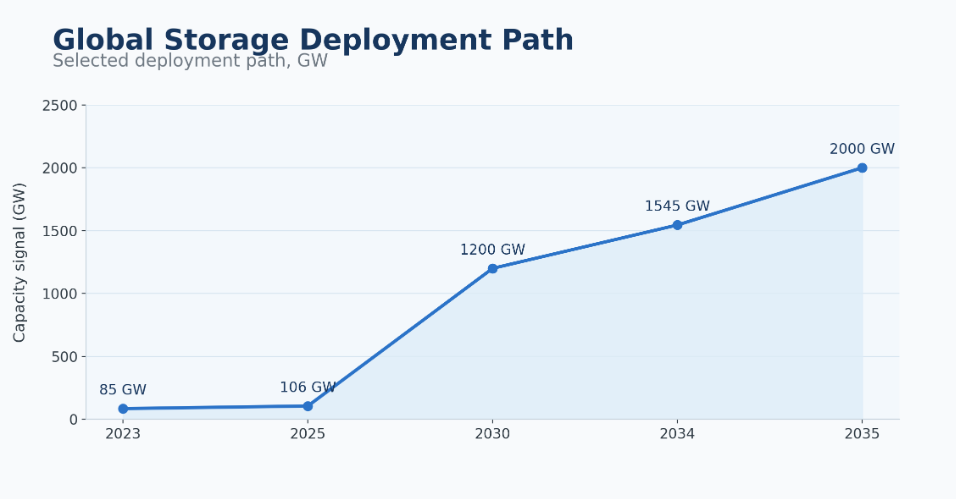
Figure 3. Global deployment is accelerating, but GW and GWh must be read together because duration changes grid value.
| Forecast signal | Value / direction | Market meaning |
|---|---|---|
| Current market value | Above USD 50B | Shows commercial base |
| 2030 forecast | Above USD 200B in broad views | Shows long-term opportunity |
| Battery growth | Faster than total storage | Reflects new project momentum |
| Main driver | Renewables and grid flexibility | Explains demand expansion |
| Main restraint | Interconnection and cost | Explains uneven deployment |
Deployment Momentum: Why GW and GWh Tell Different Stories
Deployment statistics show whether announcements are becoming installed capacity. Storage also has two core units: GW for power and GWh for duration. Both are needed because a larger power rating does not automatically mean longer grid support.
- Wood Mackenzie reported 106 GW of global energy storage additions in 2025, showing a major annual installation milestone.
- The IEA projects battery storage capacity rising toward about 1,200 GW by 2030, which implies a much larger role for batteries in grid planning.
- GW measures discharge capability, while GWh measures how long a storage fleet can provide electricity at that power level.
- A four-hour battery has a different grid role than a one-hour battery even if both are listed with the same MW power rating.
- Utility-scale systems increasingly dominate capacity additions because larger projects can support renewable shifting, reserves, and peak capacity.
- Behind-the-meter deployments remain important because they create distributed flexibility and backup value closer to the customer.
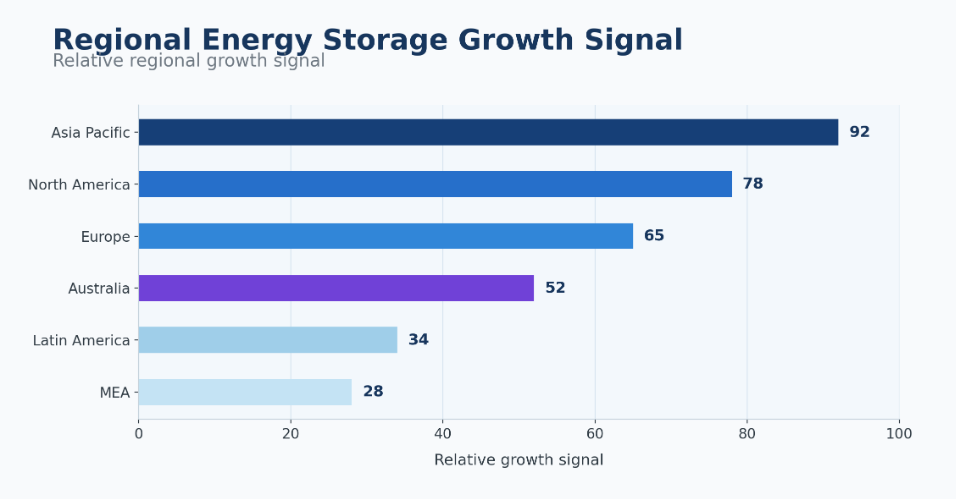
Figure 4. Regional storage growth depends on renewable penetration, grid constraints, policy support, and electricity-market design.
| Deployment signal | What to measure | Why it matters |
|---|---|---|
| Power capacity | GW installed | Shows discharge capability |
| Energy capacity | GWh installed | Shows how long storage can run |
| Annual additions | New GW/GWh per year | Shows market momentum |
| Duration | Hours of storage | Shows grid value |
| Project scale | Utility vs distributed | Shows deployment model |
Regional Storage Growth: Why China, the U.S., Europe, and Australia Move Differently
Regional data is high-value because global averages hide major differences. Growth depends on grid design, renewable mix, policy, wholesale prices, reliability needs, and interconnection rules.
- Asia Pacific carries the strongest deployment signal because China combines project scale, battery manufacturing, renewable integration, and policy direction.
- North America is led by the United States, where utility-scale storage pipelines, tax credits, solar-plus-storage projects, and state clean-energy targets drive deployment.
- Europe is expanding storage because electricity markets need flexibility, rooftop solar is growing, and energy-security concerns have increased the value of local balancing resources.
- Australia is important because it combines utility-scale projects with one of the strongest household battery and rooftop-solar markets.
- Latin America has selective storage opportunities in Chile, Brazil, and Mexico, where solar growth, mining loads, and transmission constraints create storage value.
- Middle East and Africa storage demand is tied to solar projects, reliability, remote systems, and grid-stability needs, with South Africa especially relevant because of backup-power demand.
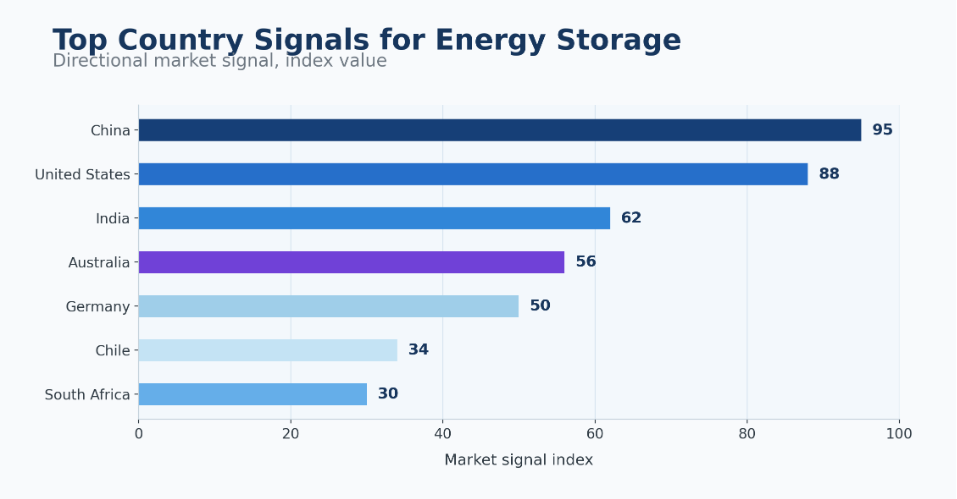
Figure 5. Country-level storage data shows how China and the U.S. lead scale while other markets add different demand signals.
| Region | Adoption signal | Market meaning |
|---|---|---|
| Asia Pacific | China-led deployment | Scale and supply chains are strongest |
| North America | U.S.-led utility growth | Policy and pipelines drive demand |
| Europe | Flexibility and energy security | Storage supports renewable-heavy grids |
| Latin America | Selective acceleration | Mining, solar, and grid stability matter |
| MEA | Solar and reliability needs | Utility and backup use cases grow |
| Sub-Saharan Africa | Mini-grid and backup demand | Reliability is the strongest driver |
Country-Level Storage Signals: China and the U.S. Lead Scale, but Other Markets Matter
Country-level data strengthens the article because storage follows local grid problems. A high-solar market with curtailment needs a different storage plan from a country focused on outages, capacity payments, or retail electricity costs.
- China is the largest deployment and supply-chain market, supported by battery manufacturing, renewable buildout, and large-scale project development.
- The United States is one of the largest utility-scale battery markets, supported by tax credits, state-level targets, solar-plus-storage projects, and grid service revenues.
- India is becoming more important because renewable growth and peak-demand pressure require storage procurement and grid flexibility.
- Australia shows why household batteries and large grid batteries can grow together in the same country-level market.
- Germany and the United Kingdom are important European signals because storage connects rooftop solar, flexibility markets, energy security, and wholesale price volatility.
- Chile and South Africa show emerging-market storage use cases tied to solar curtailment, mining loads, reliability, and grid-stability needs.
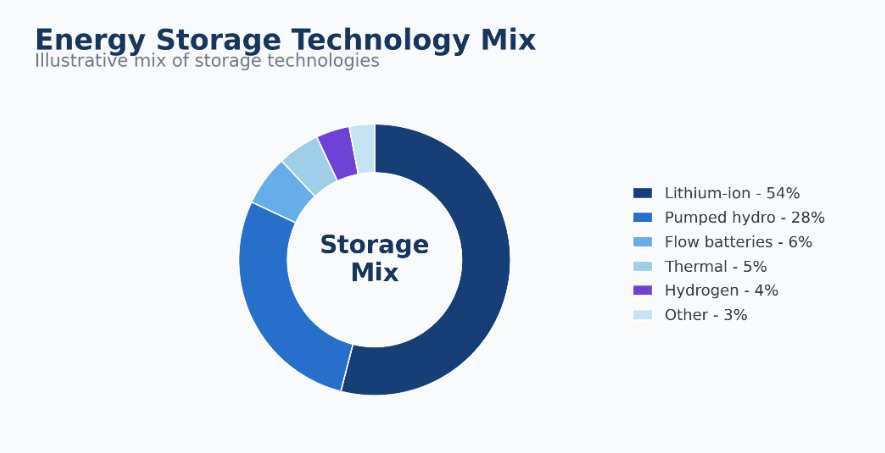
Figure 6. Lithium-ion batteries dominate new additions, while pumped hydro remains the largest installed storage base.
| Country | Market signal | Why it matters |
|---|---|---|
| China | Largest deployment and supply chain | Sets global scale |
| United States | Utility-scale battery growth | Strong project pipeline |
| India | Storage procurement and grid needs | Supports renewable integration |
| Australia | Household and grid storage | Strong mixed-market model |
| Germany | Rooftop solar and batteries | Behind-the-meter strength |
| Chile | Solar and grid constraints | Storage reduces curtailment |
| South Africa | Reliability and load-shedding | Storage supports backup and stability |
Technology Mix: Lithium-Ion Leads, but Pumped Hydro Still Anchors the Base
Technology mix matters because storage is not one product. Lithium-ion dominates new additions because it is modular and fast to deploy. Pumped hydro still matters because it anchors much of the installed base and provides bulk storage over longer durations.
- Lithium-ion batteries are the main technology in new grid battery projects because they offer fast response, modular design, and improving cost performance.
- LFP chemistry has become increasingly important in stationary storage because buyers value cost, safety, and cycle-life advantages.
- Pumped hydro still anchors the global installed storage base even though new battery projects are growing faster.
- Flow batteries are positioned for longer-duration stationary use, especially where cycle life and safety matter more than compact energy density.
- Thermal storage, compressed-air storage, and hydrogen storage serve different long-duration or sector-specific needs.
- Sodium-ion batteries are emerging as a future option where lower-cost materials and supply-chain diversification become important.
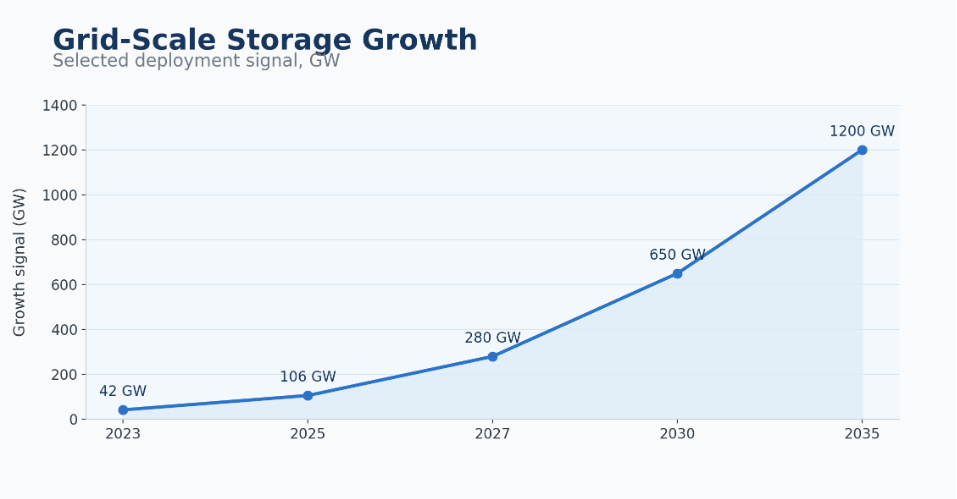
Figure 7. Grid-scale storage grows fastest where renewable additions, peak-demand pressure, and market revenues support larger projects.
| Technology | Main use case | Market role |
|---|---|---|
| Lithium-ion | Short-duration grid and BTM storage | Fastest deployment category |
| LFP | Utility and stationary storage | Cost and safety appeal |
| Pumped hydro | Long-duration bulk storage | Largest legacy base |
| Flow batteries | Longer stationary storage | Emerging grid option |
| Thermal storage | Industrial and building use | Sector-specific opportunity |
| Hydrogen storage | Seasonal and long-duration needs | Future-oriented market |
Grid-Scale Storage: Where Flexibility Becomes a Utility Asset
Grid-scale storage is the largest strategic growth area because utilities and developers use large batteries to solve system-level problems: solar shifting, peak capacity, reserve services, congestion relief, curtailment reduction, and reliability planning.
- Utility-scale storage grows fastest where solar additions create evening ramp needs and curtailment risks.
- Battery projects can earn value from energy arbitrage, capacity markets, ancillary services, renewable integration, and congestion relief.
- Four-hour batteries have become a common grid-planning product because they can help cover evening peak demand after solar output falls.
- Fast-response storage helps grid operators manage frequency and reserve needs more quickly than many conventional resources.
- Solar-plus-storage projects are increasingly used to shift output from midday generation periods into higher-value evening hours.
- Interconnection queues and grid upgrade costs can delay projects even when storage economics look attractive on paper.
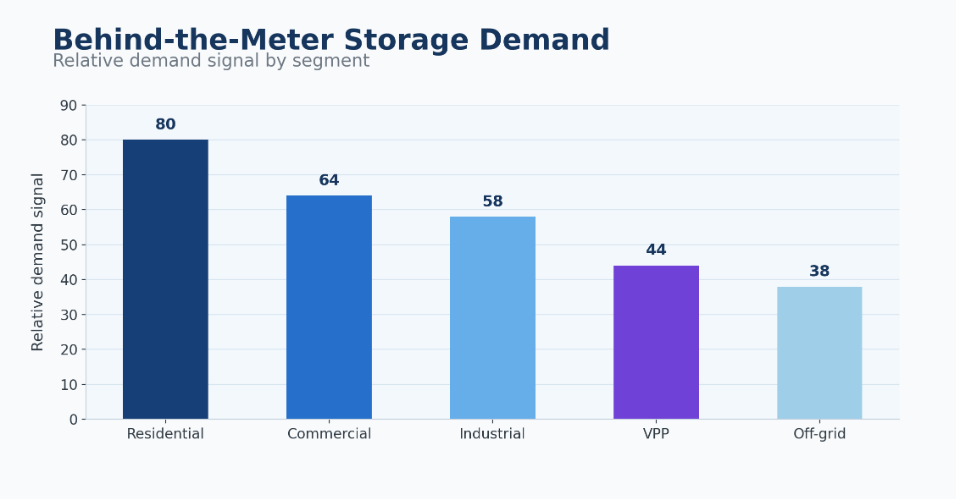
Figure 8. Behind-the-meter storage grows where rooftop solar, backup power, and electricity-rate management overlap.
| Grid use case | Core metric | Why it matters |
|---|---|---|
| Renewable shifting | MWh discharged after solar peak | Reduces curtailment |
| Frequency response | Fast response capability | Supports grid stability |
| Peak capacity | MW available at peak | Reduces peaker need |
| Transmission support | Congestion and deferral value | Helps constrained grids |
| Reserves | Capacity available for reliability | Supports system planning |
Behind-the-Meter Storage: Residential, Commercial, Industrial, and VPP Demand
Behind-the-meter storage may be smaller than utility-scale projects in many markets, but it brings energy flexibility closer to end users. Residential battery systems are increasingly paired with rooftop solar and backup power needs, while commercial and industrial installations are often designed to reduce demand charges, strengthen resilience, and improve power quality. Similar to how a word invoice template can simplify routine business administration, these storage solutions help customers manage their energy use more efficiently and reliably.
- Residential storage grows where households combine rooftop solar with backup power, self-consumption, and time-of-use rate management.
- Commercial storage can reduce peak demand charges and help businesses manage electricity bills during high-cost periods.
- Industrial storage supports power quality, resilience, and uptime for facilities where interruptions can create large losses.
- Virtual power plants aggregate distributed batteries so homes and businesses can provide grid services as a coordinated resource.
- Off-grid and weak-grid users may value storage more highly because reliability and fuel replacement can be more important than simple payback.
- Behind-the-meter adoption depends heavily on local electricity prices, rate design, incentives, outage risk, and rooftop solar penetration.
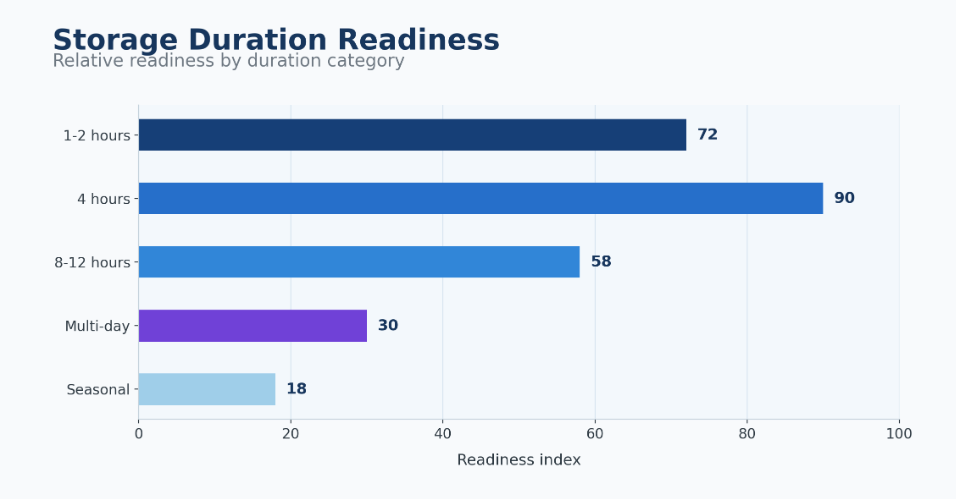
Figure 9. Long-duration storage matters because short-duration batteries cannot solve every reliability and renewable-balancing need.
| Customer segment | Main need | Market meaning |
|---|---|---|
| Residential | Solar self-consumption and backup | Household resilience demand |
| Commercial | Peak demand and bill control | Energy cost management |
| Industrial | Power quality and resilience | Reliability and uptime value |
| Virtual power plants | Aggregated flexibility | Distributed grid resource |
| Off-grid users | Reliable electricity access | High-value backup market |
Long-Duration Storage: The Next Reliability Layer
Long-duration storage matters because short-duration batteries cannot solve every grid challenge. Four-hour systems help with evening peaks, but higher-renewable grids also need resources for longer weather-driven gaps and multi-day reliability.
- One-hour and two-hour storage systems are useful for fast response, short shifting, and ancillary services.
- Four-hour systems are common in grid planning because they can help shift solar generation into evening peak hours.
- Eight-hour to twelve-hour storage becomes more relevant where renewable gaps last longer than a single evening ramp.
- Multi-day storage is still early-stage, but it matters for systems that need reliability during extended weather events.
- Flow batteries, compressed-air systems, thermal storage, iron-air systems, and hydrogen storage are all being evaluated for longer-duration roles.
- Long-duration storage should be presented as a future reliability layer rather than the current volume leader.
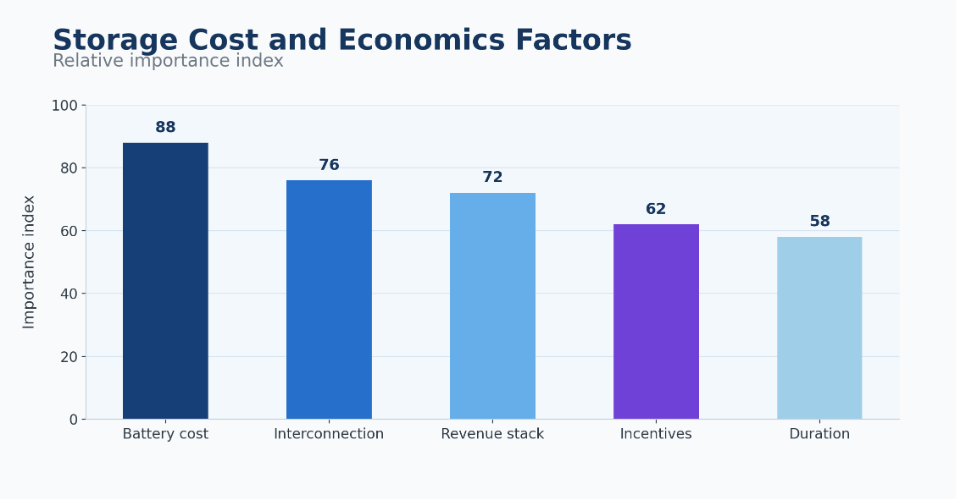
Figure 10. Storage economics depend on battery cost, interconnection, duration, market revenues, and policy incentives moving together.
| Storage duration | Main role | Market meaning |
|---|---|---|
| 1-2 hours | Fast response and short shifting | Ancillary services and short peaks |
| 4 hours | Common grid battery duration | Peak shifting and capacity |
| 8-12 hours | Longer renewable balancing | Emerging reliability need |
| Multi-day | Weather-driven reliability | Advanced storage opportunity |
| Seasonal | Deep decarbonization support | Long-term challenge |
Project Economics: Battery Prices, Interconnection, and Revenue Stack
Storage economics should not be reduced to battery price. Project viability also depends on interconnection timing, duration, market rules, financing cost, incentives, degradation, and the balance between contracted and merchant revenue.
- Battery price declines improve project economics, but they do not remove interconnection, permitting, and revenue-stack risk.
- Interconnection costs and grid upgrade timelines can decide whether a project reaches commercial operation on schedule.
- Revenue stacking is critical because a single battery can earn from arbitrage, capacity, ancillary services, and reliability programs in some markets.
- Longer-duration projects can create more grid value, but they also require more energy capacity and stronger revenue certainty.
- Tax credits, grants, and capacity payments can move projects from attractive on paper to financeable in practice.
- Battery degradation, warranty structure, and operating strategy affect long-term financial performance.
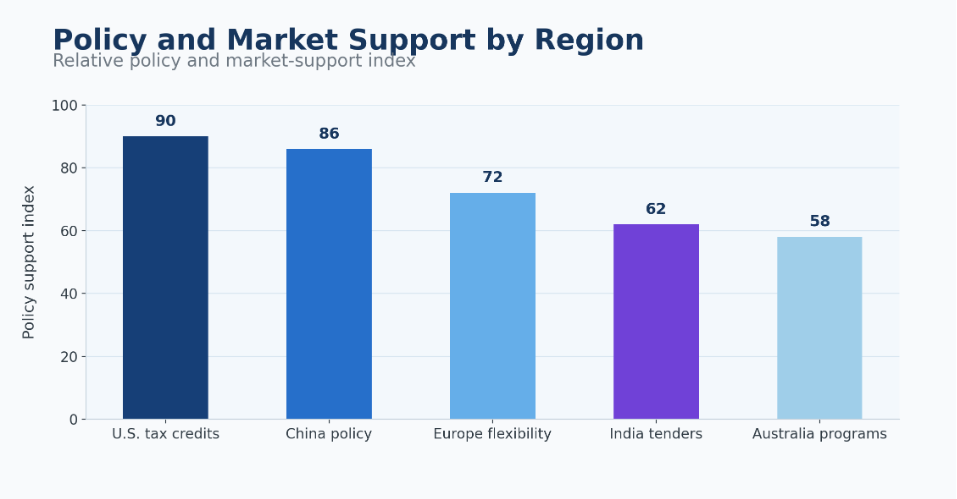
Figure 11. Storage policy works best when incentives, market rules, interconnection, and renewable targets are aligned.
| Cost area | What to measure | Market meaning |
|---|---|---|
| Battery system cost | $/kWh or $/MWh | Drives project capex |
| Interconnection | Time and upgrade cost | Can delay deployment |
| Market revenue | Arbitrage, capacity, services | Determines bankability |
| Incentives | Tax credits and grants | Improves project economics |
| Duration | Hours of storage | Changes revenue potential |
Policy, Incentives, and Grid Rules: What Turns Storage Demand into Projects
Policy shapes deployment by changing both economics and market access. Incentives reduce capex, mandates create procurement demand, and market rules decide whether storage is paid for the services it provides.
- The U.S. storage investment tax credit supports stand-alone storage economics and has strengthened utility-scale project pipelines.
- China uses policy direction and renewable integration needs to accelerate battery storage deployment and supply-chain scale.
- European storage growth is tied to flexibility markets, energy security, wholesale price volatility, and renewable integration.
- India storage tenders and grid planning are important because renewable growth and peak demand require more flexible capacity.
- Australia combines capacity mechanisms, grid-support programs, rooftop solar, and household storage demand.
- Interconnection reform can be as important as incentives because delayed grid connections can slow deployment even when projects are financially attractive.
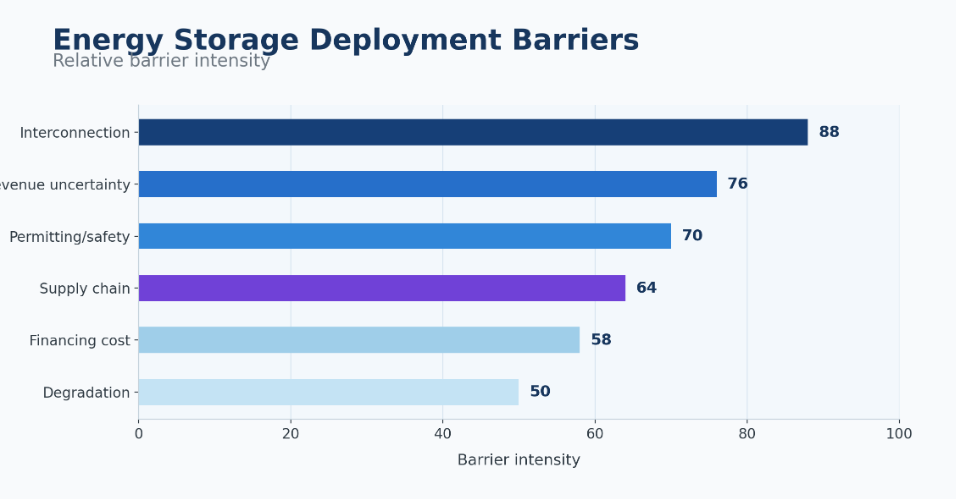
Figure 12. Storage deployment slows when interconnection, safety, financing, revenue certainty, and supply chains do not move at the same pace as demand.
| Policy area | Market impact | Who it affects |
|---|---|---|
| Tax credits | Improves project economics | Developers and asset owners |
| Storage mandates | Creates procurement demand | Utilities and regulators |
| Market access | Enables revenue stacking | Storage operators |
| Interconnection rules | Speeds or delays projects | Developers and grid operators |
| Renewable targets | Raises flexibility need | Utilities and planners |
Deployment Barriers: What Still Slows Storage Projects
Demand is strong, but project execution remains difficult. The main barriers are interconnection delays, permitting, safety concerns, revenue uncertainty, supply-chain concentration, degradation assumptions, and financing cost.
- Interconnection queues can delay projects because grid studies, upgrade costs, and connection approvals often move slower than market demand.
- Permitting and siting can be difficult when communities, fire departments, or local authorities need stronger safety documentation.
- Fire safety remains a trust issue, especially for large battery systems near communities, buildings, or constrained grid sites.
- Revenue uncertainty can make merchant projects harder to finance if market rules do not clearly pay storage for flexibility and reliability services.
- Battery degradation affects long-term performance because dispatch strategy and warranty terms determine usable value over time.
- Supply-chain concentration creates risk when battery cells, inverters, critical minerals, or power electronics face bottlenecks.
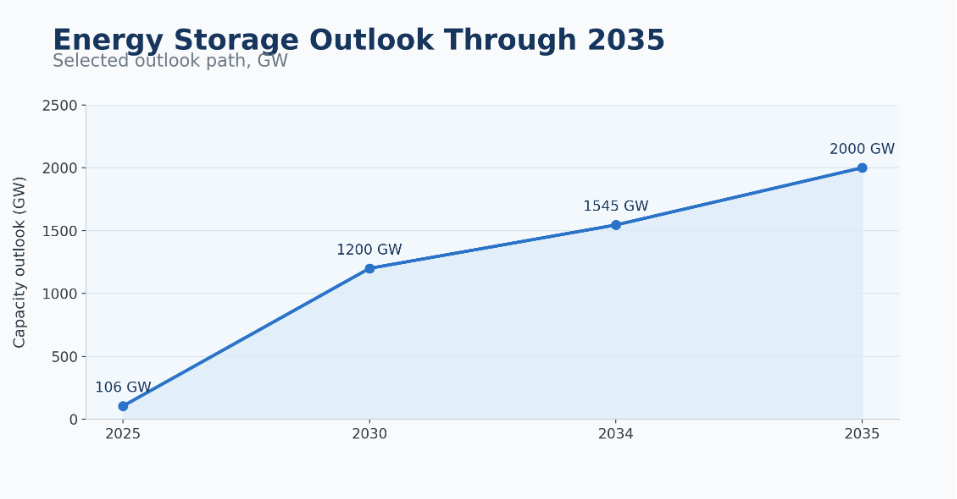
Figure 13. Storage growth through 2030 depends on renewable buildout, battery costs, policy support, and grid flexibility markets improving together.
| Barrier | Core signal to measure | Market response |
|---|---|---|
| Interconnection | Queue time and upgrade cost | Grid reform and better planning |
| Fire safety | Incidents and compliance needs | Stronger standards and siting rules |
| Revenue uncertainty | Contracted vs merchant revenue | Better market design |
| Supply chain | Battery and component availability | Diversification and localization |
| Degradation | Cycle life and warranty terms | Better operations and warranties |
Competitive Landscape and Supply Chain: What Storage Providers Compete On
Storage competition is broader than battery cells. Strong providers combine supply access, safe design, integration experience, inverters, controls, warranties, software, dispatch optimization, and financing support.
- Battery cell manufacturers compete on cost, chemistry, safety, availability, cycle life, and supply certainty.
- System integrators compete on bankability, safety documentation, controls, commissioning experience, and warranty structure.
- Software providers help storage assets optimize dispatch across arbitrage, capacity, ancillary services, and grid programs.
- EPC firms and developers matter because project execution, interconnection work, and site integration decide whether storage reaches operation.
- Recycling and second-life providers are becoming more important as battery deployments create long-term end-of-life responsibilities.
- Bankability becomes a competitive advantage because financiers want proven equipment, strong warranties, and reliable operating data.
| Competitive factor | Why it matters | Best-fit strategy |
|---|---|---|
| Battery supply | Determines project delivery | Secure long-term supply |
| System integration | Affects reliability and bankability | Pair hardware with controls |
| Software | Optimizes dispatch and revenue | Improve asset performance |
| Safety record | Builds trust | Strengthen compliance |
| Warranty and service | Protects long-term value | Support project financing |
Forecast Outlook Through 2030 and 2035
The forecast should stay practical. Short-duration batteries will likely lead new deployments, while long-duration systems, pumped hydro modernization, and advanced technologies gain importance as renewable shares rise.
- Battery storage capacity is expected to scale sharply toward 2030 as grids add renewables and need more flexibility.
- China is likely to remain a global leader because it combines manufacturing depth, project scale, and domestic deployment policy.
- The United States should remain a major utility-scale market because of project pipelines, tax credits, and state-level clean-energy rules.
- Europe should continue growing through flexibility markets, energy-security needs, rooftop solar, and renewable integration.
- India is likely to become more important because peak demand and renewable expansion require storage procurement.
- Long-duration storage will likely grow more slowly than lithium-ion batteries but gain importance for reliability beyond four hours.
| Forecast area | Expected direction | Reason |
|---|---|---|
| Global battery storage | Strong growth | Renewables and grid flexibility |
| China | Continued leadership | Scale and manufacturing depth |
| United States | Utility-scale expansion | Tax credits and project pipelines |
| Europe | Flexibility-led growth | Energy security and renewables |
| Long-duration storage | Gradual growth | Reliability needs beyond 4 hours |
90-Day Energy Storage Market Planning Framework
Statistics become useful when they turn into a measurement plan. A storage review should group data by business question: where capacity is being built, which technologies lead, what grid problem is solved, and what can delay deployment.
| Timing | What to review | Output |
|---|---|---|
| Days 1-30 | Map global, regional, country, technology, and deployment statistics | Storage demand baseline |
| Days 31-60 | Review grid-scale, BTM, policy, cost, interconnection, and technology signals | Market positioning framework |
| Days 61-90 | Build article sections, charts, diagnostic tables, FAQ, and KPI dashboard | Production-ready statistics article |
Energy Storage Market KPI Dashboard
A useful storage dashboard connects market value with deployment readiness. The right scorecard should track not only revenue but also capacity, duration, regional growth, technology mix, economics, policy, and bottlenecks.
| KPI | Why it matters |
|---|---|
| Global market value | Shows commercial opportunity |
| Annual storage additions | Measures deployment momentum |
| Cumulative battery capacity | Shows installed base |
| GW vs GWh ratio | Reveals duration and system value |
| Regional share | Shows where deployment is concentrated |
| Country-level capacity | Identifies leading and emerging markets |
| Utility-scale share | Tracks grid-scale growth |
| Residential storage additions | Shows behind-the-meter adoption |
| Long-duration pipeline | Indicates future reliability market |
| Battery cost | Affects project economics |
| Interconnection timeline | Shows deployment friction |
| Revenue stack | Shows project bankability |
Storage Value Stack: Where Projects Earn Their Revenue
The value stack explains why one battery can be worth more in one market than another. Storage can shift energy, sell capacity, provide frequency response, reduce curtailment, defer network upgrades, support resource adequacy, or protect customers from outages and demand charges. The same 100 MW project can have different economics depending on rules, contracts, location, duration, and dispatch strategy.
- Energy arbitrage becomes valuable when price spreads between low-generation and high-demand hours are large enough to cover degradation and operating costs.
- Capacity value matters when storage can reliably discharge during system peaks and qualify for resource-adequacy or capacity-market payments.
- Ancillary services reward fast response and can be especially important for shorter-duration batteries in power markets with frequency and reserve needs.
- Curtailment reduction is valuable when solar or wind output is regularly limited because transmission or demand cannot absorb all available generation.
- Transmission and distribution deferral can make storage useful in constrained local grids where a targeted battery reduces the need for immediate network upgrades.
- Customer resilience creates value behind the meter when outages, demand charges, or power-quality issues are expensive enough to justify storage investment.
| Value stream | Core metric | Market meaning |
|---|---|---|
| Energy arbitrage | Price spread and cycles | Shows merchant value |
| Capacity value | Peak availability | Supports reliability planning |
| Ancillary services | Fast-response revenue | Rewards flexibility |
| Curtailment reduction | MWh recovered | Improves renewable economics |
| Network deferral | Avoided grid cost | Supports local planning |
| Resilience | Outage cost avoided | Strengthens BTM demand |
Interconnection, Permitting, and Safety: The Practical Deployment Test
Demand can be strong while projects still move slowly. The practical test is whether a project can secure a grid connection, pass permitting, satisfy fire-safety rules, and reach operation without cost escalation. These items determine whether pipelines become assets.
- Interconnection queues can delay storage because grid studies, network upgrades, and connection approvals often take longer than equipment procurement.
- Permitting requirements are becoming more important as communities and local authorities look for clearer battery-safety documentation.
- Fire codes, emergency-response plans, spacing rules, and enclosure design influence whether large battery projects can be sited near substations, communities, or commercial loads.
- Grid upgrade costs can change project economics after a developer has already identified a technically attractive site.
- Supply timelines for transformers, switchgear, inverters, battery containers, and power electronics can become a hidden deployment bottleneck.
- Operations planning matters because battery systems must be monitored, maintained, and dispatched safely over thousands of cycles.
| Deployment item | What to check | Why it matters |
|---|---|---|
| Interconnection | Queue time and upgrades | Controls project timing |
| Permitting | Local approval path | Affects site risk |
| Safety standards | Code and response plan | Builds trust |
| Equipment supply | Lead times | Controls schedule |
| Grid upgrades | Network cost | Affects returns |
| Operations plan | Monitoring and maintenance | Protects asset life |
Supply Chain, Recycling, and Battery Availability
Storage growth depends on cells, inverters, containers, thermal management, power electronics, transformers, software, and integration. Cell supply gets attention, but balance-of-system constraints can also delay projects. Recycling, second-life use, and domestic manufacturing policies will matter more as scale rises.
- Lithium-ion battery availability is tied to EV demand, stationary storage demand, raw material markets, and regional manufacturing capacity.
- LFP chemistry has become attractive in stationary storage because it offers cost and safety advantages for many grid applications.
- Inverters and power-conversion systems matter because they determine how batteries interact with the grid and provide services.
- Thermal management and fire-safety systems are essential for reliability, warranty protection, and community acceptance.
- Recycling and end-of-life planning become more important as cumulative battery installations rise and older systems approach replacement.
- Supply-chain localization can reduce project risk when tariffs, shipping constraints, domestic-content rules, or geopolitical issues affect equipment availability.
| Supply-chain area | Market signal | Why it matters |
|---|---|---|
| Battery cells | Availability and chemistry | Controls project cost |
| Inverters | Power conversion capacity | Connects storage to grid |
| Thermal systems | Safety and reliability | Protects performance |
| Transformers | Grid connection equipment | Can delay projects |
| Recycling | End-of-life pathway | Supports sustainability |
| Domestic supply | Localization policy | Reduces delivery risk |
Commercial, Industrial, and Data Center Storage Signals
Commercial and industrial storage deserves separate treatment because these buyers think differently from utilities. Utilities focus on grid services and capacity, while C&I buyers care about bills, reliability, backup power, power quality, demand charges, and sustainability reporting. Data centers add urgency because uptime is critical and electricity demand is rising.
- Commercial storage can reduce demand charges when customers pay based on their highest usage during a billing period.
- Industrial storage can protect production processes where even short outages or voltage problems create expensive downtime.
- Data center operators may evaluate storage for backup support, renewable matching, grid services, and reliability planning.
- Cold storage, manufacturing, hospitals, campuses, ports, and logistics hubs can use storage where outage cost or demand charges are high.
- Commercial solar-plus-storage projects can improve self-consumption and shift electricity use away from high-cost periods.
- Virtual power plant participation can turn distributed commercial batteries into grid resources when market rules allow aggregation.
| Customer type | Storage value | Market implication |
|---|---|---|
| Commercial buildings | Demand-charge control | Bill savings |
| Industrial sites | Power quality and uptime | Reliability value |
| Data centers | Backup and grid support | High-growth load segment |
| Ports and logistics | Peak load and electrification | Infrastructure opportunity |
| Campuses | Resilience and solar shifting | Multi-use storage |
| Hospitals | Backup and reliability | Critical-load value |
Pumped Hydro, Legacy Storage, and Why Installed Base Still Matters
Battery storage gets most attention, but the installed base is still shaped by pumped hydro. Batteries explain the fastest new deployment curve, while pumped hydro explains the long-running bulk-storage role already present in many power systems. A balanced article should not treat new batteries as the whole market.
- Pumped hydro remains the largest legacy storage technology by installed capacity in many global energy-system datasets.
- Battery storage leads new deployment because it is modular, faster to site, and easier to pair with solar, wind, and grid-service applications.
- Legacy pumped hydro assets often support bulk shifting, system reliability, and long-duration storage roles that short-duration batteries may not fully replace.
- New pumped hydro projects can be slow because they require geography, permitting, water resources, civil works, and long development timelines.
- Battery projects can deploy faster, but they face different risks such as degradation, fire safety, supply chain, and revenue uncertainty.
- A strong storage-market article should separate installed-base leadership from new-addition leadership because they answer different market questions.
| Storage base | What it shows | Why it matters |
|---|---|---|
| Pumped hydro | Legacy installed capacity | Bulk storage and long-duration role |
| Lithium-ion batteries | New deployment speed | Fast-growing grid and BTM category |
| Flow batteries | Emerging longer duration | Niche but important reliability layer |
| Thermal storage | Sector-specific flexibility | Useful in buildings and industry |
| Hydrogen storage | Seasonal potential | Long-term decarbonization option |
Renewable Curtailment, Peak Shifting, and Reliability Signals
Storage is easier to justify when the grid has a timing problem. Solar may exceed demand at midday, while evening load remains high after output falls. Storage moves useful electricity across time instead of wasting it or relying more heavily on fossil peaking capacity.
- Curtailment reduction becomes valuable when renewable plants are forced to reduce output because the grid cannot absorb or move all available generation.
- Peak shifting becomes valuable when a battery charges during low-cost or high-renewable periods and discharges during evening or system peak demand.
- Resource adequacy value increases when storage can reliably discharge during hours when the grid needs capacity most.
- Frequency response value appears because batteries can react quickly to grid imbalances and support system stability.
- Transmission relief can appear when storage is placed near constrained grid nodes and reduces the need to move power across congested lines.
- Reliability value becomes more important when customers, utilities, or regulators see outages, extreme weather, or fuel price volatility as system risks.
| Grid signal | Storage response | Market meaning |
|---|---|---|
| Solar curtailment | Charge during excess output | Improves renewable value |
| Evening peak | Discharge after solar falls | Supports capacity needs |
| Frequency risk | Fast response | Stabilizes grid operations |
| Transmission congestion | Local discharge | Reduces grid stress |
| Outage exposure | Backup power | Strengthens resilience |
Bankability, Contract Structures, and Investor Signals
Investors ask whether a project can earn predictable revenue, connect to the grid, operate safely, and perform as modeled. Clear contracts and proven equipment can finance more easily than merchant projects with higher theoretical upside but less revenue certainty.
- Long-term contracts and tolling agreements can improve bankability because they reduce exposure to volatile merchant revenue.
- Merchant storage projects may earn from arbitrage and ancillary services, but they require stronger assumptions about price spreads, cycling, degradation, and market saturation.
- Capacity-market participation can improve financing when storage qualifies as reliable peak capacity under market rules.
- Warranty terms matter because lenders and owners need confidence that battery performance, degradation, and availability will match the revenue model.
- Safety documentation and fire-code compliance can affect insurance, permitting, and financing timelines.
- Experienced integrators and proven technology can reduce perceived project risk, especially for large utility-scale systems.
| Investor signal | What to measure | Why it matters |
|---|---|---|
| Contracted revenue | Share of fixed income | Improves financing |
| Merchant exposure | Revenue volatility | Raises risk |
| Warranty terms | Availability and degradation | Protects performance |
| Technology track record | Operating history | Supports bankability |
| Insurance and safety | Compliance readiness | Affects cost and timing |
Energy Storage Market Statistics FAQ
How big is the energy storage market?
The market is already a large infrastructure category. Broad definitions place it above USD 50 billion in the mid-2020s, and some forecasts move toward or above USD 200 billion by 2030. The exact figure depends on whether the estimate includes battery systems only, pumped hydro, or wider storage technologies.
What is the expected CAGR of the energy storage market?
Battery-focused forecasts show strong double-digit growth because deployment is rising quickly from a smaller base. Broader forecasts are steadier because they include mature technologies such as pumped hydro. The key reading is that batteries lead growth while total storage remains wider infrastructure.
How much energy storage capacity is expected by 2030?
The IEA projects battery storage capacity rising toward about 1,200 GW by 2030. That shows how much flexibility renewable-heavy grids may need. It should still be paired with duration data because GW alone does not show hours of discharge.
Which country leads energy storage deployment?
China and the United States are the main scale markets. China leads through manufacturing depth, policy support, and fast deployment, while the U.S. has a large utility-scale pipeline supported by tax credits, state programs, solar-plus-storage, and grid-service revenues.
Which technology dominates energy storage?
Lithium-ion leads new battery additions because it is modular, fast to deploy, and backed by a large supply chain. Pumped hydro still represents much of installed long-duration capacity, so lithium-ion leads growth while pumped hydro anchors the base.
What is the difference between GW and GWh in energy storage?
GW measures power capacity: how much electricity a system can discharge at one moment. GWh measures energy capacity: how long it can continue delivering. A 1 GW one-hour battery and a 1 GW four-hour battery have very different grid value.
Why does long-duration storage matter?
Long-duration storage matters because short-duration batteries cannot solve every reliability problem. Four-hour batteries help with evening peaks, while higher-renewable grids may need eight-hour, twelve-hour, multi-day, or seasonal storage.
What are the biggest barriers to energy storage deployment?
The biggest barriers are interconnection delays, permitting, fire safety, revenue uncertainty, supply-chain concentration, degradation assumptions, and financing cost. Developers need queue and upgrade-cost data, investors need revenue clarity, and regulators need better planning rules.
How do battery costs affect storage growth?
Lower battery costs improve project economics because batteries are a major capex item. Still, interconnection, duration, revenue, tax credits, degradation, operations, and financing decide whether a project is bankable. Lower costs help, but reliable revenue gets projects built.
What is the outlook for energy storage through 2030 and 2035?
The outlook is positive and more complex. Short-duration lithium-ion systems should lead new deployments, while pumped hydro, long-duration storage, and advanced technologies become more relevant as renewable shares rise.
Final Takeaway
Energy storage statistics point to one clear conclusion: storage is becoming a core layer of modern power systems. Growth is driven by flexibility, renewable integration, peak shifting, reserves, reliability support, and behind-the-meter resilience. Batteries are the fastest-growing part, but pumped hydro, long-duration systems, thermal storage, flow batteries, and emerging technologies all play different roles.
The strongest signals are scale and readiness. Wood Mackenzie’s 106 GW annual-addition signal in 2025 shows near-term momentum, while the IEA’s outlook toward about 1,200 GW of battery storage by 2030 shows the size of the grid-planning opportunity. China shows deployment and supply-chain scale, the U.S. shows utility project depth, Europe shows flexibility demand, and Australia shows household-plus-grid strength.
For utilities, developers, investors, and policymakers, the question is not only how much storage will be built. It is where storage solves a measurable grid problem and whether the project has the interconnection, safety, revenue, duration, supply-chain, and policy path needed to operate successfully. The strongest market view connects renewable buildout, flexibility, project economics, and deployment readiness.


