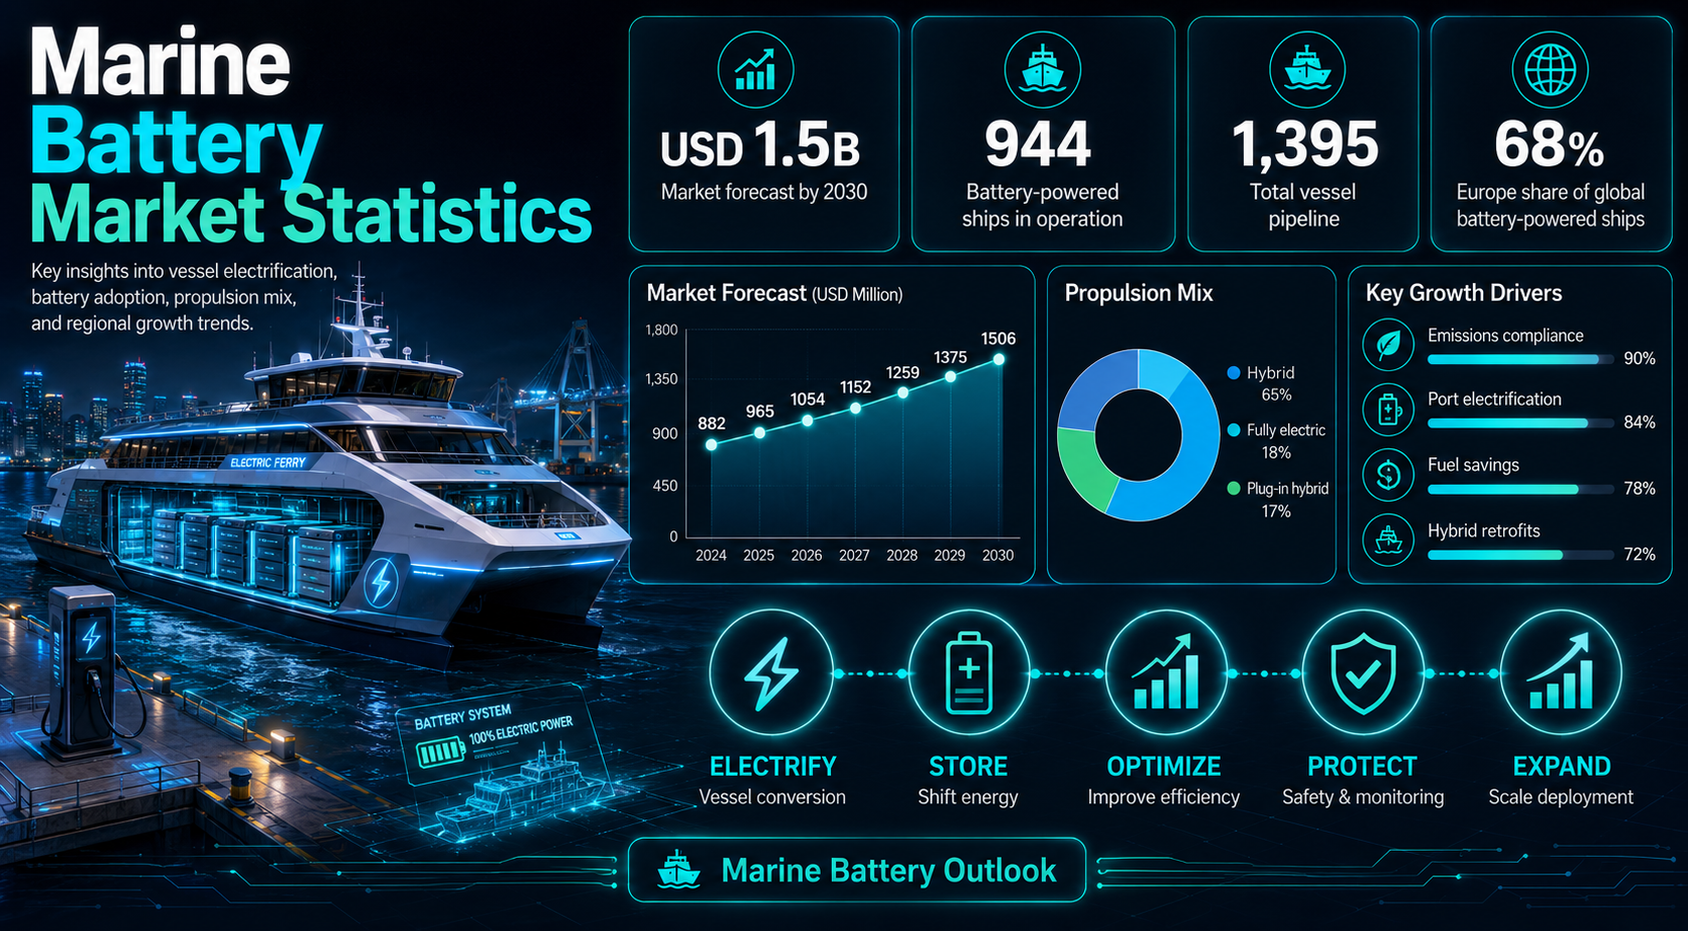
Marine batteries are moving from early ferry pilots into a wider maritime electrification market. They now support electric ferries, hybrid offshore vessels, tugboats, passenger ships, port craft, auxiliary systems, and shore-connected operations. The market now connects vessel design, route planning, port infrastructure, emissions targets, safety standards, and operating economics.
The market needs several lenses because one forecast number cannot explain adoption. Chemistry, capacity range, charging time, duty cycle, route length, grid connection, and port readiness all affect whether a project scales beyond demonstration.
This article organizes more than 300 marine battery statistics into a practical market view covering forecasts, fleet adoption, vessel examples, regional signals, charging, fuel savings, safety, and metrics that shipowners, ports, utilities, investors, and policy teams should track.
Executive Marine Battery Benchmarks
These headline statistics connect revenue forecasts, vessel adoption, regional leadership, ship-type concentration, charging infrastructure, and battery chemistry. Strong analysis separates forecast growth from real deployment because revenue matters only when vessels, ports, and charging systems operate reliably.
The numbers that define the marine battery market
• MarketsandMarkets places the marine battery market at USD 882.3 million in 2024 and projects it to reach USD 1,506.0 million by 2030 at a 9.3% CAGR.
• Fortune Business Insights estimates the global marine battery market at USD 1.67 billion in 2025, rising to USD 2.10 billion in 2026 and USD 6.11 billion by 2034.
• Research Nester estimates the market at over USD 2.4 billion in 2025, USD 2.7 billion in 2026, and USD 7.2 billion by 2035.
• Maximize Market Research valued the market at USD 651.83 million in 2023 and projected it near USD 2,113.62 million by 2030.
• Custom Market Insights estimated the marine lithium-ion battery market at USD 276 million in 2023 and projected around USD 821 million by 2032.
• DNV Alternative Fuels Insight data cited by the Faraday Institution counted 944 battery-powered ships in operation in January 2025.
• A further 451 battery-powered ships were under construction, taking the operating plus under-construction pipeline to roughly 1,395 vessels.
• Europe accounts for 68% of global battery-powered ships, while Norway alone accounts for 33% of the global battery-powered ship fleet.
• Fully electric vessels represent 18% of battery-powered ships, hybrid vessels represent 65%, and plug-in hybrids represent 17%.
• Car and passenger ferries are the most common battery-installed vessel type, with 353 ships in operation and roughly 35% of ships with batteries.
• Mordor Intelligence reports commercial vessels at 71.68% of marine battery market size in 2025, while Grand View Research places commercial ships at about 80.7% share.
• Future Market Insights reports lithium-ion battery systems account for 78.0% of marine power battery systems in 2026.
• Mordor Intelligence reports dual-purpose systems at 44.98% share in 2025 and the 1–5 MWh capacity range at 54.10% share.
• Incat Hull 096, also known as China Zorrilla, is reported with more than 40 MWh of battery capacity, 2,100 passenger capacity, 225 vehicle capacity, and eight electric waterjets.
|
Editorial readout Marine battery statistics are strongest when fleet adoption, vessel type, route profile, charging infrastructure, chemistry, and safety readiness are read together. |
Why Marine Batteries Are Becoming a Shipping Market Priority
Marine batteries are gaining attention because shipping must reduce emissions without compromising safety, reliability, or route performance. Shipping carries more than 80% of world trade volume, produces nearly 3% of global greenhouse gas emissions, and has seen emissions rise 20% over the past decade.
Batteries are not the answer for every vessel, especially long-distance deep-sea shipping. But ferries, harbor craft, tugboats, offshore support vessels, fishing vessels, cruise auxiliary systems, and port operations can use batteries to reduce fuel burn, cut local emissions, smooth engine load, and support quieter operation.
Market drivers worth separating
• Shipping handles more than 80% of world trade by volume, which makes maritime decarbonization a global infrastructure issue.
• Shipping accounts for nearly 3% of global greenhouse gas emissions, creating pressure for cleaner propulsion and auxiliary systems.
• Shipping emissions increased 20% over the past decade, showing why incremental efficiency improvements are not enough.
• Without stronger action, shipping emissions could reach 130% of 2008 levels by 2050.
• Battery-electric pathways for EU shipping segments have been modeled with only 11% additional primary energy demand by 2050, compared with higher energy requirements for synthetic fuel pathways.
• Electric powertrain conversion estimates cited in maritime battery analysis commonly range from 80% to 95%, with some high estimates near 98%.
• Full electrification is strongest on short routes, especially routes of up to one hour where charging and turnaround can be planned.
• Port electrification can reduce local emissions, improve air quality, and make shore-side charging a market requirement rather than an optional add-on.
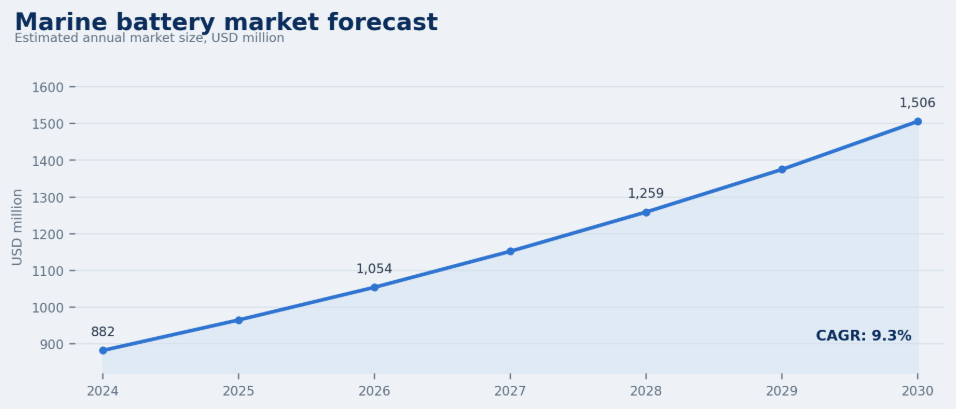
Figure 1. Marine battery market growth should be reviewed with vessel adoption and charging readiness.
|
Market context Marine batteries grow fastest where route profile, charging access, emissions rules, and operating economics align. |
Global Marine Battery Market Size and Forecast
Market-size estimates vary because research firms define the market differently. Some include all shipboard battery systems, while others focus on propulsion batteries, lithium-ion packs, hybrid systems, power electronics, charging hardware, or retrofit demand.
The direction is clear: the market is growing from hundreds of millions of dollars into a multibillion-dollar category as ferries, commercial ships, hybrid systems, port electrification, and marine lithium-ion capacity expand.
Market-size and forecast benchmarks
• MarketsandMarkets values the market at USD 882.3 million in 2024 and projects USD 1,506.0 million by 2030.
• The same forecast implies an approximate 9.3% CAGR from 2024 to 2030.
• ResearchAndMarkets lists the same USD 882.3 million 2024 baseline and a near USD 1.50 billion forecast value.
• Fortune Business Insights estimates USD 1.67 billion in 2025 and USD 2.10 billion in 2026.
• Fortune Business Insights projects the market could reach USD 6.11 billion by 2034 at a 16.50% CAGR.
• Research Nester estimates the market at over USD 2.4 billion in 2025 and USD 2.7 billion in 2026.
• Research Nester projects USD 7.2 billion by 2035 at a 13.1% CAGR.
• Maximize Market Research estimated USD 651.83 million in 2023 and nearly USD 2,113.62 million by 2030.
• Custom Market Insights estimated the marine lithium-ion battery market at USD 276 million in 2023 and projected about USD 821 million by 2032.
• The wide forecast range shows that market scope matters: total marine batteries, lithium-ion marine batteries, vessel propulsion systems, and hybrid battery packages are not identical measurement categories.
Marine battery market forecast snapshot
| Forecast view | Base year | Base value | Forecast year | Forecast value | CAGR |
|---|---|---|---|---|---|
| Main forecast | 2024 | USD 882.3M | 2030 | USD 1,506.0M | 9.3% |
| High-growth forecast | 2026 | USD 2.10B | 2034 | USD 6.11B | 16.50% |
| Long-range forecast | 2026 | USD 2.7B | 2035 | USD 7.2B | 13.1% |
| Lithium-ion view | 2023 | USD 276M | 2032 | USD 821M | Endpoint-derived |
|
Forecast readout Marine battery forecasts vary by scope, but vessel adoption, charging investment, and emissions pressure all point to continued growth. |
Battery-Powered Vessel Adoption Statistics
Fleet adoption is one of the most useful ways to judge the market. Revenue forecasts can be broad, but vessel counts show what is already moving through yards, shipowners, ferry operators, ports, and classification processes.
The battery-powered ship pipeline also explains why hybrid systems dominate. Full electrification works best on short routes, while hybrid systems support peak shaving, spinning reserve, dynamic positioning, port operation, and fuel reduction on more vessel types.
Fleet adoption benchmarks
• DNV/Faraday data counted 944 battery-powered ships in operation as of January 2025.
• Another 451 battery-powered ships were under construction at that time.
• The combined in-operation and under-construction battery-powered fleet was about 1,395 ships.
• Ships under construction represented about 32.3% of the combined battery-powered fleet pipeline.
• Ships in operation represented about 67.7% of the combined operating plus under-construction battery-powered fleet.
• Fully electric vessels represented 18% of battery-powered ships.
• Hybrid vessels represented 65% of battery-powered ships, making hybridization the largest current propulsion category.
• Plug-in hybrid vessels represented 17% of battery-powered ships.
• Car and passenger ferries were the most common battery-installed vessel type, with 353 ships in operation.
• Car and passenger ferries represented about 35% of ships with batteries in operation in the reported fleet data.
• Using the 944 in-operation fleet count, fully electric vessels would represent roughly 170 ships, hybrids about 614 ships, and plug-in hybrids about 160 ships.
• Using the combined 1,395 ship pipeline, the same mix would imply about 251 fully electric ships, 907 hybrids, and 237 plug-in hybrids.
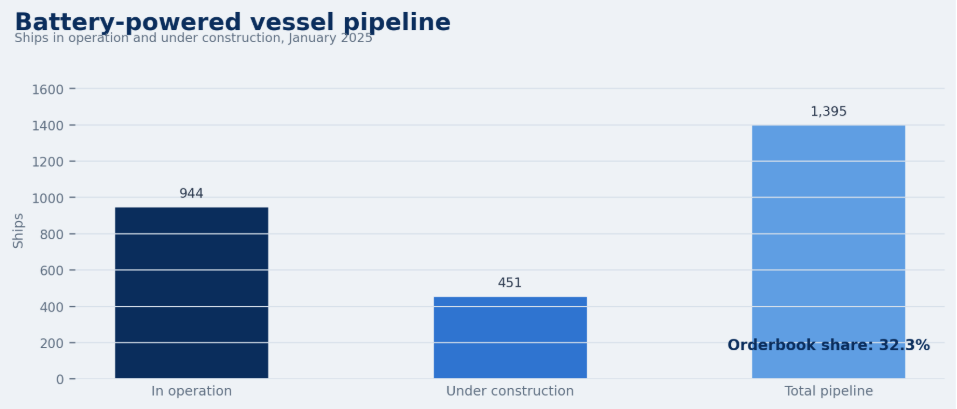
Figure 2. Battery-powered ships in operation and under construction show the deployed base and near-term pipeline.
Battery-powered vessel adoption snapshot
| Fleet Indicator | Value | Market Meaning |
|---|---|---|
| Ships in operation | 944 | The deployed adoption base |
| Ships under construction | 451 | Near-term pipeline |
| Total fleet pipeline | 1,395 | Combines operating and build activity |
| Fully electric share | 18% | Pure electrification progress |
| Hybrid share | 65% | Transitional adoption strength |
| Plug-in hybrid share | 17% | Charging-linked hybrid growth |
| Car/passenger ferries | 353 ships | Short-route concentration |
|
Fleet readout Battery-powered vessel adoption is strongest where charging, duty cycles, and emissions benefits are easy to measure. |
Battery Chemistry and System Type Statistics
Battery chemistry matters because marine applications are demanding. Vessels operate in harsh environments, carry passengers or cargo, and need rapid charging, high cycling, monitoring, fire protection, and safe integration with propulsion or auxiliary loads.
Lithium-ion systems dominate because they combine energy density, power capability, and maturity. NMC, LFP, LTO, sodium-ion, and solid-state options create different tradeoffs in cost, power, energy density, safety, and charging performance.
Battery chemistry and system benchmarks
• Future Market Insights reports lithium-ion battery systems account for 78.0% share in 2026 in marine power battery systems.
• Polaris Market Research reports deep-cycle batteries held 33.21% market share in 2025.
• Mordor Intelligence reports dual-purpose systems captured 44.98% of market size in 2025.
• Mordor Intelligence projects dual-purpose systems to advance at an 11.15% CAGR through 2031.
• Mordor Intelligence reports the 1–5 MWh capacity range represented 54.10% of market size in 2025.
• The same source projects the 1–5 MWh range to rise at a 9.28% CAGR to 2031.
• Faraday’s maritime battery review notes that NMC has become a preferred battery technology in marine applications because of energy and power density.
• LFP is increasingly relevant because it offers safety and cost advantages in several transport and stationary markets.
• LTO cells can be useful where high power and fast charging matter, though they typically compromise on energy density.
• Sodium-ion and solid-state batteries are future options to monitor, especially if cost, safety, or energy-density performance improves.
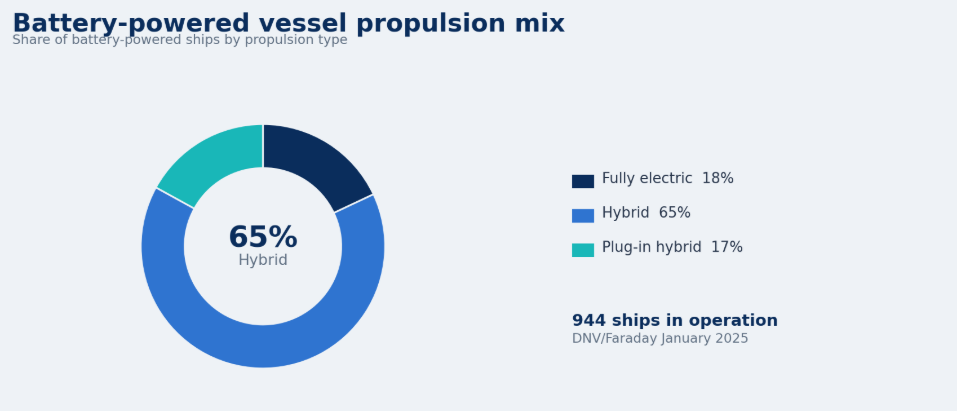
Figure 3. Hybrid vessels represent the largest current share of battery-powered ships.
Battery system types and market role
| Battery/System Type | Market Role | Why It Matters |
|---|---|---|
| Lithium-ion | Dominant shipboard battery chemistry | High energy density and growing marine use |
| NMC | High energy and power density | Common in marine battery applications |
| LFP | Safety and cost advantages | Growing in transport and stationary use |
| LTO | High power and fast cycling | Useful where rapid charging is valuable |
| Dual-purpose systems | Propulsion plus auxiliary use | Supports flexible vessel operation |
| 1–5 MWh systems | Mid-sized vessel applications | Strong fit for ferries and hybrid vessels |
|
Chemistry readout Battery chemistry should match vessel duty cycle, charging pattern, safety needs, and operating profile. |
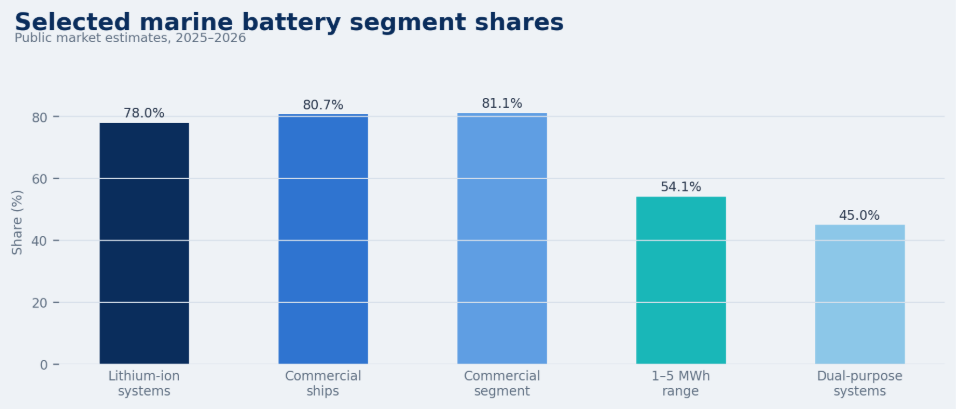
Figure 4. Segment shares show how chemistry, capacity range, and commercial-vessel use shape the market.
Vessel-Type and Application Statistics
Marine batteries fit best when a vessel has a predictable operating pattern, repeatable charging window, high fuel-cost exposure, or strong emissions incentive. Ferries, tugboats, offshore support vessels, and selected short-sea routes remain stronger early candidates than deep-sea cargo routes.
Hybrid systems expand the addressable market because the battery does not need to carry the full voyage. It can handle power peaks, reduce engine hours, provide spinning reserve, support dynamic positioning, cut port emissions, or improve generator efficiency.
Vessel and application benchmarks
• Grand View Research reports commercial ships accounted for about 80.7% of marine battery market share in 2025.
• Polaris Market Research reports the commercial segment accounted for 81.08% of revenue share in 2025.
• Mordor Intelligence reports commercial vessels held 71.68% of market size in 2025.
• Mordor Intelligence says defense applications are projected to record the fastest 10.26% CAGR.
• Grand View Research reports the 150–745 kW ship-power segment accounted for about 32.8% share in 2025.
• Car and passenger ferries are the leading vessel type in the battery-powered fleet, with 353 ships in operation.
• Faraday’s application table shows ferries can reach up to 100% fuel savings when fully electric operation is feasible.
• Tugboats are listed with 5–15% hybrid fuel savings, while fully electric tugboat use can reach 100% fuel saving in the right operating context.
• Offshore supply vessels are listed with 5–20% fuel-saving potential and a 2–5 year payback signal.
• Fishing vessels are listed with 3–30%+ fuel-saving potential and a 3–7 year payback signal.
• Cruise applications are listed with less than 5% fuel-saving potential, showing that battery use may be more relevant for auxiliary and port-load support than full propulsion.
• Deep-sea vessels are listed with 0–14% fuel-saving potential in hybrid applications, reinforcing the limits of full battery-electric deep-sea shipping.
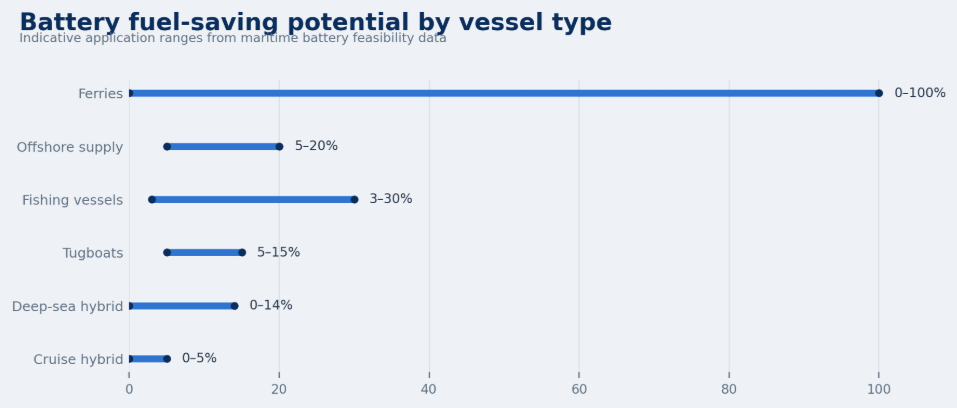
Figure 5. Battery fuel-saving potential varies by vessel type because route length and charging access define feasibility.
Marine battery application matrix
| Vessel Type | Battery Use Case | Market Fit |
|---|---|---|
| Ferries | Full electric propulsion | Strong fit for short fixed routes |
| Tugboats | Hybrid or full electric | Strong where ports support charging |
| Offshore support vessels | Hybrid reserve and dynamic positioning | Strong fuel-saving use case |
| Cruise ships | Hybrid support and port operation | Useful for hotel load and emissions zones |
| Deep-sea vessels | Hybrid support, not full-route electric | Limited by energy density |
| Fishing vessels | Hybrid load leveling | Depends on route and duty cycle |
|
Application readout Marine batteries scale best when route length, charging time, vessel load, and operating schedule fit the technology. |
Regional Marine Battery Market Intelligence
Regional data is critical because adoption depends on vessel routes, port policy, charging access, shipbuilding capacity, safety approvals, and emissions rules. Europe leads the visible fleet, Asia-Pacific matters for supply and shipbuilding, North America has port-electrification potential, and Latin America has a large-ferry example.
Europe
Europe is the leading adoption region in the reported battery-powered ship fleet. Faraday’s review states that Europe accounts for 68% of global battery-powered ships, and Norway alone accounts for 33%. That reflects a strong combination of ferry routes, offshore vessel demand, Nordic maritime policy, shipyard experience, and charging infrastructure.
• Norway accounts for 33% of global battery-powered ships, making it the strongest country-level adoption signal in the fleet data.
• Car/passenger ferries are a major European use case because short fixed routes make charging and payback easier to plan.
• The Aurora ferry between Sweden and Denmark was retrofitted with a 4.2 MWh battery and makes 46 crossings every 24 hours.
• Finland’s Elektra ferry has a 1,000 kWh battery and operates a short 1.6 km crossing.
• The Saint-Malo ferry is described with an 11.3 MWh battery pack for France-UK service.
North America
North America’s opportunity is heavily tied to ports, ferries, and harbor craft. Faraday’s analysis cites port electrification scenarios where full electrification of ocean-going vessels, harbor craft, and drayage trucks could reduce up to 75% of port emissions in Seattle and up to 69% in New York.
• Seattle port electrification scenarios show potential port-emissions reductions of up to 75%.
• New York port electrification scenarios show potential port-emissions reductions of up to 69%.
• Los Angeles, San Francisco, and Juneau are listed as examples of ports with substantive electrification measures.
• Canada matters through the marine battery supplier ecosystem, with Corvus Energy named among leading market players.
Asia-Pacific
Asia-Pacific is important for shipbuilding, battery suppliers, nearshore vessel deployment, and large electric ferry construction. China’s role is especially visible through CATL’s maritime expansion. Financial Times coverage cited CATL as having equipped about 900 nearshore vessels with batteries and planning to expand its marine battery team.
• CATL has reportedly equipped about 900 nearshore vessels with batteries.
• CATL’s marine team expansion target is reported at 500 staff.
• Japan matters through supplier capability, with Toshiba named in marine battery market company lists.
• Australia became visible through Incat Hull 096, a 130 metre large electric ferry with more than 40 MWh of battery capacity.
Latin America, Middle East, and Africa
Latin America’s most visible current signal is tied to ferry deployment rather than broad fleet statistics. Incat Hull 096, also known as China Zorrilla, is designed for Buquebus service connected to Argentina and Uruguay. Middle East and Africa adoption is earlier stage, but ports, tourism craft, ferries, and coastal vessels could become future opportunity areas as charging infrastructure and emissions policies mature.
• Incat Hull 096 is designed to carry 2,100 passengers and 225 vehicles.
• The vessel has more than 40 MWh of battery capacity and eight electric waterjets.
• Argentina and Uruguay appear as relevant markets because the large electric ferry is tied to the Buenos Aires-Uruguay route environment.
• Early-stage coastal and port markets will depend on financing, grid capacity, charging standards, and vessel-route suitability.
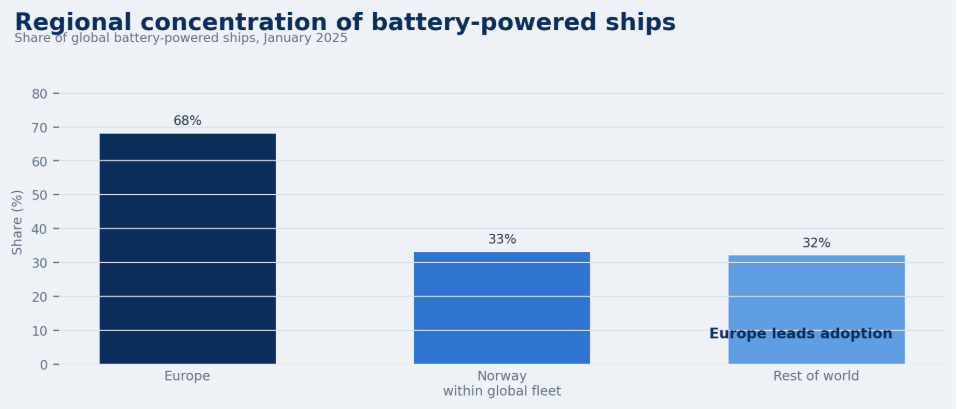
Figure 6. Marine battery adoption is regionally concentrated, with Europe and Norway standing out.
Regional marine battery market comparison
| Region | Market Position | Main Opportunity | Main Constraint |
|---|---|---|---|
| Europe | Leading battery-vessel adoption region | Ferries, offshore vessels, ports | Infrastructure scale and safety compliance |
| North America | Strong port-electrification potential | Ports, ferries, tugboats | Grid upgrades and investment timing |
| Asia-Pacific | Supplier and shipbuilding strength | China, Japan, Korea, Australia | Charging standards and vessel diversity |
| Latin America | Emerging ferry opportunity | Cross-border passenger routes | Financing and port readiness |
| Middle East & Africa | Early-stage market | Ports, ferries, tourism vessels | Infrastructure and policy maturity |
|
Regional readout Marine battery adoption is regional: Europe leads today, Asia-Pacific matters for supply, North America is tied to ports, and Latin America shows ferry opportunity. |
Country-Level Marine Battery Statistics
Country-level data matters because adoption often begins with a route, ferry operator, port, or shipyard rather than a nationwide fleet transition. The strongest examples appear where vessel schedules, charging access, regulation, and economics align.
Norway
Norway is the clearest country-level leader. The country accounts for 33% of global battery-powered ships in the DNV/Faraday data, reflecting years of ferry electrification, offshore vessel hybridization, public procurement, and charging infrastructure. Norway’s role is important because it shows how a country can build an ecosystem rather than only buy isolated battery systems.
Sweden, Denmark, and Finland
Sweden, Denmark, and Finland show how short fixed routes support practical battery operation. The Aurora ferry, operating in the Sweden-Denmark route environment, was retrofitted with a 4.2 MWh battery and makes 46 crossings every 24 hours. Finland’s Elektra ferry operates a short 1.6 km crossing with a 1,000 kWh battery and short charging windows.
United Kingdom and France
The United Kingdom and France are important because they show larger passenger-vessel and Channel-route electrification potential. The Saint-Malo ferry is described with an 11.3 MWh battery pack. UK shore-power planning is also relevant because the UK Chamber of Shipping recommended a 2030 target for UK ports to provide shore-power services.
China, Japan, and Australia
China is important through battery supply and nearshore vessel deployment. CATL has reportedly equipped about 900 nearshore vessels with batteries, making supplier strategy part of the market story. Japan matters through suppliers such as Toshiba. Australia became visible through Incat’s large electric ferry build, a 130 metre vessel with more than 40 MWh of battery capacity.
United States, Canada, Argentina, and Uruguay
The United States is especially relevant through port electrification, with examples such as Los Angeles, San Francisco, Juneau, Seattle, and New York. Canada appears through the supplier ecosystem, with Corvus Energy named among leading market players. Argentina and Uruguay matter because the large Buquebus-linked electric ferry creates a visible cross-border passenger-route case study.
Country-level marine battery signals
| Country | Market Signal | Why It Matters |
|---|---|---|
| Norway | 33% of global battery-powered ships | Ferry and offshore adoption maturity |
| Sweden/Denmark | Aurora ferry route | High-frequency electric ferry operation |
| Finland | Elektra ferry | Short-route hybrid/electric model |
| UK/France | Channel ferry electrification | Larger passenger-vessel potential |
| China | CATL marine battery expansion | Supplier ecosystem scale |
| United States | Port electrification | Infrastructure-led market opportunity |
| Australia | Large electric ferry construction | Scaling of battery capacity |
|
Country readout Country-level adoption usually starts with practical routes, ports, shipyards, offshore vessels, or supplier networks. |
Charging, Ports, and Infrastructure Statistics
Marine batteries cannot scale without shore-side infrastructure. A vessel battery needs charging power, dockside connection, grid capacity, safety procedures, automation, and schedules that fit the route.
Charging and port-infrastructure benchmarks
• High-power shore-to-ship charging is essential when vessels have short docking windows.
• Grid reinforcements or onshore stationary batteries may be needed when ports add high-power marine charging.
• Automated charging can improve turnaround efficiency and reduce operational friction.
• The UK Chamber of Shipping recommended a 2030 target for UK ports to provide shore-power services.
• Full electrification of ocean-going vessels, harbor craft, and drayage trucks could reduce up to 75% of port emissions in Seattle.
• The same type of scenario could reduce up to 69% of port emissions in New York.
• Faraday’s review lists Genoa, Livorno, Los Angeles, San Francisco, Juneau, Gothenburg, and Lübeck as ports with substantive electrification measures.
• Port electrification can more than double economic activity supported by electrified operations between 2020 and 2050 compared with diesel-powered operations in the cited scenario.
Marine charging infrastructure checklist
| Infrastructure Area | Why It Matters | Market Impact |
|---|---|---|
| Shore power | Enables hotel-load and dockside emissions cuts | Supports port decarbonization |
| High-power charging | Supports short ferry turnaround | Makes full-electric routes practical |
| Grid reinforcement | Prevents charging bottlenecks | Helps scale adoption |
| Stationary storage | Reduces peak grid stress | Supports port energy management |
| Automation | Improves safety and turnaround | Reduces operational friction |
| Standards | Supports interoperability | Reduces project risk |
|
Charging readout The vessel battery is only one part of the market; port power, grid capacity, automation, and berth schedules decide scale. |
Cost, Payback, Fuel Savings, and Operating Benefits
The business case depends on fuel savings, charging access, route predictability, emissions compliance, and maintenance value. Batteries are easiest to justify when they reduce inefficient engine operation, smooth peaks, lower generator hours, or support cleaner port operations.
Fuel savings vary widely by vessel type. A ferry on a short route can be fully electric and may eliminate propulsion fuel on that route. A deep-sea vessel cannot normally do that with current batteries, but hybrid systems may still reduce fuel use through peak shaving or auxiliary support.
Operating economics benchmarks
• Ferries can reach up to 100% fuel savings where full electric operation is feasible.
• Offshore support vessels are listed with 5–20% fuel-saving potential and 2–5 year payback signals.
• Fishing vessels are listed with 3–30%+ fuel-saving potential and 3–7 year payback signals.
• Tugboats are listed with 5–15% hybrid fuel-saving potential and 2–8 year payback signals.
• Deep-sea vessels are listed with 0–14% hybrid fuel-saving potential, showing why full-route battery operation is not the near-term model for this category.
• Cruise applications are listed with less than 5% fuel-saving potential, but batteries can still support hotel load, port operation, and emissions-zone compliance.
• The Viking Queen offshore support vessel retrofit used a 1.6 MW and 0.65 MWh BESS and is estimated to provide roughly 18% fuel savings.
• P&O Pioneer has an 8.8 MWh battery pack and is estimated to use 40% less fuel than the existing fleet.
• Battery-electric powertrains can convert input energy to propulsive power at much higher efficiency than many combustion-based pathways.
Battery economics by application
| Application | Fuel-Saving Potential | Payback Signal | Market Meaning |
|---|---|---|---|
| Ferry | Up to 100% | Short-route dependent | Strongest electrification fit |
| Tugboats | 5–15% hybrid / 100% full electric | 2–8 years | Strong where port charging exists |
| Offshore support vessel | 5–20% | 2–5 years | Strong hybrid use case |
| Fishing vessel | 3–30%+ | 3–7 years | Depends on duty cycle |
| Cruise | Less than 5% | Highly variable | More useful for auxiliary and port-load support |
|
Economics readout Marine batteries are easiest to justify when fuel savings, emissions value, charging access, and route predictability work together. |
Safety, Regulation, and Technology Challenges
Marine batteries operate in a demanding environment. Saltwater exposure, confined spaces, vibration, temperature variation, high voltage, and passenger or crew safety make classification approval, fire suppression, ventilation, monitoring, emergency response, and training central to market maturity.
Challenges worth measuring
• Battery safety is a central adoption issue because thermal events on vessels create different risks than land-based installations.
• High-voltage charging requires safe connection procedures, interlocks, monitoring, and crew training.
• Battery degradation affects lifecycle cost because capacity fade can change route margin, charging needs, and replacement timing.
• Battery mass matters because vessel stability, payload, and design layout can be affected by large battery packs.
• The Incat/Buquebus large electric ferry is reported with more than 250 tonnes of batteries, showing how battery mass becomes a naval architecture issue.
• Charging reliability matters because a missed charge can disrupt a fixed ferry schedule.
• Safety compliance and classification approval can affect project timelines as much as battery cost.
• End-of-life planning, reuse, recycling, and battery replacement strategy will become more important as the fleet grows.
Marine battery risk signals
| Risk Area | Metric to Track | Why It Matters |
|---|---|---|
| Battery safety | Fire and thermal-event controls | Critical for vessel approval |
| Charging reliability | Failed charge events | Affects route operations |
| Battery degradation | Capacity retention | Affects lifecycle cost |
| Grid connection | Charging availability | Limits full-electric routes |
| System weight | Battery mass and placement | Affects vessel design |
| Standards compliance | Class approval and testing | Reduces project risk |
|
Safety interpretation Marine batteries require a systems view because safety, charging, vessel layout, and route reliability all affect deployment. |
Marine Battery Market Diagnostic Framework
A useful marine battery statistics article should help readers decide what to measure next. The market is too complex for a single revenue figure because adoption depends on vessel type, route length, charging infrastructure, safety approval, battery chemistry, and regional policy.
Marine battery market diagnostic
| Market Area | Core Signals to Measure | Useful Benchmark |
|---|---|---|
| Market growth | Revenue forecast and CAGR | Commercial expansion |
| Fleet adoption | Ships in operation and under construction | Real deployment |
| Vessel fit | Route length, duty cycle, power demand | Electrification feasibility |
| Battery chemistry | Lithium-ion, NMC, LFP, LTO | Technology direction |
| Charging readiness | Port power, dock time, automation | Infrastructure maturity |
| Regional leadership | Europe, Norway, China, U.S. ports | Adoption concentration |
| Economics | Fuel savings, payback, maintenance | Business case |
| Safety | Fire protection, class approval, monitoring | Scale-readiness |
90-Day Marine Battery Market Review Plan
| Timing | What to Do | Output |
|---|---|---|
| Days 1–30 | Review market size, fleet adoption, vessel type, and chemistry data | Baseline marine battery market map |
| Days 31–60 | Compare regional adoption, charging infrastructure, route suitability, and port readiness | Regional and country opportunity profile |
| Days 61–90 | Evaluate economics, fuel savings, safety requirements, and supplier ecosystem | Strategic marine battery market scorecard |
|
Planning principle Marine battery analysis should compare revenue, fleet adoption, chemistry, charging access, port readiness, safety, and economics together. |
Metrics Marine Battery Leaders Should Track
| Metric | Why It Matters |
|---|---|
| Market size | Commercial scale |
| Forecast CAGR | Growth rate |
| Ships in operation | Deployed adoption |
| Ships under construction | Near-term pipeline |
| Electric versus hybrid share | Maturity of electrification |
| Battery capacity per vessel | System scale |
| Vessel type | Where adoption is concentrated |
| Route duration | Full-electric feasibility |
| Charging time | Operational practicality |
| Shore-power availability | Port readiness |
| Fuel savings | Business value |
| Payback period | Investment viability |
| Battery chemistry | Technology direction |
| Safety compliance | Deployment risk |
Named Marine Battery Vessel Benchmarks
Named vessels make the market easier to understand because they translate abstract market forecasts into real operating systems. A shipowner does not buy a market CAGR; it buys a battery pack, a charging connection, a power-management system, safety approval, and a vessel operating profile. These examples show how battery capacity, route length, charging time, and operating schedule shape market feasibility.
The ferry segment is the clearest example. Ferries operate on repeatable routes, return to known terminals, and often have short layover windows that can be planned around charging. Offshore support vessels show another model: batteries can deliver fuel savings and operational stability even when the vessel is not fully electric. Large passenger ferries show a third pattern, where battery capacity is scaling into tens of MWh and becoming a visible part of ship design.
Vessel benchmarks worth separating
• Ampere is listed as a fully electric ferry with a 20-minute route, a 6 km crossing, 34 trips per day, and a 1,040 kWh battery capacity.
• Bastø Electric is listed with a 30-minute route, a 10 km crossing, 20–24 trips per day, and a 4,300 kWh battery capacity.
• Colour Hybrid is listed as a hybrid diesel-electric vessel on a 150-minute route with a 4,700 kWh battery capacity.
• Elektra is listed as a hybrid diesel-electric ferry with a 15-minute route, a 1.6 km crossing, 25 trips per day, and a 1,000 kWh battery capacity.
• Aurora was retrofitted with a 4.2 MWh battery and makes 46 crossings every 24 hours, showing how high-frequency ferry routes can support electrification.
• Viking Queen was retrofitted with a 1.6 MW and 0.65 MWh BESS and is estimated to provide roughly 18% fuel savings.
• P&O Pioneer has an 8.8 MWh battery pack and is estimated to use 40% less fuel than the existing fleet.
• Incat Hull 096 has more than 40 MWh of battery capacity, more than 250 tonnes of batteries, 2,100 passenger capacity, and 225 vehicle capacity.
Selected vessel benchmark table
| Vessel | Route / Use Case | Battery Signal | Market Lesson |
|---|---|---|---|
| Ampere | Short ferry route | 1,040 kWh battery | Fixed routes make charging predictable |
| Bastø Electric | High-capacity ferry | 4,300 kWh battery | Short-sea routes can support larger battery systems |
| Elektra | Short Finnish ferry route | 1,000 kWh battery | Frequent charging supports short crossings |
| Aurora | Sweden-Denmark route | 4.2 MWh retrofit | Retrofits can extend electrification beyond newbuilds |
| Viking Queen | Offshore support vessel | 18% fuel-saving estimate | Hybrid batteries can improve fuel efficiency |
| Incat Hull 096 | Large passenger/vehicle ferry | >40 MWh battery | Battery sizes are scaling into large vessels |
|
Vessel readout Named vessel examples show why marine battery analysis should combine market data with operational data. Battery capacity alone is not enough; route duration, charging time, daily trips, vessel load, and port connection determine whether the system is commercially useful. |
Marine Battery Supply Chain and Competitive Landscape
The marine battery market also depends on the supplier ecosystem. Battery manufacturers, system integrators, shipyards, classification societies, port authorities, charging providers, and vessel operators all influence adoption. A strong battery cell supplier does not automatically create a scalable marine market unless it can support marine certification, packaging, cooling, monitoring, fire safety, power electronics, and service support.
China’s supplier role is especially important because battery manufacturing scale can reduce costs and expand system availability. European suppliers and integrators remain important because current vessel adoption is concentrated in European ferry and offshore markets. North American ports and vessel operators create infrastructure-led demand, while Japanese and Canadian suppliers appear in company lists and maritime battery discussions.
Supplier and ecosystem signals
• CATL has reportedly equipped about 900 nearshore vessels with batteries, showing how battery suppliers are moving into maritime applications.
• CATL’s marine team expansion target has been reported at 500 staff, indicating a more dedicated maritime battery strategy.
• ResearchAndMarkets lists marine battery market participants including Akasol, Corvus Energy, Echandia, EST-Floattech, Forsee Power, Furukawa Battery, Leclanché, Siemens Energy, Toshiba, and XALT Energy.
• Europe’s 68% share of battery-powered ships shows why European integrators, ferry operators, and maritime authorities remain central to the current adoption base.
• Norway’s 33% share of the global battery-powered ship fleet shows how one country can shape the supplier and service ecosystem around ferry and offshore vessel demand.
• Japan’s role is visible through supplier capability, while Canada appears through the marine battery ecosystem connected to Corvus Energy.
• Shipyards matter because battery system integration affects vessel layout, weight distribution, fire zones, ventilation, propulsion controls, and charging interfaces.
• Classification and safety approval can be as important as cell cost because shipowners need systems that can be approved, insured, operated, and maintained.
|
Supply-chain readout The marine battery market is not only a battery-cell market. The value chain includes system integration, marine certification, charging infrastructure, shipyard execution, software controls, thermal management, and after-sales service. Suppliers that solve those marine-specific requirements are better positioned than suppliers that only offer high-capacity cells. |
Marine Battery Market Segmentation
The market can be segmented by vessel type, battery chemistry, capacity range, propulsion role, and charging model. This helps avoid a common mistake: treating a large ferry battery, a tugboat hybrid system, a cruise auxiliary battery, and a port-side charging installation as the same type of demand. They are related, but they have different buyers, approval paths, economics, and technical requirements.
A practical segmentation model separates full-electric propulsion from hybrid support. Full-electric systems are most useful where routes are short and charging is reliable. Hybrid systems are broader because they can reduce fuel use, smooth engine load, and support dynamic positioning without replacing all onboard combustion systems. Dual-purpose systems are especially important because they support both propulsion and auxiliary loads.
Segments worth measuring separately
• Full-electric ferry systems should be measured by route duration, crossing distance, daily trips, charging power, and battery replacement strategy.
• Hybrid offshore systems should be measured by fuel savings, dynamic-positioning performance, spinning reserve, engine-load smoothing, and payback period.
• Port craft and tugboats should be measured by operating hours, harbor charging access, emissions-zone value, and duty-cycle intensity.
• Cruise and passenger vessels should be measured by hotel load, port-emission rules, auxiliary power requirements, and shore-power compatibility.
• Deep-sea vessels should be measured through hybrid support and auxiliary power rather than full-route battery propulsion.
• Battery capacity ranges should be separated because a 1–5 MWh ferry system and a 40 MWh large electric ferry create different charging, weight, and safety requirements.
• Chemistry should be tracked because NMC, LFP, LTO, sodium-ion, and future solid-state options create different tradeoffs in cost, power, energy density, and safety.
• Charging model should be tracked because plug-in hybrid, rapid ferry charging, overnight charging, and shore-power support create different port-investment needs.
Marine battery segmentation logic
| Segment | Core Metric | Why It Matters |
|---|---|---|
| Full-electric ferry | Route duration and charging window | Whether full electrification is practical |
| Hybrid offshore vessel | Fuel savings and dynamic-positioning support | Value beyond propulsion replacement |
| Port craft / tugboat | Operating hours and harbor charging | Connects duty cycle to port readiness |
| Large passenger ferry | Battery capacity and charging power | Scale and grid impact |
| Cruise support system | Hotel load and shore power | Shows emissions-zone value |
| Deep-sea hybrid | Auxiliary and peak-shaving role | Realistic battery use in long-distance shipping |
|
Segmentation readout The marine battery market becomes clearer when full-electric, hybrid, auxiliary, port, and charging segments are separated. A single market-size number can hide very different adoption paths, so segment logic is essential for a 6000+ word statistics article. |
How Stakeholders Should Use Marine Battery Statistics
Different readers should use the statistics differently. Shipowners need route-level feasibility, payback, safety approval, and charging reliability. Ports need grid capacity, shore-power planning, charging standards, and berth scheduling. Investors need market growth, project pipeline, supplier strength, and technology risk. Policy teams need emissions benefits, safety standards, port investment, and national maritime strategy.
A good market review should therefore connect statistics to decisions. If a ferry operator sees a 100% fuel-saving possibility, the next question is whether the route has enough charging time and grid power. If a port sees a 75% emissions-reduction scenario, the next question is whether power infrastructure, vessel schedules, and financing can support implementation. If an investor sees a 16.50% CAGR forecast, the next question is which vessel segments can actually deploy batteries at scale.
Decision signals by stakeholder
• Shipowners should track route length, battery capacity, fuel savings, payback period, charging time, safety approval, and replacement cycles.
• Ports should track shore-power demand, grid connection capacity, berth charging windows, automated charging potential, and emissions-reduction targets.
• Investors should track market-size forecasts, fleet adoption, supplier concentration, chemistry development, port readiness, and policy support.
• Utilities should track charging load profiles, peak demand, stationary storage needs, grid reinforcement, and power-quality requirements.
• Shipyards should track battery mass, vessel layout, cooling systems, fire protection, power electronics, and integration timelines.
• Regulators should track classification standards, crew training, emergency response, fire safety, charging protocols, and recycling requirements.
• Fleet operators should track downtime risk, failed charge events, battery health, route reliability, and maintenance savings.
• Market researchers should separate revenue forecasts from vessel-count adoption so the article does not overstate growth without deployment evidence.
|
Stakeholder readout Marine battery statistics become more useful when they are tied to decisions. The same statistic can mean different things to a shipowner, port authority, investor, utility, or regulator. A mature article should show both the number and the operating question behind it. |
Marine Battery Market Statistics FAQ
What is the size of the marine battery market?
MarketsandMarkets places the market at USD 882.3 million in 2024 and projects USD 1,506.0 million by 2030. Broader forecasts place the market higher because they use wider scope definitions.
How fast is the marine battery market growing?
Forecasts vary by scope. MarketsandMarkets reports a 9.3% CAGR, while Fortune Business Insights reports 16.50% for its forecast period.
How many battery-powered ships are operating globally?
DNV/Faraday data shows 944 battery-powered ships in operation as of January 2025, with another 451 under construction.
Which region leads marine battery adoption?
Europe leads the reported battery-powered ship fleet with 68% of global battery ships. Norway alone accounts for 33%.
Why does Norway lead marine battery adoption?
Norway combines ferry routes, offshore vessel demand, policy support, charging infrastructure, and maritime electrification experience.
Which vessels are best suited for batteries?
Short-route ferries, port craft, tugboats, offshore support vessels, and selected fishing or short-sea vessels are the strongest early candidates.
Are marine batteries mostly fully electric or hybrid?
Hybrid vessels dominate the reported fleet at 65%. Fully electric vessels represent 18%, and plug-in hybrids represent 17%.
Which battery chemistry is most common in marine batteries?
Lithium-ion systems are the dominant marine power battery category, with one source placing them at 78.0% share in 2026.
Why is charging infrastructure important?
Charging access determines whether a battery vessel can operate reliably. Dock time, grid capacity, shore power, automation, and safety systems all affect feasibility.
Can deep-sea vessels become fully battery electric?
Full battery-electric deep-sea operation remains limited by energy density and voyage length. Batteries are more realistic for hybrid support, auxiliary loads, peak shaving, and port operation.
Final Takeaway
Marine batteries are becoming a real maritime market because the strongest early use cases connect technology to practical operating value. Ferries, port craft, offshore vessels, tugboats, passenger vessels, and selected hybrid systems can reduce fuel burn, lower local emissions, and improve operating efficiency.
The adoption base is already measurable. DNV/Faraday data shows 944 battery-powered ships in operation and 451 under construction. Europe accounts for 68% of global battery-powered ships, Norway accounts for 33%, and car/passenger ferries remain the clearest early use case with 353 ships.
Future growth depends on more than battery packs. Ports need shore power, charging capacity, automation, safety procedures, and reliable berth schedules. Shipowners need route feasibility, payback visibility, lifecycle planning, and class approval.
The practical takeaway is that marine batteries should be measured as a systems market. Revenue forecasts, vessel adoption, regional concentration, battery chemistry, charging readiness, safety requirements, and fuel-saving potential need to be read together.


