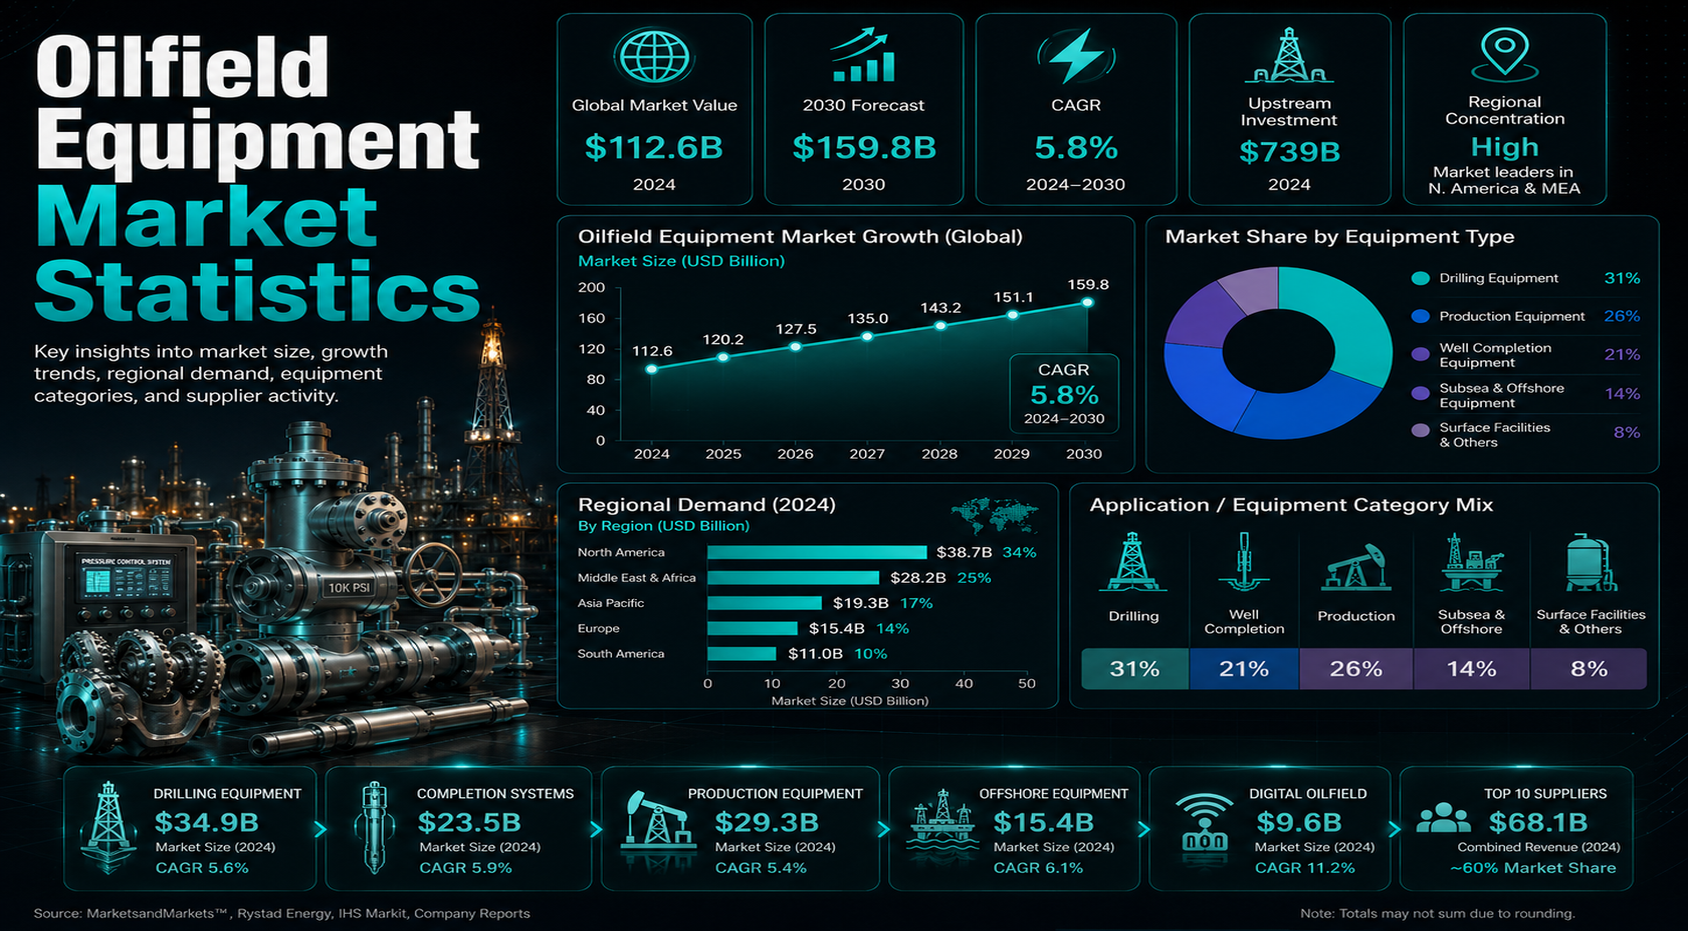
Oilfield equipment is the physical backbone of upstream oil and gas. The market covers drilling rigs, downhole tools, tubulars, pressure-control systems, completion equipment, pumps, production trees, subsea hardware, automation systems, and the support equipment that keeps wells working after first oil.
The statistics behind this market need to be read as a practical activity scorecard. Oilfield equipment demand does not move with oil prices alone. It reflects upstream capital spending, active rigs, well complexity, completion intensity, offshore project timing, service-company backlog, and regional energy-security priorities.
This article organizes oilfield equipment statistics into a practical market scorecard, covering market size, equipment categories, regional demand, country-level signals, drivers, risks, and the metrics analysts should track before treating one headline market value as the full story.
Executive Oilfield Equipment Benchmarks
The strongest oilfield equipment statistics frame the market as a mix of long-cycle capital projects and short-cycle drilling activity. Market value shows the revenue pool, but the real signal comes from the physical work behind it: rigs running, wells completed, fields maintained, and offshore projects sanctioned.
• The global oilfield equipment market was valued at USD 126.91 billion in 2023 and is projected to reach USD 156.50 billion by 2030.
• Grand View Research projects a 3.1% CAGR for oilfield equipment from 2024 to 2030, while other market estimates place the 2032 outlook above USD 170 billion.
• Market Data Forecast valued the market at USD 129.71 billion in 2023 and projected USD 172.22 billion by 2032 at a 3.20% CAGR.
• Sky uest estimated the oilfield equipment market at USD 129.89 billion in 2024 and projected USD 183.28 billion by 2032.
• Well completion equipment and services were valued at USD 25.61 billion in 2025 and are projected to reach USD 40.19 billion by 2034.
• North America represented 34.71% of the well completion equipment and services market in 2025, showing why shale and tight-oil activity still shape global supplier demand.
• U.S. total active oil and gas rigs fell to 566 in May 2025, including 465 oil-directed rigs and 98 gas-directed rigs.
• The Permian Basin had around 279 active rigs and accounted for nearly 48% of U.S. crude production in 2024.
• The Middle East is expected to invest about USD 130 billion in oil and gas supply in 2025, with Saudi upstream investment near USD 40 billion.
• SLB reported roughly USD 36.3 billion in 2024 revenue, Baker Hughes reported USD 27.8 billion, and Halliburton reported USD 22.9 billion.
• The United States produced around 11,100 TWh of oil-equivalent output in 2024, while Saudi Arabia and Russia each stood near 5,100 TWh.
• Brazil produced around 2,100 TWh of oil-equivalent output in 2024, reinforcing its role as a deepwater and subsea equipment market.
How to read the benchmark signals
• For article interpretation, market value should be read as the starting point. The better question is whether the value is supported by capex, tenders, rig deployment, well starts, completion activity, and production targets.
• Offshore and unconventional markets create different equipment cycles. Offshore demand is long-lead and engineering-heavy, while shale demand is shorter-cycle and more sensitive to active rigs and completion crews.
• Country-level production data also matters because large producers usually need ongoing replacement parts, valves, pumps, flow-control systems, tubulars, and field-service support even when exploration slows.
• A higher market-size forecast is most useful when it is connected to physical work: rigs must drill, crews must complete wells, and operators must place production equipment into the field.
• Equipment demand becomes stronger when upstream budgets, rig activity, service-company backlog, and well-completion work all rise together rather than one signal moving alone.
|
Editorial readout Oilfield equipment statistics are most useful when market size is read beside physical activity. Rig count, well completions, upstream capex, offshore awards, and production targets show whether demand is broad-based or concentrated in a few high-spending regions. |
Why Oilfield Equipment Still Carries Global Market Weight
Oilfield equipment remains important because upstream production is equipment intensive even when operators are disciplined with capital. Wells still require drilling, pressure control, tubulars, completions, artificial lift, flow control, separation, measurement, maintenance, and inspection. Mature fields need equipment to slow decline, while new offshore fields require large packages long before output appears.
The energy transition changes the context, but it does not remove the need to maintain existing production systems. Countries with energy-security concerns, national oil company capacity programs, gas development priorities, and offshore project pipelines continue to support equipment demand. That is why the market should be judged through capital spending, rig activity, supplier backlog, project timing, and field complexity together.
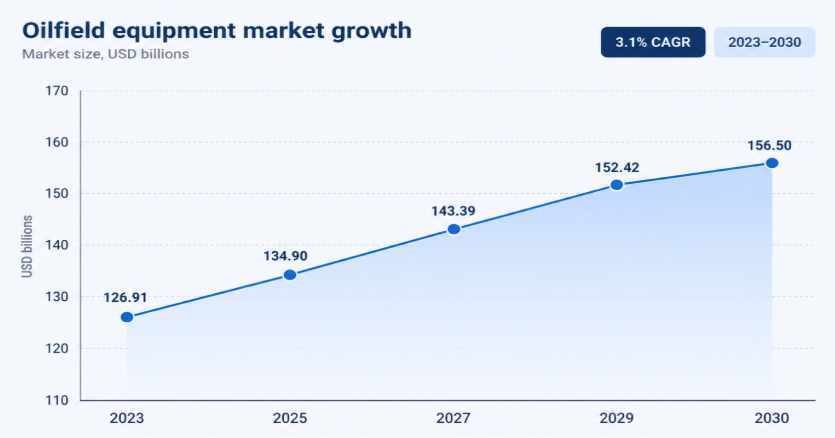
Figure 1. Oilfield equipment market growth should be read beside upstream spending and drilling activity because market value depends on project execution, not only oil demand.
Oilfield Equipment Market Size and Growth
Market size is the easiest benchmark to quote, but it is not the only way to understand equipment demand. The market expands when operators fund drilling programs, approve offshore developments, complete wells, replace aging equipment, and maintain mature assets.
Market-size signals worth watching
• The Grand View Research baseline places the market at USD 126.91 billion in 2023.
• The same outlook projects USD 156.50 billion by 2030, equal to a 3.1% CAGR from 2024 to 2030.
• A derived annual path places the market near USD 134.90 billion in 2025, USD 143.39 billion in 2027, and USD 152.42 billion in 2029.
• Market Data Forecast places the 2032 forecast at USD 172.22 billion, showing a slightly larger long-run market envelope.
• Sky Quest’s 2032 projection of USD 183.28 billion shows how market-size estimates differ depending on included equipment categories.
• Completion equipment and services have a faster projected growth profile, rising from USD 25.61 billion in 2025 to USD 40.19 billion by 2034.
• Upstream oil and gas costs are expected to climb by about 3% in 2025, which can raise equipment budgets even if activity stays flat.
| Market signal | What it shows | Why it matters |
|---|---|---|
| Market value | Total equipment revenue opportunity | Shows industry scale |
| CAGR | Forecast growth pace | Shows demand momentum |
| Upstream capex | Operator spending power | Drives equipment orders |
| Rig count | Near-term drilling activity | Signals drilling-tool demand |
| Offshore projects | Long-cycle development demand | Supports high-value equipment |
| Completion activity | Well readiness and stimulation | Drives pumps, valves, and tools |
|
Market-size readout Oilfield equipment growth should not be judged by market value alone. A stronger reading combines equipment sales, upstream investment, rig activity, completions, offshore projects, and supplier backlog. |
Drilling Equipment Statistics
Drilling equipment is the most visible part of the oilfield supply chain because it responds quickly to rig activity. Rigs, drill bits, tubulars, mud systems, blowout preventers, derricks, pressure-control hardware, and directional drilling tools all move with well starts and drilling complexity.
Drilling-equipment signals
• The United States had 566 active oil and gas rigs in the May 2025 benchmark.
• Oil-directed U.S. rigs stood at 465, while gas-directed rigs were near 98.
• Texas had around 285 active rigs, reinforcing the state’s role as a core drilling-equipment market.
• The Permian Basin had about 279 active rigs and produced around 6.3 million b/d of crude oil in 2024.
• Saudi Arabia had an estimated 230 active drilling rigs, making it one of the largest international rig-count benchmarks in the article.
• Canada is tracked at around 130 rigs, while Russia is tracked at about 80 rigs.
• Kuwait, the UAE, Iraq, and Oman each sit in the 55-70 rig range, showing why Middle Eastern procurement remains broad across drilling and well equipment.
• Argentina and India each appear with 35 rig benchmarks, which links equipment demand to Vaca Muerta activity and domestic energy-security drilling.
How to read drilling equipment signals
• International rig counts often signal longer project cycles. Middle East, offshore, and national oil company programs may move more slowly, but contract packages can be larger and more stable.
• North American drilling statistics should be interpreted with completion data because shale wells move quickly from drilling to fracturing, testing, artificial lift, and production-equipment demand.
• Replacement demand also supports drilling equipment suppliers because drill bits, motors, mud systems, BOP components, and tubulars wear quickly under intensive field activity.
• Directional drilling, measurement-while-drilling, and high-pressure equipment become more important as operators pursue longer laterals, deeper reservoirs, and technically difficult formations.
• A country can show a high rig count but still have uneven equipment demand if rigs are concentrated in low-cost conventional basins rather than complex horizontal or offshore wells.
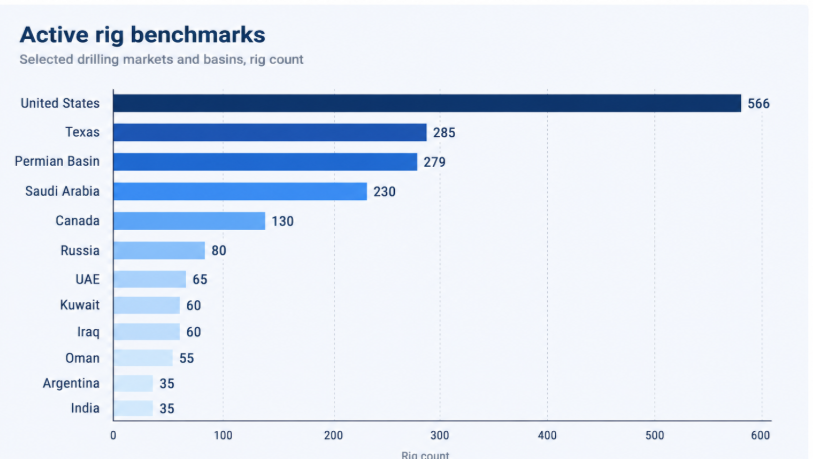
Figure 2. Active rig benchmarks highlight where short-cycle drilling equipment demand is most visible.
|
Drilling readout Rig activity is the fastest short-term signal for drilling-equipment demand, but it should be checked beside completion activity, well depth, project type, and upstream capex. |
Well Completion Equipment Statistics
A drilled well does not become a producing asset until it is completed, stimulated, tested, and connected. Completion equipment includes pressure-pumping units, packers, plugs, sand-control systems, casing and cementing tools, perforating systems, valves, and downhole control hardware.
Completion-equipment signals
• Well completion equipment and services were valued at USD 25.61 billion in 2025.
• The market is projected to grow to USD 26.98 billion in 2026 and USD 40.19 billion by 2034.
• The projected completion equipment and services CAGR is 5.11% from 2026 to 2034.
• North America represented 34.71% of the completion equipment and services market in 2025.
• The oilwell completion tools market was valued at USD 216.7 million in 2025 and is expected to reach USD 337.1 million by 2036.
• Cased-hole completions are expected to account for 39.0% of oilwell completion tools in 2026.
• Flow-control tools are expected to lead oilwell completion tools with a 24.0% share in 2026.
How to read completion demand signals
• For market storytelling, completion statistics help explain why equipment revenue can remain strong even when drilling growth looks moderate.
• Offshore completions can involve fewer wells but higher-value equipment packages because well integrity, sand control, subsea connection, and safety standards are more demanding.
• Shale completions are especially equipment-intensive because higher lateral lengths, multi-stage fracturing, and pressure requirements increase wear on pumps and field hardware.
• Pressure pumping fleets, frac valves, manifolds, wireline tools, plugs, packers, perforating systems, and cementing equipment all respond to well complexity as much as well count.
• Completion equipment spending often rises when operators focus on bringing drilled-but-uncompleted wells online, even if the headline rig count does not increase sharply.
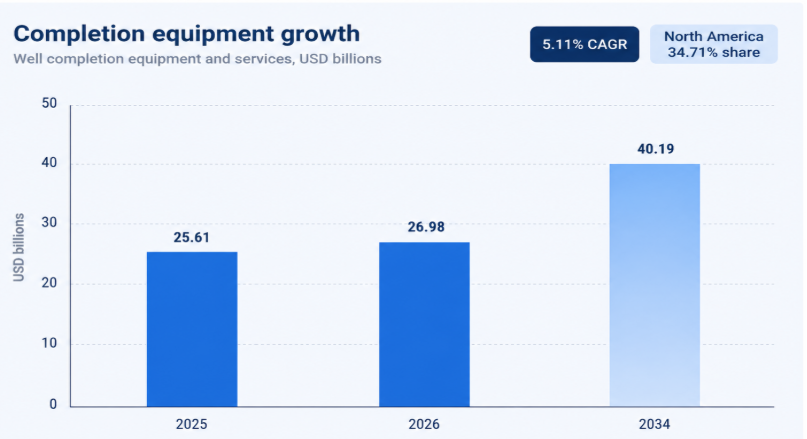
Figure 3. Completion equipment growth is driven by well complexity, shale intensity, pressure pumping, and the need to turn drilled wells into producing assets.
| Completion signal | What it shows | Market implication |
|---|---|---|
| Fracturing activity | Shale and tight-oil intensity | Supports pumps and pressure equipment |
| Packers and valves | Well isolation and control | Supports completion-tool demand |
| Sand control | Reservoir-management needs | Important offshore and unconsolidated zones |
| Cementing and casing | Well integrity requirement | Links demand to safety and regulation |
| Artificial lift | Production support | Extends demand after drilling |
|
Completion readout Completion statistics often explain equipment demand better than drilling alone. A region can drill fewer wells but spend more if wells are deeper, more complex, offshore, or completion-intensive. |
Production Equipment Statistics
Production equipment supports output after wells are online. It includes artificial lift, pumps, separators, valves, flow meters, compressors, production trees, wellheads, and surface facilities. In mature fields, this category can remain resilient even when new drilling slows because existing wells need lift, maintenance, and control systems.
• Artificial lift has the highest demand sensitivity score at 5/5 because mature-field decline and unconventional wells both require production support.
• Electric submersible pumps have a high demand outlook score of 80 index points, supported by high-rate wells and heavy fluid lifting needs.
• Sucker rod pumps remain relevant in lower-rate mature fields and conventional onshore production.
• Wellheads, production trees, valves, flow meters, separators, and compressors connect equipment demand to safety, output reliability, and measurement accuracy.
• Production equipment demand is especially important in countries with large mature assets, including the United States, Canada, Saudi Arabia, Kuwait, Oman, Mexico, Colombia, and Indonesia.
| Production equipment | Main role | Why it matters |
|---|---|---|
| Artificial lift | Maintains flow from declining wells | Important in mature fields |
| Wellheads and trees | Control well flow | Essential for safety and output |
| Pumps and compressors | Move fluids and gas | Supports reliability |
| Separators | Split oil, gas, and water | Core surface-processing equipment |
| Valves and meters | Control and measure flow | Supports automation and compliance |
|
Production-equipment readout Production equipment demand can be less cyclical than drilling equipment because existing wells still need lift support, flow control, maintenance, safety systems, and measurement tools. |
Offshore Oilfield Equipment Statistics
Offshore equipment deserves its own section because offshore projects are capital-intensive, technically complex, and long-cycle. Demand includes offshore rigs, subsea wellheads, subsea trees, risers, umbilicals, manifolds, blowout preventers, floating production equipment, and deepwater drilling support.
Offshore signals worth separating
• Brazil produced around 2,100 TWh of oil-equivalent output in 2024, and its pre-salt fields create strong subsea and FPSO-linked equipment demand.
• Norway produced around 1,050 TWh of oil-equivalent output, supporting high-spec offshore drilling, subsea, maintenance, and integrity equipment.
• The United Kingdom produced around 420 TWh and remains a North Sea market for mature offshore maintenance and decommissioning-linked services.
• Guyana produced around 520 TWh and is becoming a fast-growing offshore equipment market because of new deepwater projects.
• Angola produced around 670 TWh, sustaining demand for FPSO, subsea, and offshore services.
• Mexico’s production base supports offshore services, well maintenance, and field rehabilitation equipment.
How to read offshore equipment signals
• The most useful offshore statistics explain whether demand is moving from exploration into sanctioned development and then into delivered equipment.
• Offshore demand can be delayed by permitting, financing, engineering schedules, and vessel availability, so forecasts should be connected to actual awards and installation timelines.
• A single deepwater project can support several equipment categories at once, including drilling packages, subsea hardware, topside processing systems, flow-control equipment, and long-term maintenance services.
• Brazil, the Gulf of Mexico, Norway, Guyana, West Africa, and the Middle East matter because offshore work usually needs subsea trees, manifolds, risers, wellheads, controls, umbilicals, and high-specification drilling systems.
• Offshore equipment demand should be read through project sanctioning, subsea awards, rig contracts, FPSO activity, and field-development timelines rather than only monthly rig-count changes.
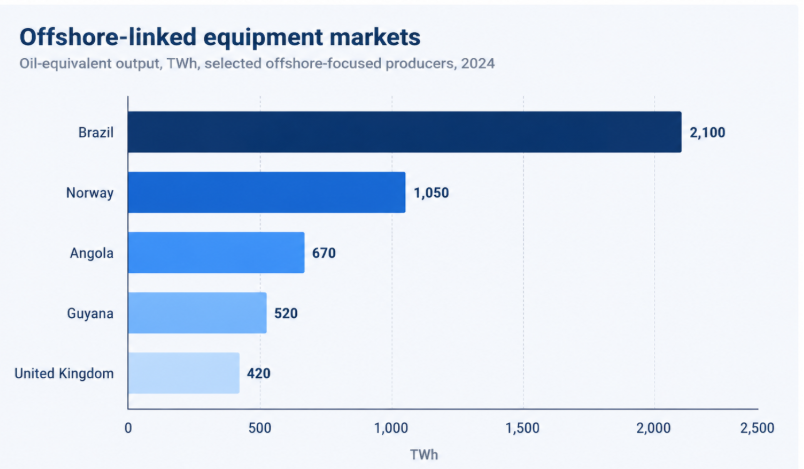
Figure 4. Offshore equipment demand is concentrated in deepwater, mature offshore, and long-cycle project markets.
| Offshore region | Equipment demand signal | Market meaning |
|---|---|---|
| Brazil | Deepwater and pre-salt activity | Strong subsea and FPSO demand |
| Gulf of Mexico | Mature deepwater base | Supports drilling and production equipment |
| North Sea | Maintenance and redevelopment | Aftermarket and integrity demand |
| Middle East | Offshore field expansion | Large supplier contracts |
| West Africa | Deepwater project pipeline | Cyclical but high-value demand |
|
Offshore readout Offshore equipment demand is usually less about fast rig-count changes and more about project sanctioning, subsea development, long lead times, and high-value engineering packages. |
Digital Oilfield and Automation Equipment Statistics
Digital oilfield equipment is now part of the equipment conversation because operators want safer, more automated, and more efficient fields. Sensors, remote monitoring, condition-based maintenance, drilling analytics, production optimization, digital twins, and emissions monitoring extend the value of physical equipment.
• Digital drilling automation has a 4/5 impact score because it changes how operators improve drilling performance and reduce nonproductive time.
• Emissions monitoring is becoming more important as methane controls and ESG reporting increase demand for measurement hardware and software.
• Predictive maintenance tools help reduce equipment failure risk, especially on rotating equipment, pumps, compressors, and critical offshore systems.
• Remote monitoring supports lower field inspection intensity and can make mature assets easier to manage with fewer site visits.
• Digital twins and analytics do not replace hardware; they increase the value of equipment by improving visibility, uptime, and decision quality.
| Digital signal | What it improves | Why operators invest |
|---|---|---|
| Remote monitoring | Field visibility | Reduces manual inspection |
| Predictive maintenance | Equipment uptime | Lowers failure risk |
| Drilling analytics | Well execution | Improves efficiency |
| Production optimization | Flow performance | Helps mature assets |
| Emissions monitoring | Compliance visibility | Supports methane reporting |
|
Digital oilfield readout Digital equipment does not replace drilling and production hardware. It changes how operators monitor, optimize, maintain, and justify equipment investment. |
Regional Oilfield Equipment Market Statistics
Regional oilfield equipment demand is not one global cycle. North America responds quickly to shale drilling and completions; the Middle East is shaped by national oil company expansion; Latin America is strongly linked to deepwater; Europe is more maintenance and redevelopment oriented; and Africa/Asia-Pacific combine conventional, offshore, and energy-security-driven demand.
Regional signals worth watching
• North America dominated completion equipment and services with 34.71% market share in 2025.
• The Middle East is expected to invest around USD 130 billion in oil and gas supply in 2025 and produced about 30% of global oil output in 2024.
• Saudi Arabia’s upstream investment is expected to reach about USD 40 billion in 2025, nearly 15% higher than in 2015.
• Eurasia upstream oil and gas investment is projected at around USD 54 billion in 2025.
• Latin America’s equipment story is led by Brazil’s deepwater pre-salt and Guyana’s offshore growth.
• Europe’s equipment demand is concentrated in the North Sea, where redevelopment, maintenance, subsea integrity, and asset-life extension are important.
• Africa’s strongest signals include Nigeria, Angola, Algeria, Egypt, and Mozambique, where oil, gas, and deepwater projects create different equipment needs.
How to read regional demand
• Asia-Pacific equipment demand should be read through energy security, domestic production targets, offshore development, and national company procurement, especially in China, India, Indonesia, Malaysia, and Australia.
• Africa combines deepwater, gas, and infrastructure risk. Equipment demand can be high value, but project timing often depends on finance, security, export infrastructure, and regulatory stability.
• Europe is more maintenance- and redevelopment-oriented because the North Sea contains mature offshore assets that need integrity management, production support, and selective drilling.
• Latin America is heavily shaped by offshore development. Brazil and Guyana can support high-value subsea, FPSO-linked, and deepwater equipment even when regional onshore drilling is uneven.
• The Middle East should be read through national oil company investment, production-capacity targets, long-term drilling contracts, and large tender packages rather than only private-sector rig activity.
• North America should be treated as a short-cycle equipment market because rig decisions, completion schedules, and pressure-pumping demand can change quickly with oil prices and operator budgets.
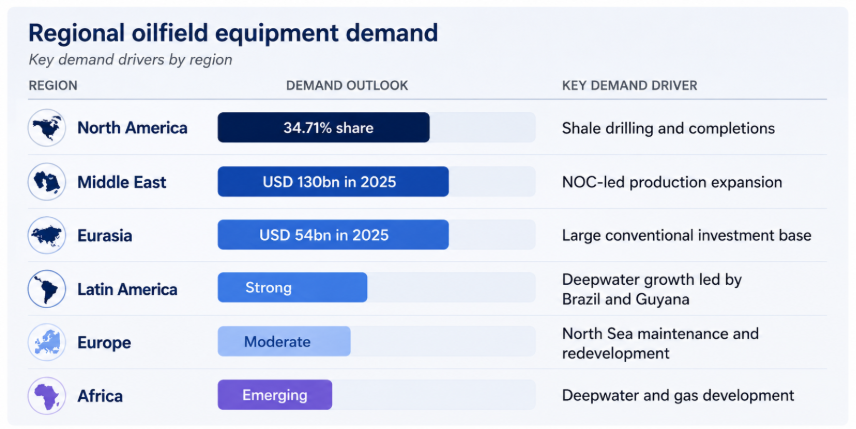
Figure 5. Regional oilfield equipment demand differs by project type , cycle length and production structure.
| Region | Main equipment demand driver | Market challenge |
|---|---|---|
| North America | Shale drilling and completions | Cyclicality and service pricing |
| Middle East | NOC-led production expansion | Tender timing and supplier competition |
| Asia-Pacific | Energy security and offshore activity | Cost pressure and delays |
| Latin America | Deepwater and new discoveries | Political and financing risk |
| Europe | Offshore maintenance and redevelopment | Declining basins and regulation |
| Africa | Deepwater and gas development | Infrastructure and investment risk |
|
Regional readout Oilfield equipment demand is not one global cycle. North America is completion-heavy, the Middle East is expansion-led, Brazil is offshore-intensive, and Europe is focused on maintenance, redevelopment, and asset integrity. |
Country-Level Oilfield Equipment Statistics
Country data separates production scale from equipment intensity. Large producers require broad equipment supply, but the type of demand changes by geology, project structure, field maturity, and operator profile.
Country-level signals
• The United States produced about 11,100 TWh of oil-equivalent output in 2024 and represented about 20.11% of the rounded global oil-production base.
• Saudi Arabia and Russia each produced about 5,100 TWh, but their equipment needs differ because Saudi demand is more tied to national capacity programs while Russia is shaped by mature fields and sanctions complexity.
• Canada produced about 3,300 TWh, supporting oil sands production equipment, pumps, heavy maintenance systems, and conventional-field support.
• China produced about 2,400 TWh and remains a domestic drilling, offshore, and mature-field equipment market.
• Iraq produced about 2,400 TWh and creates equipment demand tied to field redevelopment, wellheads, pumps, and export-linked infrastructure.
• The UAE produced around 2,100 TWh, supporting demand for premium well equipment, drilling systems, and enhanced recovery technologies.
• Brazil produced around 2,100 TWh and has one of the strongest offshore/subsea equipment profiles because of pre-salt activity.
• Venezuela holds roughly 303.0 billion barrels of proved reserves, while Saudi Arabia holds about 267.0 billion barrels and Canada about 163.0 billion barrels.
• The United States receives a 100/100 watchlist priority score, while Saudi Arabia and Russia each receive 85/100.
How to read country-level demand
• Norway and the United Kingdom illustrate mature offshore equipment intensity: the market is smaller than U.S. shale but demands high-specification equipment, integrity systems, and specialized service support.
• Canada combines oil sands, conventional production, and mature-field equipment needs, which can support pumps, heavy-duty production systems, valves, and maintenance services.
• Brazil is best read as a deepwater equipment market, where subsea hardware, offshore drilling systems, FPSO-linked equipment, and long-lead engineering packages matter more than simple well counts.
• Saudi Arabia and the UAE show how state-led production goals can support drilling, wellhead, processing, and production equipment demand through large procurement programs.
• The United States is the clearest example of short-cycle demand because shale drilling, completions, pressure pumping, and artificial lift can generate fast equipment turnover.
| Country | Equipment signal | Why it matters |
|---|---|---|
| United States | Shale drilling and completions | Largest short-cycle market |
| Saudi Arabia | Production-capacity investment | Major NOC-led buyer |
| China | Domestic upstream development | Energy-security demand |
| Brazil | Deepwater and pre-salt projects | Strong subsea and offshore demand |
| Canada | Oil sands and conventional output | Heavy equipment and production support |
| UAE | Expansion and offshore activity | Strong drilling and production demand |
| Norway | Offshore redevelopment | High-spec subsea and integrity market |
|
Country-level readout Country statistics separate scale from equipment intensity. The United States shows short-cycle completion demand, Saudi Arabia shows state-led expansion, Brazil shows deepwater complexity, and Norway shows mature offshore intensity. |
Oilfield Equipment by Application
Application analysis helps prevent the market from becoming one blended category. Onshore drilling, offshore drilling, well completion, production support, subsea development, and digital monitoring each react to different indicators.
• Onshore drilling demand is usually tied to active rig count, well starts, drilling efficiency, and operator cash flow.
• Offshore drilling demand is tied to project sanctioning, rig availability, subsea packages, and long-lead procurement.
• Completion activity links equipment demand to pressure pumping, packers, plugs, cementing, perforating, valves, and well-control systems.
• Production support depends on field maturity, artificial lift, pumping, measurement, separation, maintenance, and reliability programs.
• Subsea equipment demand depends on deepwater development, FPSO pipelines, subsea trees, manifolds, umbilicals, and controls.
• Digital monitoring is tied to equipment uptime, automated workflows, emissions tracking, and remote field management.
| Application | Main equipment used | Demand signal |
|---|---|---|
| Onshore drilling | Rigs, drill bits, tubulars, mud systems | Rig count and well starts |
| Offshore drilling | Offshore rigs, BOPs, risers, wellheads | Project sanctioning |
| Well completion | Packers, plugs, pumps, cementing tools | Completion count and complexity |
| Production | Lift systems, pumps, valves, separators | Field maturity and output support |
| Subsea | Trees, manifolds, umbilicals, controls | Deepwater development |
| Digital monitoring | Sensors, automation, analytics | Efficiency and uptime goals |
Oilfield Equipment Supply Chain and Vendor Statistics
Supplier statistics show how equipment demand turns into revenue. The supply chain includes integrated oilfield service companies, rig equipment providers, tubular manufacturers, pump and valve suppliers, subsea equipment vendors, engineering contractors, and regional manufacturing networks.
Supplier scale signals
• SLB reported roughly USD 36.3 billion in 2024 revenue across oilfield services and technology operations.
• Baker Hughes reported around USD 27.8 billion in 2024 revenue, showing the scale of energy technology and oilfield services supply.
• Halliburton reported roughly USD 22.9 billion in 2024 revenue, reflecting its completions and drilling-service exposure.
• Tenaris reported about USD 12.0 billion in 2024 revenue, highlighting OCTG and tubulars as major equipment categories.
• NOV generated about USD 8.9 billion in 2024 revenue, linking its exposure to rig equipment, wellbore technologies, and completion systems.
• TechnipFMC reported about USD 8.6 billion in 2024 revenue, showing the scale of subsea and offshore equipment packages.
• Weatherford generated around USD 5.5 billion in 2024 revenue, reflecting demand for production, completions, and well-construction technologies.
Supply-chain signals to watch
• A strong equipment outlook should therefore compare operator spending with supplier capacity, labor availability, raw-material pricing, and actual project timing.
• Service crew availability is also part of the equipment market because even delivered hardware needs technicians, maintenance crews, inspection support, and field-service capacity.
• Manufacturing lead times can become a bottleneck when upstream investment rebounds quickly, especially for high-spec offshore, subsea, and pressure-control equipment.
• Steel and alloy costs matter for tubulars, valves, pressure-control equipment, subsea systems, and pumps because material inflation can raise project budgets before field work begins.
• Supplier backlog is a useful signal because it shows whether operators are converting budgets into purchase orders, equipment packages, service contracts, and delivery schedules.
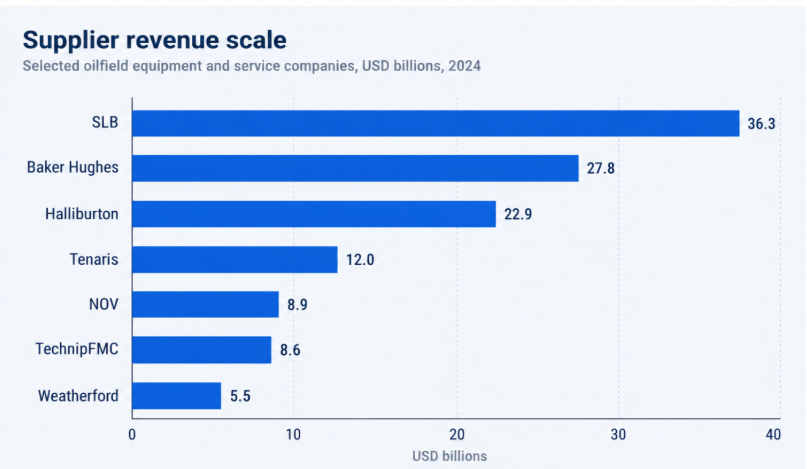
Figure 6. Supplier revenue scale shows how oilfield equipment demand flows through service, subsea, tubular, and production-technology companies.
|
Supply-chain readout Oilfield equipment demand can rise faster than supplier capacity when upstream investment rebounds. Lead times, steel costs, manufacturing capacity, and service crew availability shape how quickly spending becomes delivered equipment. |
Market Drivers: Oil Demand, Upstream Capex, and Energy Security
Oilfield equipment demand is strongest when multiple drivers reinforce one another. Upstream capex supports procurement budgets, rig activity drives drilling tools, completions create pressure-equipment demand, offshore sanctioning supports subsea packages, and energy-security policy encourages domestic activity.
Demand drivers analysts should separate
• Higher well complexity has a 5/5 impact score for equipment demand because complex wells require more specialized tools, pressure control, and completion hardware.
• Mature-field decline also has a 5/5 impact score, which supports artificial lift, workover, pumping, and production optimization equipment.
• Unconventional drilling has a 5/5 impact score, linking shale and tight-oil demand to rigs, tubulars, frac pumps, and downhole tools.
• Offshore project pipelines have a 4/5 impact score because subsea equipment, offshore rigs, risers, and FPSO-linked systems require long-lead procurement.
• National oil company capacity programs have a 4/5 impact score and are especially important in Saudi Arabia, the UAE, Kuwait, Iraq, Qatar, and China.
• Digital drilling automation has a 4/5 impact score because operators increasingly want lower nonproductive time and better well execution.
• Steel cost inflation has a 4/5 impact score because tubulars, pressure-control systems, offshore hardware, and rig equipment are material-intensive.
How to read demand drivers
• The strongest driver pattern is when high oil demand, capex growth, rig activity, completions, offshore approvals, and supplier backlog all point in the same direction.
• Gas and LNG-linked upstream projects can create demand for drilling, processing, compression, and measurement equipment, especially in countries building export capacity.
• Mature-field recovery can support equipment demand even without major new discoveries because operators still need artificial lift, pumps, compressors, separators, flow meters, valves, and integrity systems.
• Energy security can raise domestic upstream investment when countries want lower import dependence, more gas supply, or stronger reserve replacement.
• Oil demand supports the long-run need for upstream equipment, but procurement usually follows capex decisions, project approvals, and rig deployment rather than demand forecasts alone.
| Driver | Equipment impact | Why it matters |
|---|---|---|
| Upstream capex | Raises procurement budgets | Supports equipment orders |
| Rig activity | Drives drilling tools | Short-term demand signal |
| Completion intensity | Supports pressure equipment | Strong in shale and tight oil |
| Offshore sanctioning | Supports subsea packages | Long-cycle high-value demand |
| Mature field recovery | Supports lift and maintenance | Extends equipment demand |
| Energy security | Encourages domestic upstream activity | Important in import-dependent markets |
|
Driver interpretation Oilfield equipment demand is strongest when several signals move together: higher capex, active rigs, completions, project approvals, production targets, and service-company backlog. |
Market Barriers and Risks
Oilfield equipment demand can weaken even when production remains high. Operators may delay projects, suppliers may face delivery pressure, and regulation or financing can change the economics of drilling, completion, and offshore development.
Risks analysts should separate
• Oil-price volatility can delay equipment orders because operators protect cash flow when price expectations fall.
• Capital discipline can reduce spending even in profitable markets when companies prioritize returns over volume growth.
• Supply-chain delays can stretch lead times for tubulars, pumps, pressure-control equipment, subsea systems, and offshore hardware.
• Cost inflation can pressure margins because steel, labor, rigs, crews, and specialized components all affect project economics.
• Environmental regulation and methane controls can raise equipment specifications and monitoring requirements.
• Geopolitical risk can disrupt trade, sanctions exposure, local manufacturing requirements, and country-level investment timing.
Risk signals analysts should separate
• The risk section should therefore be read as a delivery filter: it explains why a strong market forecast may not become smooth equipment demand in every region.
• Geopolitical risk can interrupt trade routes, sanctions exposure, currency access, and regional investment planning, which affects both local suppliers and global equipment manufacturers.
• Permitting and environmental rules can shift equipment specifications, raise compliance costs, and delay field activity even when the economics of the project look attractive.
• Capital discipline means higher oil prices do not automatically translate into maximum drilling growth. Many operators now prioritize cash flow, shareholder returns, and selective project approval.
• Oil-price volatility affects equipment demand because operators can delay drilling, defer completions, renegotiate service contracts, or slow offshore approvals when prices weaken.
| Barrier | Why it affects equipment demand | Likely impact |
|---|---|---|
| Oil-price volatility | Operators delay spending | Slower orders |
| Capital discipline | Companies prioritize returns | Selective approvals |
| Supply-chain delays | Equipment delivery slows | Longer lead times |
| Cost inflation | Raises project budgets | Margin pressure |
| Regulation | Changes compliance needs | Higher equipment specs |
| Geopolitical risk | Disrupts investment and trade | Regional uncertainty |
|
Risk readout The main risk is not only lower oil prices. Equipment demand can also weaken when operators delay projects, suppliers face lead-time pressure, or regulation changes drilling and production economics. |
Aftermarket, Replacement, and Field-Service Equipment Statistics
Aftermarket demand is one of the reasons oilfield equipment does not behave like a simple new-project market. Installed wells, aging facilities, offshore systems, production trees, valves, pumps, compressors, tubulars, meters, lift systems, and pressure-control assets all require inspection, replacement, repair, and field-service support. That makes the installed base as important as the new-build pipeline when analysts judge equipment opportunity.
Aftermarket demand is a major reason the oilfield equipment market cannot be viewed simply as a new-project business. Existing wells, aging facilities, offshore installations, production trees, valves, pumps, compressors, tubulars, meters, artificial-lift systems, and pressure-control equipment all require regular inspection, maintenance, replacement, repairs, and field-service support. As a result, the installed equipment base can be just as important as the new-build project pipeline when analysts assess future market opportunities. Clear documentation of service and replacement transactions, supported by tools such as a receipt template, can also help companies manage these ongoing aftermarket activities more efficiently.
Aftermarket signals worth separating
• Mature-field decline carries a 5/5 impact score, making artificial lift, workover equipment, pumps, compressors, and production optimization systems central to replacement demand.
• Artificial lift has a 5/5 demand sensitivity score because unconventional wells and mature conventional assets both need lift support after initial production declines.
• Electric submersible pumps carry an 80-index demand outlook, supported by high-rate wells, heavy fluid lifting, offshore applications, and production-reliability needs.
• Countries with large producing bases, including the United States, Canada, Saudi Arabia, Kuwait, Oman, Mexico, Colombia, and Indonesia, create recurring demand for parts, maintenance, inspection, and field-service work.
• Offshore aftermarket demand is especially valuable because subsea systems, wellheads, production trees, risers, manifolds, umbilicals, and FPSO-linked equipment require high-specification service over long asset lives.
• Replacement parts, field technicians, repair cycles, inspection programs, and digital monitoring upgrades should be reviewed beside new equipment awards because they often show where demand is more resilient.
• Aftermarket opportunity is strongest when high production volume, mature-field decline, equipment wear, compliance requirements, and operator uptime targets all point in the same direction.
Procurement and Lead-Time Signals
Oilfield equipment statistics should also explain how demand becomes delivered revenue. Operators may approve budgets, but suppliers still have to manufacture tubulars, valves, BOP components, pumps, subsea trees, controls, sensors, compressors, and specialized offshore hardware. When supply chains are tight, the strongest near-term signal may be backlog, quoted lead times, and confirmed delivery schedules rather than the headline market forecast.
Lead-time analysis is especially important for deepwater, subsea, and high-pressure applications. These categories require engineering, testing, certification, vessel scheduling, installation planning, and field-service support. A market forecast can therefore look positive while actual revenue recognition depends on procurement timing, supplier capacity, steel and alloy availability, and project execution windows.
For a reference-style article, procurement signals should sit between market drivers and the final diagnostic. They help readers understand whether demand is only theoretical or already moving through tenders, purchase orders, backlog, manufacturing slots, and field deployment.
| Aftermarket signal | What to measure | Why it matters |
|---|---|---|
| Installed production base | Producing wells, mature fields, offshore assets | Recurring equipment and service demand |
| Lift and pump wear | Pump failures, ESP replacement, workover activity | Connects production decline to replacement spending |
| Integrity and inspection | Wellhead checks, valve testing, subsea inspection | Supports safety, compliance, and uptime |
| Digital retrofit demand | Sensors, monitoring, predictive maintenance tools | Extends the value of existing equipment |
| Field-service capacity | Technicians, repair centers, spare-parts access | Determines how fast equipment demand becomes revenue |
|
Aftermarket readout The aftermarket section makes the article closer to a full market scorecard. New rigs and offshore projects explain fresh equipment awards, but replacement parts, lift systems, maintenance programs, inspection work, and digital retrofits explain why demand continues after wells are already producing. For suppliers, this is often where recurring revenue, service relationships, and regional resilience appear. |
Oilfield Equipment Market Diagnostic
A polished oilfield equipment benchmark should help analysts decide where to look next. Market size, rig count, completions, offshore awards, production support, supplier capacity, and country risk each answer a different question.
| Problem area | Core metric | What it reveals |
|---|---|---|
| Market growth | Market value and CAGR | Long-term outlook |
| Drilling activity | Active rig count | Near-term demand |
| Completion intensity | Completed wells and frac activity | Pressure-equipment demand |
| Offshore pipeline | Project approvals and subsea awards | Long-cycle demand |
| Production support | Lift and maintenance demand | Mature-field needs |
| Supply chain | Lead times and backlog | Delivery pressure |
| Regional risk | Country investment and policy stability | Market reliability |
|
Diagnostic principle A useful oilfield equipment scorecard should not rely on one market-size number. It should combine capex, rig count, completions, offshore awards, production support, supplier capacity, and country risk. |
90-Day Oilfield Equipment Market Research Plan
Statistics become more useful when they are translated into a research plan. A 90-day cycle can separate broad market size from near-term order visibility, regional opportunity, and supply-chain risk.
| Timing | What to analyze | Output |
|---|---|---|
| Days 1-30 | Market size, capex, rig count, regional production | Baseline demand map |
| Days 31-60 | Completions, offshore projects, backlog, country demand | Opportunity ranking |
| Days 61-90 | Risks, pricing, lead times, regulation, investment timing | Market outlook scorecard |
|
Planning principle The best market research does not chase every statistic. It compares market size with activity, then checks whether suppliers can deliver equipment where demand is strongest. |
Metrics Oilfield Equipment Analysts Should Track
A mature oilfield equipment dashboard should be detailed enough to locate the demand signal without becoming a vanity list. The best metrics connect operator budgets, physical activity, equipment complexity, supplier visibility, and country risk.
| Metric | Why it matters |
|---|---|
| Market value | Revenue opportunity |
| CAGR | Forecast growth pace |
| Upstream capex | Operator spending power |
| Active rig count | Near-term drilling activity |
| Well completions | Production-readiness demand |
| Offshore approvals | Long-cycle equipment demand |
| Subsea awards | High-value offshore demand |
| Service backlog | Supplier visibility |
| Oil production | Field activity and maintenance needs |
| Country investment plans | Regional demand reliability |
Oilfield Equipment Market Statistics FAQ
Common questions
• What are the biggest risks for oilfield equipment suppliers?
The biggest risks include oil-price volatility, capital discipline, supply-chain delays, cost inflation, environmental regulation, permitting delays, and geopolitical disruption.
• What are the biggest drivers of oilfield equipment demand?
The main drivers are upstream capex, active rig count, completion intensity, offshore sanctioning, mature-field recovery, energy-security policy, and service-company backlog.
• Why is offshore equipment more capital-intensive?
Offshore equipment must operate in complex environments and often includes subsea trees, risers, umbilicals, manifolds, offshore rigs, FPSO-linked systems, and long-lead engineering packages.
• What is the difference between drilling equipment and completion equipment?
Drilling equipment makes the wellbore. Completion equipment prepares the well to produce through stimulation, isolation, casing, cementing, perforating, valves, and flow-control systems.
• Why does rig count matter for oilfield equipment?
Rig count is a short-term activity signal. When rigs rise, demand usually improves for drill bits, tubulars, rigs, mud systems, downhole tools, and pressure-control equipment.
• Which region has the largest oilfield equipment demand?
North America is the strongest completion-heavy market, especially because of U.S. shale. The Middle East is also critical because national oil companies continue to fund large production and field-development programs.
• What equipment is included in the oilfield equipment market?
The market includes drilling rigs, drill bits, tubulars, mud systems, blowout preventers, completion tools, pumps, artificial lift, separators, valves, wellheads, subsea systems, and digital monitoring equipment.
• What is the size of the oilfield equipment market?
The global oilfield equipment market was valued at USD 126.91 billion in 2023 and is projected to reach USD 156.50 billion by 2030 in the Grand View Research benchmark used for this article.
Final Takeaway
Oilfield equipment remains tied to physical upstream activity. Market value matters, but it becomes more useful when it is read beside rig count, well completions, offshore awards, production maintenance, upstream capex, and supplier backlog. The market can look stable at the headline level while demand shifts sharply between drilling tools, completion systems, production equipment, subsea packages, and digital oilfield technologies.
The regional picture is equally important. North America is short-cycle and completion-heavy. The Middle East is expansion-led and shaped by national oil company investment. Brazil, Norway, Guyana, Angola, and the Gulf of Mexico are offshore and subsea intensive. Canada, Mexico, Colombia, Oman, Kuwait, Indonesia, and other mature-field markets continue to support artificial lift, pumps, flow control, and production maintenance.
For analysts and suppliers, the practical goal is a scorecard that combines market size, rig activity, completions, upstream investment, offshore project timing, production support, supplier capacity, and country risk. That approach keeps the article from becoming a single market-size forecast and turns oilfield equipment statistics into a clearer view of where real demand is likely to appear.
For suppliers, the practical reading is simple: the best opportunities appear where investment plans, active rigs, completion programs, offshore awards, production maintenance, and local procurement rules point in the same direction. That is why a reference-style market scorecard should not stop at headline value. It should explain which equipment categories are moving, which regions are converting plans into activity, and which risks could slow delivery before revenue appears.


