Coffee pods and capsules have moved from a convenience accessory into a measurable, repeat-purchase coffee ecosystem. The category is now shaped by machine ownership, premium at-home brewing, supermarket shelf space, e-commerce subscriptions, workplace coffee routines, and packaging regulation. That is why the market should be read as more than a simple coffee format: it is a recurring-consumption system in which the brewer, capsule, pod material, retail channel, and brand relationship all influence demand.
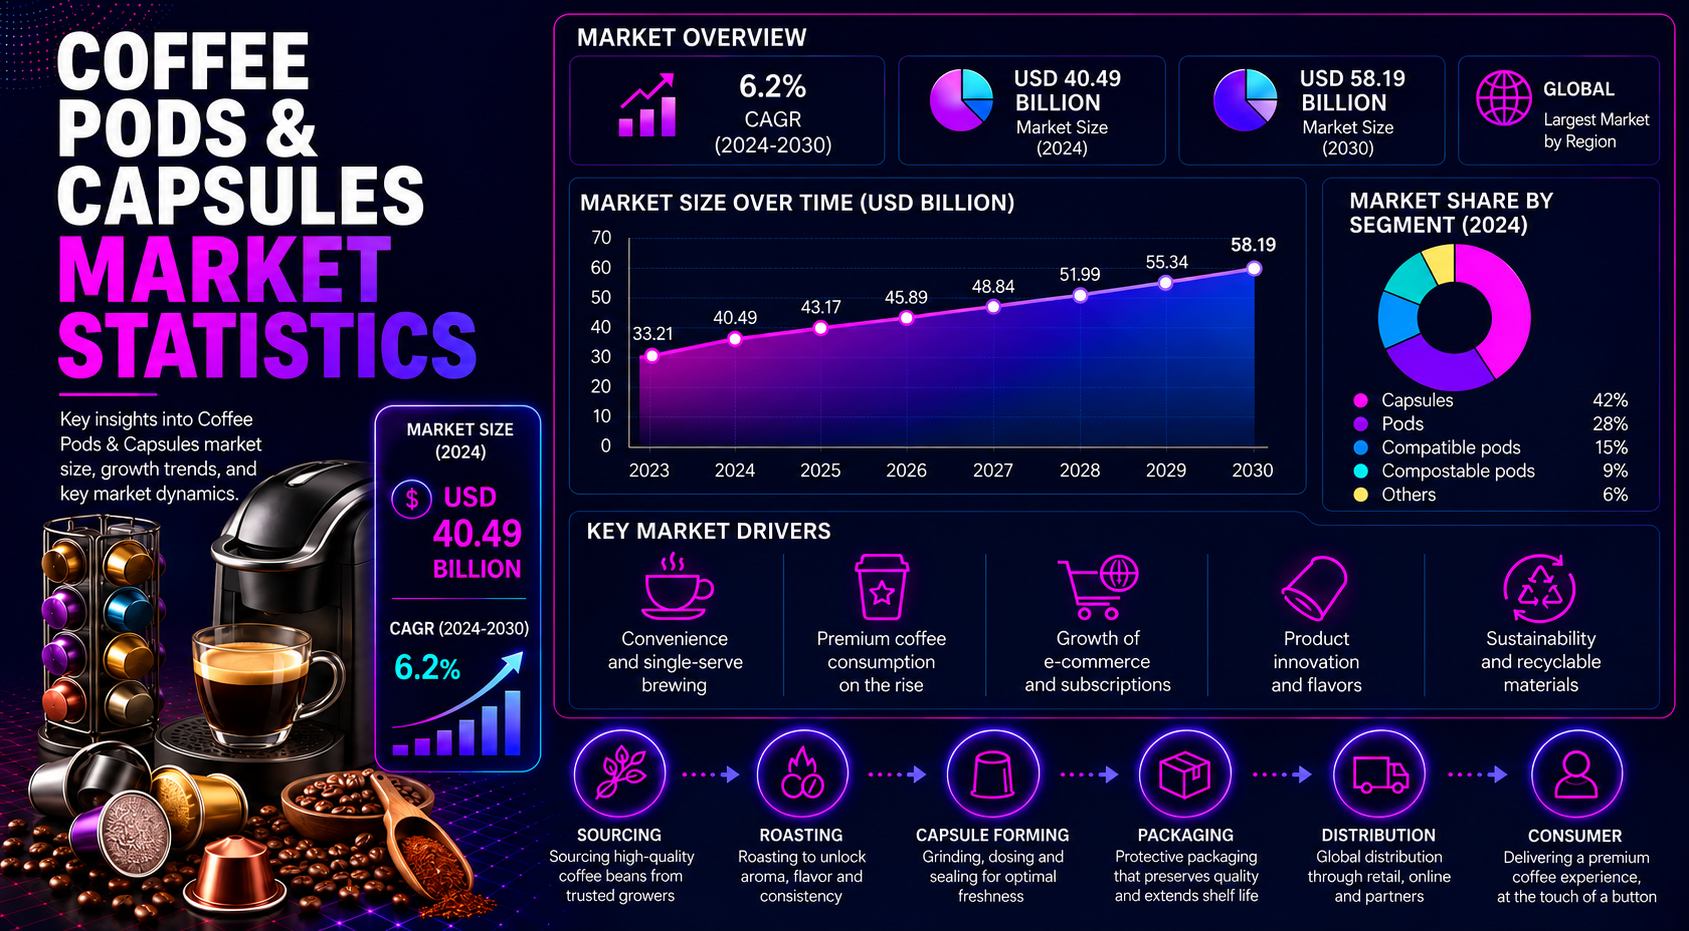
The latest collected statistics place the global coffee pods market at USD 40.49 billion in 2024, with a forecast of USD 58.19 billion by 2030. That creates roughly USD 17.70 billion in additional revenue over the period and implies a CAGR near 6.1% to 6.2% depending on the forecast base year. Other benchmarks use different definitions and put the combined coffee pods and capsules market near USD 32.62 billion in 2025 and USD 46.91 billion by 2031, while longer-horizon estimates extend toward USD 62.18 billion by 2035. The numbers vary because some sources count pods only, some count capsules and pods together, and others fold part of the single-serve coffee ecosystem into the scope.
Executive Coffee Pods Market Benchmarks
The executive benchmark section should give readers a quick market map before the detailed statistics begin. The global market is large enough to be strategic for coffee companies, retailers, appliance makers, packaging suppliers, and e-commerce operators. The 2024 value of USD 40.49 billion shows that pods are already a mature global revenue pool, while the 2030 value of USD 58.19 billion confirms that the category still has expansion room. The forecast multiple of about 1.44 times the 2024 base is meaningful because coffee is a habitual product; even modest shifts in daily routines can create large repeat-purchase value.
• Global coffee pods revenue was estimated at USD 38.01 billion in 2023 and USD 40.49 billion in 2024.
• The 2030 forecast of USD 58.19 billion implies about USD 17.70 billion of absolute growth from 2024 to 2030.
• The global CAGR range in collected benchmarks sits close to 6.1% to 6.8%, depending on source scope and forecast horizon.
• The United States accounted for about 13.0% of global coffee pods revenue in 2024, while the United Kingdom accounted for about 11.1%.
• A separate benchmark estimates the broader coffee pods and capsules market at USD 32.62 billion in 2025 and USD 46.91 billion by 2031.
• Sustainability is no longer a side issue because capsule recycling, compostable pods, and material claims now affect brand trust and regulatory risk.
| Metric | Latest value | Meaning |
|---|---|---|
| Global market size | USD 40.49B in 2024 | Large recurring market tied to machine ownership and repeat coffee purchases |
| 2030 forecast | USD 58.19B | Forecast adds USD 17.70B in incremental revenue |
| Growth rate | 6.1% to 6.2% CAGR | Healthy expansion for a category already at scale |
| U.S. market | USD 5.26B in 2024 | Large single-serve convenience and retail market |
| UK market | USD 4.50B in 2024 | Strong pod/capsule demand within a mature grocery and home coffee market |
| Sustainability signal | 71 recycling-infrastructure markets for aluminum capsule programs | Packaging design and disposal access are core market variables |
Market readout:
Coffee pods and capsules should be measured through convenience, machine ecosystem, premiumization, retail channel, and sustainability pressure rather than market size alone.
Coffee Pods Market Size and Forecast
The market-size story is straightforward at the headline level but more nuanced when interpreted for decision-making. The collected global forecast moves from USD 38.01 billion in 2023 to USD 40.49 billion in 2024, then to USD 43.01 billion in 2025. The series continues to USD 45.69 billion in 2026, USD 48.54 billion in 2027, USD 51.56 billion in 2028, USD 54.78 billion in 2029, and USD 58.19 billion in 2030. This upward path is not a short-lived spike; it reflects repeated buying behavior, premium coffee positioning, and the continued spread of single-serve brewing systems.
The forecast also shows why definitions matter. A coffee pod can mean a soft pad used in a particular brewer, while a capsule often refers to a rigid aluminum or plastic container associated with espresso-style systems. Some market sources combine pods and capsules because both serve single-portion brewing. Others separate them because materials, machine compatibility, price per serving, and sustainability profiles differ. For a business reader, the safest approach is to treat the top-line forecast as a directional market view and then analyze format, region, channel, and packaging separately.
The most important commercial signal is that value growth outpaces simple household penetration in many markets. Once a consumer owns a machine, the brand or platform has an opportunity to capture repeat sales through compatible capsules, branded assortments, and subscription replenishment. That makes the category attractive to coffee brands because recurring purchase frequency can be stronger than traditional packaged coffee if the consumer remains loyal to a machine ecosystem.
| Year | Global revenue | Meaning |
|---|---|---|
| 2023 | USD 38.01B | Baseline for recent market sizing |
| 2024 | USD 40.49B | Current benchmark for global demand |
| 2025 | USD 43.01B | Forecast enters stronger growth phase |
| 2026 | USD 45.69B | Single-serve adoption keeps expanding |
| 2027 | USD 48.54B | Value growth moves past mid-cycle |
| 2028 | USD 51.56B | Premium capsules lift revenue base |
| 2029 | USD 54.78B | Market approaches forecast peak |
| 2030 | USD 58.19B | Long-term forecast target value |
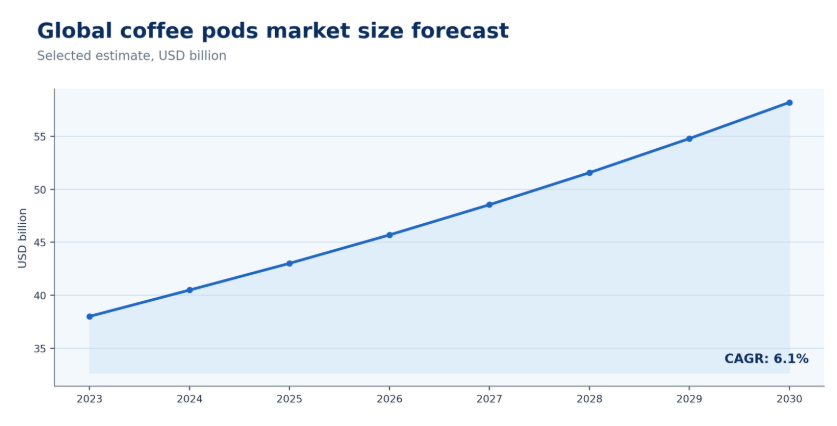
Figure 1. Coffee pods and capsules market forecasts should be read with format scope because pods, capsules, and single-serve systems are not always measured the same way.
Why Coffee Pods and Capsules Are Growing
Coffee pods and capsules are growing because they solve multiple consumer problems at the same time. They reduce preparation time, standardize taste, minimize mess, and make premium coffee easier to reproduce at home. In urban households, small kitchens and fast morning routines favor portioned brewing. In offices, single-serve systems reduce waste and simplify service. In premium retail, capsules make specialty coffee more accessible without requiring barista equipment or grinding knowledge. These forces combine into a category that is convenient, branded, and emotionally tied to the daily coffee ritual.
The growth is also reinforced by channel behavior. Supermarkets make pod multipacks visible during routine grocery trips, while online channels make replenishment easier. Subscriptions strengthen repeat purchasing by turning coffee pods into a planned household item. Private-label brands then widen access by offering lower price-per-cup options, while premium capsule lines protect value through flavor, origin, and machine-system positioning. This creates a layered market where value and volume grow for different reasons.
• Convenience remains the core demand signal because pods reduce brewing time and remove grinding, measuring, and cleanup.
• Machine ownership increases repeat demand because each compatible brewer creates a follow-on capsule or pod purchase cycle.
• Premium coffee culture supports higher capsule prices when consumers view at-home espresso as a substitute for cafe spending.
• Office and small-business coffee systems add B2B demand alongside household demand.
• E-commerce and subscriptions support replenishment behavior, multipack buying, and brand-owned customer relationships.
• Private-label pods and compatible capsules increase category reach by lowering the entry cost for consumers.
| Growth driver | Signal | Why it matters |
|---|---|---|
| Convenience | Market grows from USD 40.49B in 2024 to USD 58.19B by 2030 | Repeatable daily use supports steady growth |
| Machine ecosystem | Capsules and pods are tied to compatible brewers | Hardware ownership can lock in follow-on purchases |
| Premiumization | Long-horizon benchmarks reach above USD 60B | Premium capsules lift value per serving |
| E-commerce | Subscription and direct-to-consumer replenishment are core channel themes | Online buying reduces friction for repeat orders |
| Workplace use | Cafes, offices, and hospitality appear in channel data | Commercial routines add recurring demand outside the home |
Consumer readout:
The strongest growth is not only about coffee consumption; it is about repeatable, machine-linked, high-frequency convenience.
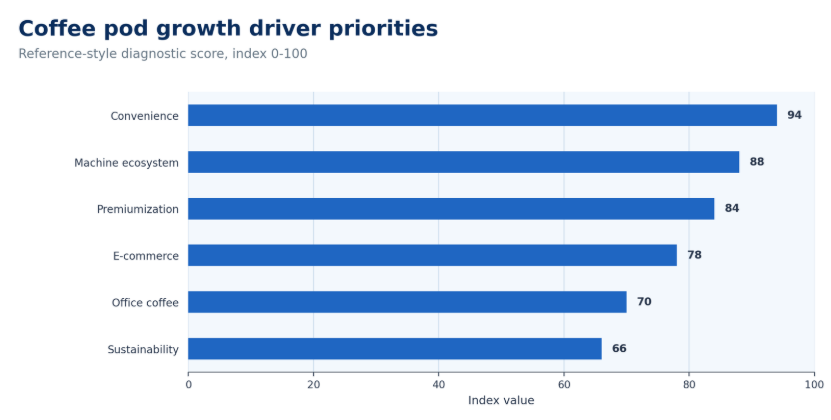
Figure 2. Coffee pod growth drivers should be viewed by convenience, machine ecosystem, premiumization, and replenishment behavior rather than by consumption alone.
Coffee Capsules vs Coffee Pods Statistics
Pods and capsules are often discussed together, but the market logic is different. Capsules are usually sealed rigid or semi-rigid units designed for specific systems, while pods can include soft filter-paper or pad-style products. Capsules tend to carry stronger premium perception, clearer machine-system economics, and more intense sustainability scrutiny because aluminum and plastic are more visible to consumers. Pods can appear more flexible and sometimes more compostable, but they do not always deliver the same espresso-style positioning.
This difference matters because the same revenue number can mean different strategic decisions. A capsule-focused business must track machine compatibility, branded ecosystems, aluminum recovery, and high-value flavor launches. A pod-focused business may focus more on grocery penetration, compostable materials, filter-paper formats, and broad single-serve convenience. The combined market grows when both formats make home coffee easier, but segmentation determines packaging cost, shelf placement, and consumer willingness to pay.
| Format | Role | Growth signal |
|---|---|---|
| Capsules | Premium single-serve and espresso-style brewing | Strong machine ecosystem linkage |
| Soft pods | Convenient portioned brewing | Can support compostable or paper-based positioning |
| Compatible capsules | Alternative to branded machine ecosystems | Private-label and third-party expansion |
| Compostable pods | Sustainability-oriented format | Growing interest around disposal and material claims |
| Refillable capsules | Reusable alternative | Niche but visible among eco-conscious users |
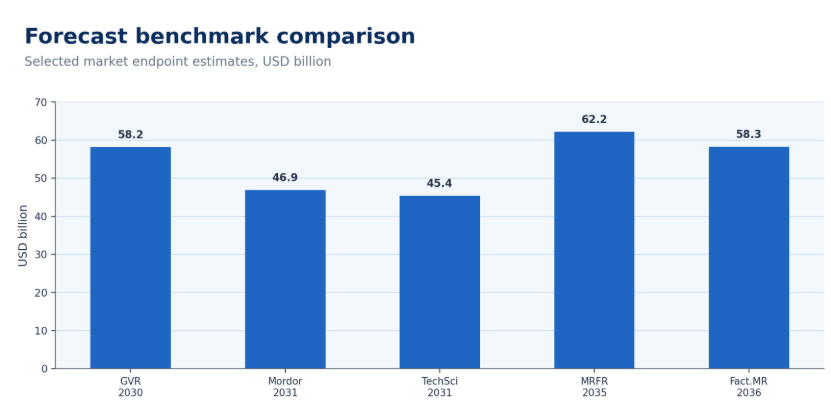
Figure 3. Forecast benchmarks should be compared by scope because pod-only, capsule-combined, and longer-horizon estimates do not measure identical markets.
Regional Coffee Pods and Capsules Market Statistics
Regional market statistics show why coffee pods and capsules cannot be treated as one global behavior. North America is shaped by single-serve convenience, mass retail, office systems, and large household penetration. Europe is shaped by coffee culture, machine ecosystems, capsule formats, and stronger packaging regulation. Asia-Pacific is shaped by urbanization, premium coffee adoption, and rising interest in cafe-style beverages at home. Latin America, the Middle East, and Africa remain more uneven but are important because coffee culture, foodservice, and premium retail are developing in different ways.
- The country-level revenue data in the workbook gives the clearest view of where value concentrates. The United States reached USD 5,264.1 million in coffee pods revenue in 2024 and is projected to reach USD 7,618.7 million by 2030.
- The United Kingdom reached USD 4,499.9 million in 2024 and is projected at USD 6,465.5 million by 2030.
- France, Germany, Italy, Spain, China, Japan, Canada, Brazil, and Australia also appear as important markets because each combines coffee consumption with either retail access, premium culture, or machine adoption.
| Region | Latest signal | Growth |
|---|---|---|
| North America | United States at USD 5.26B in 2024 | Mature but expanding |
| Europe | UK at USD 4.50B in 2024; France, Italy, Spain, Germany important | High adoption and regulation-sensitive |
| Asia-Pacific | China and Japan included in country-level data | Premium adoption and urban growth |
| Latin America | Brazil included as a key market | Coffee culture with developing capsule adoption |
| Middle East and Africa | Regional indicators included in workbook | Premium retail and hospitality-led opportunity |
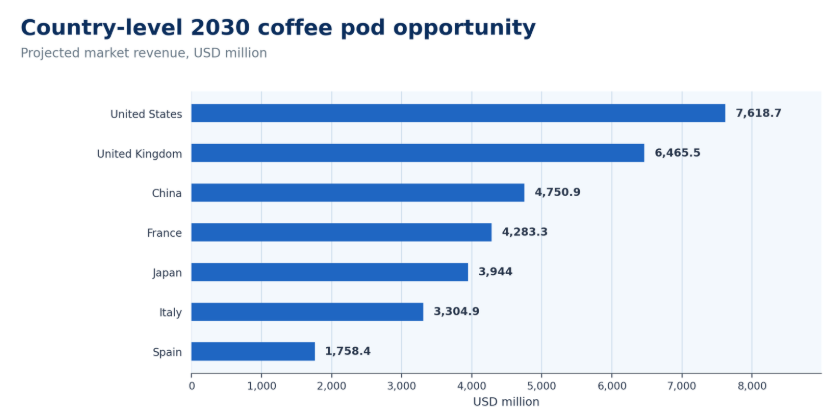
Figure 4. Country-level 2030 opportunity should be read by market size, machine ecosystem, and repeat-purchase potential rather than by population alone.
Country-Level Coffee Pods and Capsules Market Statistics
Country-level statistics are essential because coffee culture, machine ownership, grocery structure, and capsule regulation vary sharply. The United States leads the country table in the collected revenue set, but it is not the only strategic market. The United Kingdom is large relative to population because of strong retail and at-home coffee demand. France, Italy, Spain, Portugal, and the Netherlands matter because European pod adoption has meaningful volume and value share signals. Germany, Canada, Japan, China, Brazil, and Australia add different opportunity profiles tied to premium coffee, convenience, and retail access.
The practical use of the country table is not to rank countries once and stop. The goal is to identify which countries need different strategy. In the U.S., convenience and retail visibility are central. In the UK, supermarket and online replenishment matter. In France and Italy, capsule culture and espresso-style consumption are more important. In China and Japan, premium coffee behavior and urban convenience may matter more than legacy pod penetration. In Brazil, the market opportunity is supported by coffee culture but depends on machine affordability and capsule distribution.
| Country | 2024 revenue | 2030 forecast | CAGR |
|---|---|---|---|
| United States | USD 5,264.1M | USD 7,618.7M | 6.2% |
| United Kingdom | USD 4,499.9M | USD 6,465.5M | 6.2% |
| Middle East & Africa | USD 4,059.8M | — | 4.9% |
| China | USD 3,141.2M | USD 4,750.9M | 7.1% |
| France | USD 3,020.2M | USD 4,283.3M | 5.9% |
| Germany | USD 2,711.4M | — | — |
| Japan | USD 2,662.5M | USD 3,944.0M | 6.7% |
| Italy | USD 2,386.4M | USD 3,304.9M | 5.4% |
| Spain | USD 1,255.2M | USD 1,758.4M | 5.7% |
| Canada | USD 995.9M | — | — |
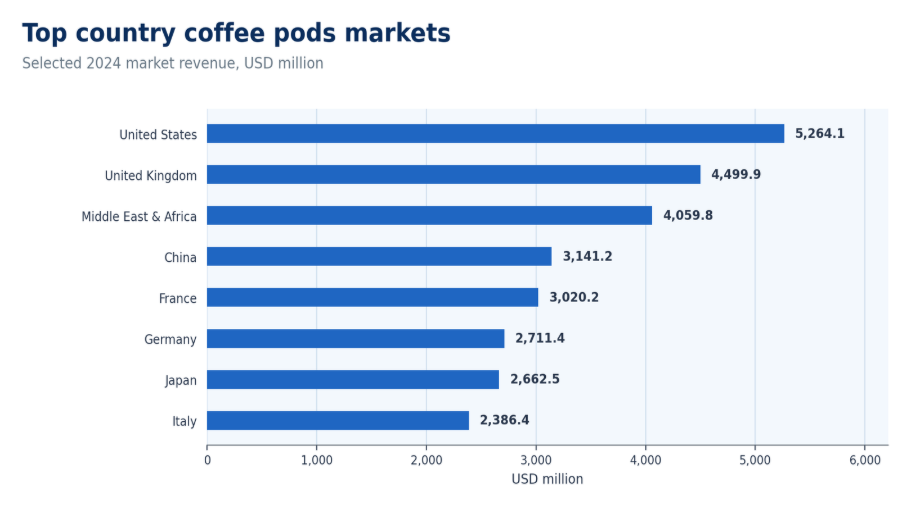
Figure 5. Country-level coffee pod opportunity should be ranked by revenue, adoption maturity, retail access, and machine compatibility.
Europe Coffee Pod Adoption Statistics
Europe deserves its own reading because capsule and pod adoption is more visible in many national coffee routines. The European coffee market is not uniform: Italy and France bring strong espresso traditions, the Netherlands and Portugal show meaningful capsule adoption signals, and Spain, Belgium, and Austria have distinct retail and household behaviors. The best way to read European statistics is to separate volume share from value share. A country can show a moderate volume share but higher value share if capsule formats command a premium price.
This is also where sustainability becomes more immediate. European packaging rules, recycling access, and consumer expectations push brands to prove that convenience does not automatically mean waste. Aluminum capsule systems can support recycling programs, but only when infrastructure and consumer behavior align. Compostable pods can answer a different concern, but they still require proper disposal systems and clear instructions. Therefore, the strongest European strategies combine coffee quality, machine compatibility, and credible packaging claims.
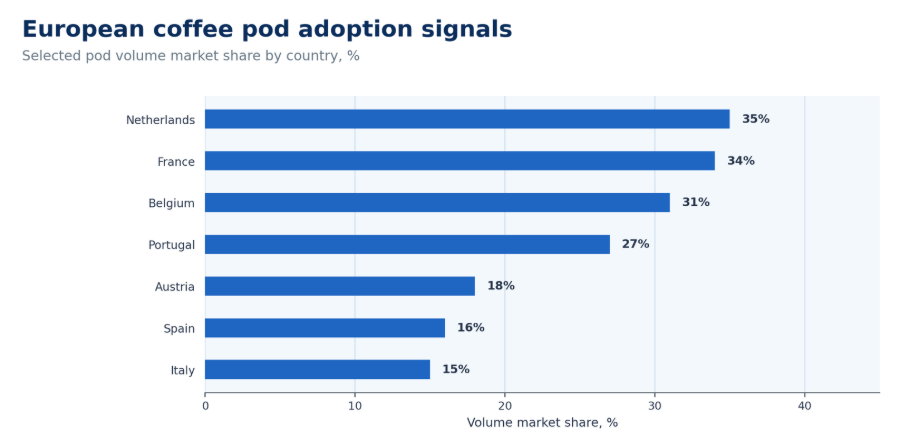
Figure 6. European pod adoption should be read through both volume and value because capsule premiumization changes market weight.
Consumer Behaviour and Usage Statistics
Consumer behaviour is the reason the category sustains repeated revenue. A coffee pod is not a one-time product; it is a unit of routine. Once a consumer builds a morning ritual around a specific brewer, the next purchase becomes easier. The consumer does not compare every bag of coffee each week. Instead, the consumer replenishes compatible pods, chooses flavors, compares price per cup, and may subscribe for convenience. That shift from product discovery to repeat replenishment is one of the market’s strongest economic characteristics.
Usage also varies by occasion. At-home consumption is about speed, consistency, and affordable cafe-style taste. Office consumption is about reducing mess and keeping a predictable coffee supply. Hospitality use is about portion control and simple service. Premium capsule consumers may pay more for origin, intensity, roast style, or branded assortments, while value buyers may move toward private-label compatible pods. These behaviors explain why the market can support both premium and affordable segments at the same time.
• Daily routines create repeat purchase frequency, especially when a household uses the same machine every morning.
• Office systems add predictable commercial consumption because pods simplify stock control and reduce waste.
• Subscription buying converts coffee pods into a planned replenishment item rather than an occasional grocery purchase.
• Flavor variety supports higher basket value because consumers can rotate espresso, lungo, decaf, flavored, and specialty options.
• Private-label pods appeal to price-sensitive consumers while preserving the convenience of machine-based brewing.
| Consumer behavior | Signal | Meaning |
|---|---|---|
| Routine brewing | Market expands steadily through 2030 | Daily use converts convenience into recurring demand |
| Machine ownership | Capsules and pods depend on compatible systems | Brewer installed base is a demand anchor |
| Subscription replenishment | Online and DTC channels are central to the category | Repeat orders reduce purchase friction |
| Premium taste | Longer forecasts exceed USD 60B in some benchmarks | Value grows when consumers trade up |
| Sustainability concern | Recycling and compostability are recurring issues | Consumers need clear disposal options |
Usage readout:
Pod demand increases when coffee becomes a routine product tied to speed, consistency, and machine ownership.
Retail, E-Commerce, and Subscription Channel Statistics
Channel mix matters because coffee pods are replenishment products. A consumer may discover a machine through retail, buy capsules in a supermarket, reorder online, and then migrate into a subscription program. Each channel captures a different stage of the consumer relationship. Grocery stores provide visibility and multipack value. E-commerce provides depth of assortment and convenience. Brand-owned subscription programs provide data, loyalty, and predictable demand. Office and B2B channels add larger-volume recurring accounts.
The channel story also explains why competitive dynamics are intense. Brands compete not only on taste but also on shelf placement, compatible systems, bundle pricing, and subscription incentives. Private-label products can take share in supermarkets when shoppers compare price per cup, while premium brands can defend value by offering flavor range, origin stories, machine integration, and limited-edition products. That makes the channel a strategic lever rather than a simple route to market.
| Channel | Role | Why it matters |
|---|---|---|
| Supermarkets / hypermarkets | High-visibility multipack sales | Important for routine replenishment and private-label competition |
| E-commerce marketplaces | Wide assortment and easy comparison | Supports compatible pods, reviews, and value packs |
| Brand-owned subscriptions | Repeat customer relationship | Improves retention and forecastable demand |
| Office / B2B supply | Commercial recurring use | Adds predictable demand outside households |
| Hospitality and cafes | Selective professional use | Useful where portion control and service consistency matter |
Channel readout:
Coffee pod sales should be separated by grocery, e-commerce, subscription, and office demand because each channel captures a different repeat-purchase behavior.
Sustainability, Recycling, and Regulation Statistics
Sustainability is the largest long-term pressure point in coffee pods and capsules. The category grew because it made coffee easier, but the same single-serve convenience raises questions about plastic, aluminium, compostability, recyclability, and consumer disposal behavior. The collected workbook includes several important sustainability signals: Nespresso recycling infrastructure was identified across 71 markets, one U.S. Nespresso OriginalLine recycling bag can hold 200 capsules, one VertuoLine bag can hold 100 capsules, and a USD 1.5 million SEC fine linked to Keurig pod recyclability disclosures shows that environmental claims can carry legal and reputational risk.
The market implication is simple: convenience must be matched with credible end-of-life design. Aluminum capsules may be recyclable, but recycling depends on collection systems and consumer participation. Plastic pods may be technically recyclable in some places, but claims can fail if the typical municipal system does not accept them. Compostable pods can help, but composting infrastructure and consumer instruction matter. Brands that make sustainability easy to understand will have an advantage over brands that rely on vague packaging language.
| Sustainability issue | Signal | Meaning |
|---|---|---|
| Recycling infrastructure | 71 markets equipped with aluminium capsule recycling infrastructure | Infrastructure can support trust when consumers know how to use it |
| Capsule collection | OriginalLine bag capacity of 200 capsules | Return systems can make recycling visible and practical |
| VertuoLine collection | VertuoLine bag capacity of 100 capsules | Different formats require different collection design |
| Claims risk | USD 1.5M fine tied to recyclability disclosures | Packaging claims must match real-world disposal access |
| Compostable pods | Growing product positioning theme | Needs clear composting instructions and accepted facilities |
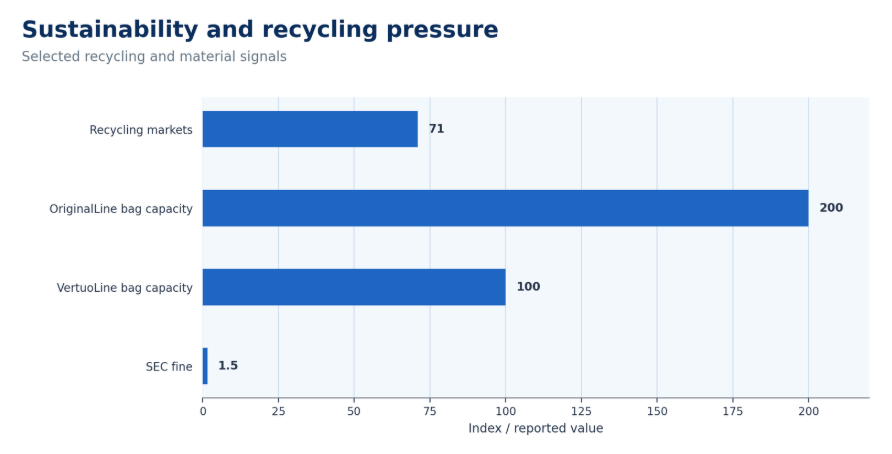
Figure 7. Sustainability pressure should be measured through recycling access, material design, and claim risk rather than packaging language alone.
Competitive Landscape and Brand Statistics
Competition in coffee pods and capsules is shaped by four forces: machine systems, retail shelf access, capsule compatibility, and brand trust. A strong machine ecosystem can create recurring demand, but compatible products and private-label alternatives can weaken exclusivity. Premium brands defend margin through roast quality, capsule technology, packaging, and flavor storytelling. Retailers compete through multipack value and private-label pricing. Smaller brands often compete through sustainability, specialty coffee credentials, or compatibility with popular machines.
This makes the category different from ordinary packaged coffee. The consumer is not only choosing taste; the consumer is also choosing whether a pod works in the machine, whether the price per serving feels acceptable, whether the format is easy to recycle, and whether the brand fits a daily routine. The strongest competitors therefore connect product, machine, channel, and packaging into one repeatable experience.
| Competitive area | Signal | Meaning |
|---|---|---|
| Machine ecosystems | Capsules and pods are system-linked | Installed brewers create recurring follow-on demand |
| Compatible capsules | Private-label and third-party options expand choice | Compatibility creates price competition |
| Premium brands | Long-horizon forecasts show value expansion | Quality, origin, and flavor defend margin |
| Retailer brands | Grocery replenishment is a key channel | Private label can win on price per cup |
| Sustainability challengers | Compostable and recyclable claims are visible | Packaging can become a differentiation point |
Competition readout:
The market is shaped by machine ecosystems, capsule compatibility, retail shelf access, and recurring purchase behavior.
Price, Premiumization, and Product Innovation Statistics
Coffee pods and capsules generate value because they sell coffee in controlled servings. The price per serving can be higher than ground coffee, but consumers often compare the cup to cafe coffee rather than to bulk coffee beans. That framing supports premiumization. Espresso-style capsules, single-origin capsules, organic pods, decaf ranges, flavored assortments, and limited-edition products all create ways to increase value without requiring a large change in daily consumption volume.
Innovation is also moving toward material and format. Compostable pods, recyclable aluminium, paper-based solutions, refillable capsules, and lower-waste packaging all respond to environmental concerns. At the same time, product teams are experimenting with cold brew, functional coffee, stronger intensity ranges, and milk-compatible drinks. The best innovation strategy links product taste to machine compatibility and channel execution. A new flavor matters more if it can be discovered on shelf, repeated online, and positioned as part of a routine.
| Product trend | Signal | Meaning |
|---|---|---|
| Premium espresso capsules | Forecasts show continued value growth | Premium formats can lift revenue per cup |
| Private-label compatible pods | Retail competition is a major market force | Lower prices can expand household penetration |
| Decaffeinated pods | Marked as a fast-growing segment in several country rows | Health and evening-use occasions support growth |
| Compostable formats | Sustainability concern is a core article theme | Waste reduction can improve trust |
| Subscription packs | Repeat buying aligns with pod consumption | Bundles and recurring orders strengthen retention |
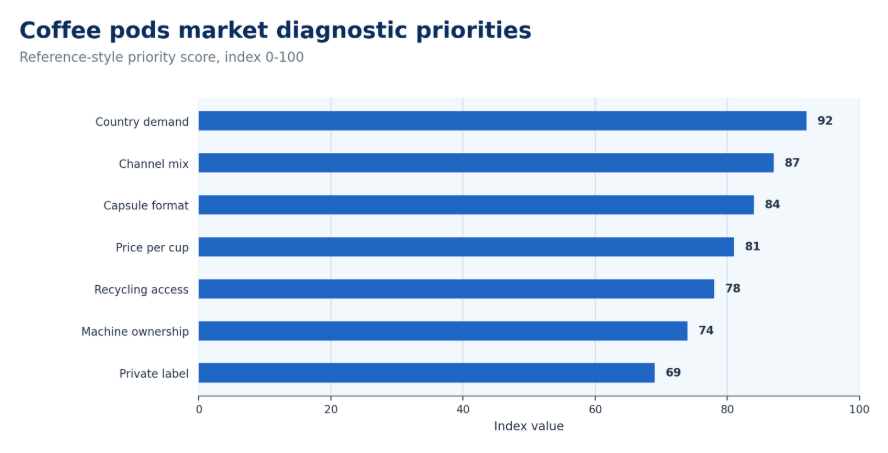
Figure 8. Coffee pods market diagnostics should connect country demand, channel mix, capsule format, price per cup, and recycling access.
90-Day Coffee Pods Market Research Plan
A 90-day research plan turns the statistics into action. The first step is to normalize definitions so the team knows whether each source measures pods, capsules, single-serve systems, machine revenue, or retail coffee. The second step is to map regions and countries separately because the U.S., UK, France, Italy, Germany, China, Japan, Brazil, and Australia do not behave the same way. The third step is to connect consumer behavior, channel mix, and sustainability risk. A company that skips these steps may overestimate demand in one country and underestimate packaging risk in another.
| Timing | Review focus | Output |
|---|---|---|
| Days 1-15 | Compare market-size definitions and forecast endpoints | Clean benchmark range and scope notes |
| Days 16-30 | Map regional and country revenue signals | Priority country list and revenue ranking |
| Days 31-45 | Review pods vs capsules and compatible systems | Format opportunity map |
| Days 46-60 | Analyze grocery, e-commerce, subscription, and office channels | Channel strategy matrix |
| Days 61-75 | Assess recycling, compostability, and packaging claims | Sustainability risk register |
| Days 76-90 | Benchmark competitors, private label, and price per cup | Positioning and pricing plan |
Planning readout:
The best coffee pod research plan moves from market scope to country opportunity, channel behavior, packaging risk, and competitive positioning.
Metrics Coffee Pod Leaders Should Track
For coffee pods and capsules, the most useful metrics go beyond total market revenue. Leaders should track machine installed base, capsule compatibility, average price per cup, subscription retention, channel reorder frequency, private-label share, recycling participation, and country-level premiumization. These metrics explain why two markets with similar coffee consumption can produce very different capsule revenue. A mature coffee culture does not automatically create a pod market unless consumers also have machines, retail access, and a reason to keep buying compatible products.
The first metric is recurring demand, because pods and capsules are not a one-off purchase. The second is format profitability, because aluminium capsules, plastic capsules, paper pods, and compostable pods have different cost structures. The third is channel quality, because a sale through a subscription program has different customer value than a one-time supermarket purchase. The fourth is packaging risk, because recycling access and claims can affect retailer approval, consumer trust, and regulatory scrutiny. When these indicators are combined, the market becomes easier to read and less dependent on a single top-line forecast.
| Metric | Why it matters | Use |
|---|---|---|
| Machine installed base | Creates the recurring demand pool | Estimate compatible pod replenishment potential |
| Price per cup | Shows premium or value positioning | Compare branded capsules, compatible products, and private labels |
| Subscription retention | Measures repeat demand quality | Identify whether online demand is loyal or promotional |
| Private-label share | Signals price pressure | Track margin risk in supermarket channels |
| Recycling access | Measures sustainability readiness | Match packaging claims to real consumer disposal options |
| Country adoption gap | Separates coffee culture from pod penetration | Prioritize markets where machine ownership and retail access are improving |
Metrics readout:
Coffee pod opportunity is strongest when market size, installed machines, repeat purchase channels, price per cup, and recycling access move in the same direction.
Country Strategy Notes for Coffee Pods and Capsules
Country strategy should not simply copy the global story. The United States offers scale because single-serve systems already fit large grocery, club, office, and e-commerce channels. The United Kingdom offers a different type of strength: strong grocery behavior, online replenishment, and high familiarity with home coffee formats. France, Italy, Spain, Portugal, and the Netherlands require a more capsule-aware strategy because coffee culture and espresso habits influence how consumers judge taste, intensity, and authenticity. Germany and Canada add steady value markets, while China and Japan should be read through urban premiumization and changing home coffee routines.
For emerging or developing markets, the key question is affordability. Premium capsules may signal aspiration, but machine cost and pod price can slow penetration. Retailers can overcome part of this barrier through compatible capsules, private-label packs, smaller trial packs, and seasonal bundles. In markets with strong coffee culture but lower capsule penetration, education and machine availability matter. In markets with high disposable income but less entrenched home brewing, premium positioning and lifestyle branding may matter more than price alone.
| Country group | Best market angle | Planning note |
|---|---|---|
| United States and Canada | Convenience, office use, retail scale | Prioritize multipacks, subscriptions, and compatible formats |
| United Kingdom | Grocery replenishment and online buying | Balance premium capsules with value packs |
| France and Italy | Capsule culture and espresso expectations | Compete on intensity, quality, and machine compatibility |
| Germany and Netherlands | Practical value plus sustainability awareness | Use recyclable or lower-waste claims carefully |
| China and Japan | Premium urban coffee routines | Focus on cafe-style quality and compact home brewing |
| Brazil and Latin America | Coffee culture with adoption headroom | Use affordability, machine access, and retail education |
Packaging, Margin, and Regulatory Risk
Packaging is not only an environmental topic; it is also a margin and market-access issue. Aluminium can support premium positioning and recycling programs, but it often requires more structured collection. Plastic can be lower cost but faces stronger scrutiny when recyclability is unclear. Compostable and paper-based pods can create a sustainability story, but they must perform well in the brewer and match available disposal systems. Refillable capsules reduce waste but may shift consumers away from branded replenishment. Each material choice therefore affects cost, customer perception, retailer acceptance, and long-term retention.
Regulation makes this even more important. A brand can lose trust if claims such as recyclable, compostable, or sustainable are not supported by local infrastructure. Retailers also prefer packaging that is easy to explain to consumers, especially in countries where extended producer responsibility rules and packaging reporting are becoming more visible. The best-performing brands will likely treat sustainability as a design system, not a marketing sentence. That means pack structure, collection instructions, material proof, and consumer education should all be aligned before a sustainability claim is scaled.
| Risk area | Signal | Management note |
|---|---|---|
| Aluminium recovery | Recycling programs exist in many markets | Make collection simple and visible |
| Plastic recyclability | Claims can be challenged if local systems do not accept pods | Avoid broad claims without infrastructure support |
| Compostability | Attractive to eco-conscious buyers | Clarify home vs industrial composting requirements |
| Material cost | Premium packaging can lift cost per capsule | Balance price per cup with quality positioning |
| Retailer scrutiny | Packaging claims influence shelf approval | Provide clear disposal instructions and proof points |
Risk readout:
The category’s long-term growth depends on keeping the convenience promise while reducing confusion around capsule waste, recycling, and disposal.
Coffee Pods Data Storytelling Flow
Coffee pod statistics work best when they move from market scale to market behavior. The category starts with a global benchmark of USD 40.49 billion in 2024 and a forecast path toward USD 58.19 billion by 2030, but those figures only become useful when connected to machine ownership, capsule compatibility, channel access, and sustainability expectations.
The strongest market story is sequential: first the reader sees the total market, then the forecast, then the reason capsules and pods keep gaining share, then the regional and country differences that explain where the next opportunity sits. This keeps the article data-rich without turning it into a raw statistical appendix.
For market interpretation, each statistic should support one business question: how large the market is, how fast it is growing, which countries are adopting faster, which channels capture repeat purchases, and where packaging or regulation could pressure margins.
| Story layer | Market signal | Business readout |
|---|---|---|
| Market scale | USD 40.49 billion in 2024 | Shows the current revenue base for pod and capsule demand. |
| Forecast path | USD 58.19 billion by 2030 | Frames future value growth and supports category planning. |
| Adoption gap | Country shares vary by machine ownership | Explains why Europe, the U.S., and APAC do not move alike. |
| Channel logic | Retail, e-commerce, and subscriptions drive repeat use | Connects pod demand to household replenishment behavior. |
| Risk layer | Recycling, packaging, and compatibility remain constraints | Keeps the growth story balanced with operating risk. |
Storytelling readout
Coffee pod statistics are strongest when each number explains scale, growth, adoption, channel behaviour, or risk instead of appearing as a standalone datapoint.
How to Read Coffee Pods and Capsules Market Statistics Correctly
Coffee pods and capsules statistics can be misleading if the market scope is not checked first. Some values refer only to pods. Others combine pods and capsules. Some include single-serve coffee products but exclude machines, while machine-market reports measure the hardware that creates pod demand. A reference-style article should avoid mixing those categories without explanation. The better method is to use the global forecast for direction, then separate format, channel, country, and sustainability signals.
Revenue and volume also tell different stories. A country with high capsule value share may not have the highest number of cups if premium capsules carry a higher price. A country with strong grocery share may be more price-sensitive than a country with strong subscription penetration. A recycling claim may be technically true but commercially weak if consumers cannot easily return or process the material. Therefore, market statistics should be interpreted through real consumer behavior and operational constraints.
| Reading issue | Why it matters | Better read |
|---|---|---|
| Pods vs capsules | Different materials, machines, and price points | Compare format-level demand separately |
| Revenue vs volume | Premium capsules can lift value without matching unit volume | Use both where available |
| Machine vs capsule revenue | Hardware and consumables are different markets | Track brewer installed base as a demand driver |
| Country comparison | Coffee culture and retail structure vary | Rank countries by adoption logic, not only revenue |
| Recycling claims | Claims depend on infrastructure and consumer action | Assess real collection access and instructions |
Coffee Pods and Capsules Market Statistics FAQ
How big is the coffee pods and capsules market?
The collected global coffee pods benchmark places the market at USD 40.49 billion in 2024 and projects it to reach USD 58.19 billion by 2030. Broader pods-and-capsules benchmarks vary by source scope, with some estimates placing the combined market near USD 32.62 billion in 2025 and USD 46.91 billion by 2031.
What is the growth rate of the coffee pods market?
The main global forecast indicates growth around 6.1% to 6.2% CAGR through 2030. Other benchmarks in the workbook range higher or lower depending on whether they measure pods, capsules, or the wider single-serve coffee category.
Which country leads the coffee pods market?
The United States is the largest individual country in the collected country table, with USD 5,264.1 million in 2024 revenue and a 2030 forecast above USD 7.6 billion. The United Kingdom is also a major market, with USD 4,499.9 million in 2024.
Why are coffee pods and capsules popular?
They are popular because they reduce brewing time, make taste more consistent, simplify cleanup, and connect consumers to a machine-based routine. They also make premium espresso-style coffee more accessible at home.
What is the biggest challenge for coffee pods and capsules?
The biggest long-term challenge is sustainability. Consumers, regulators, and retailers increasingly expect clear recycling, compostability, or waste-reduction solutions. Packaging claims must be credible and easy to act on.
Are pods or capsules growing faster?
The answer depends on market definition. Capsules often carry stronger premium and machine-system economics, while pods can support compostable or paper-based formats. The best analysis separates the two rather than treating all single-serve products as identical.
How do subscriptions affect coffee pod sales?
Subscriptions turn pods into a recurring replenishment product. They reduce friction, improve retention, and let brands manage direct consumer relationships beyond supermarket shelves.
What should companies track in this market?
Companies should track country revenue, machine ownership, format compatibility, price per cup, channel mix, subscription retention, private-label pressure, and recycling access. These signals explain the market better than top-line size alone.
Final Takeaway
Coffee pods and capsules are no longer a small convenience niche. They are a global recurring-consumption market built around machines, formats, retail availability, premium taste, and consumer routines. The strongest global benchmark shows USD 40.49 billion in 2024 revenue and a projected USD 58.19 billion by 2030. That growth is meaningful because pods and capsules are bought repeatedly, often by consumers who have already committed to a compatible brewing system.
The country data shows that opportunity is not evenly distributed. The United States and United Kingdom are major revenue markets, while Europe remains important because of capsule adoption and packaging regulation. Asia-Pacific markets add growth potential through urbanization and premium coffee habits. Sustainability is the pressure point that can shape the next phase of competition: brands that combine convenience with credible recycling, compostability, or lower-waste packaging will be better positioned than brands that rely only on flavor variety or machine lock-in.
The practical conclusion is that coffee pod strategy should connect market size, country demand, machine ecosystem, retail channel, price per cup, and disposal reality. The companies that win will not simply sell more capsules; they will build repeatable coffee routines that feel convenient, premium, affordable, and responsible.