Food packaging is no longer only a container-cost category. It has become a strategic market system shaped by shelf life, food safety, ecommerce durability, sustainability targets, PFAS scrutiny, recycling infrastructure, material substitution, and country-level regulation. That makes food packaging a market system, not just a wrapper around a product.
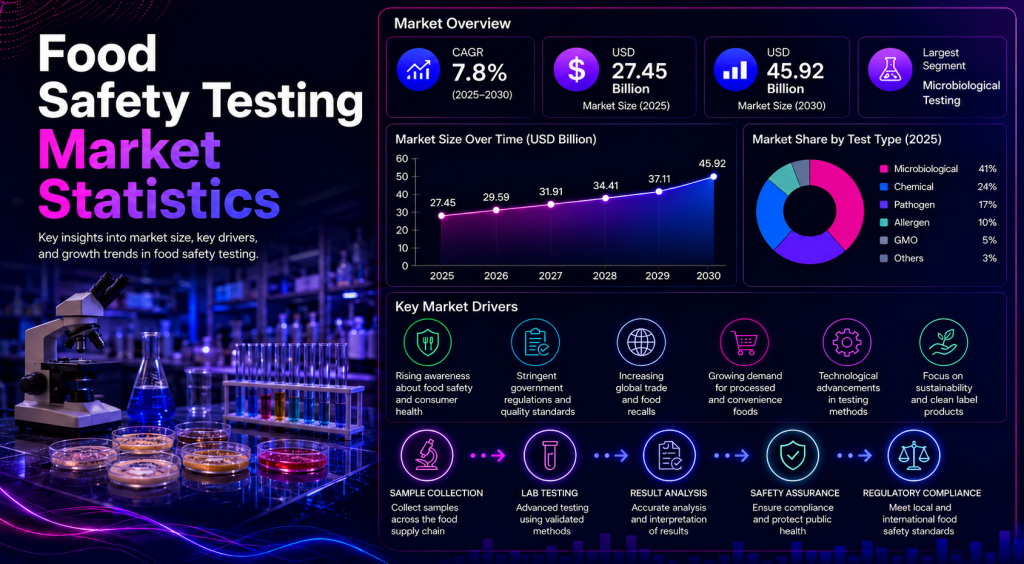
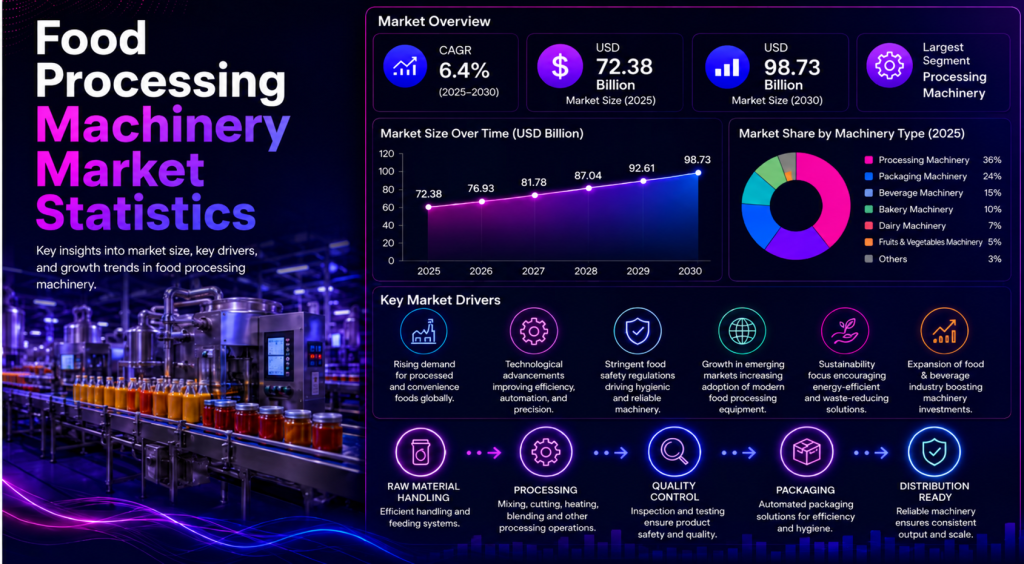
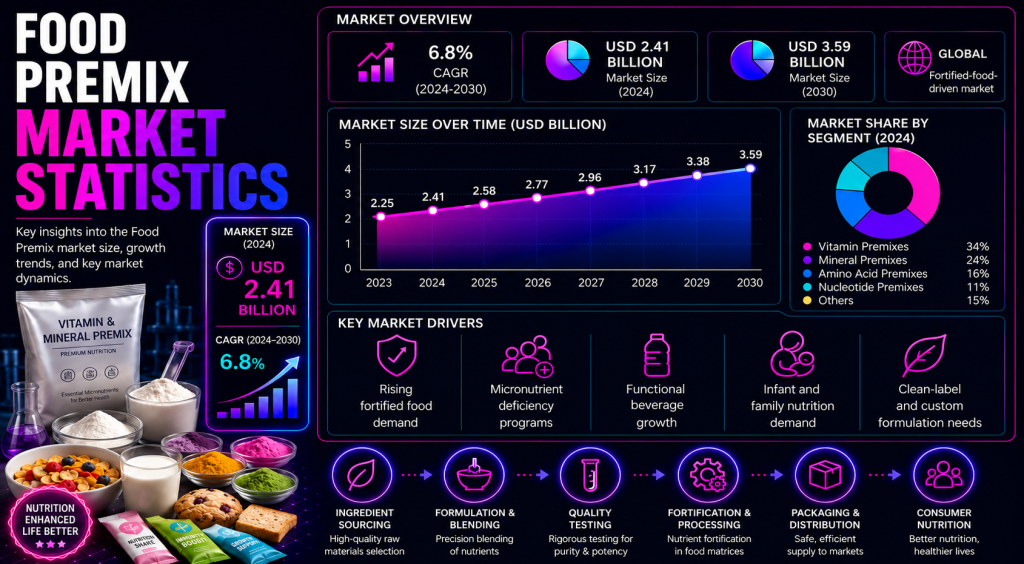
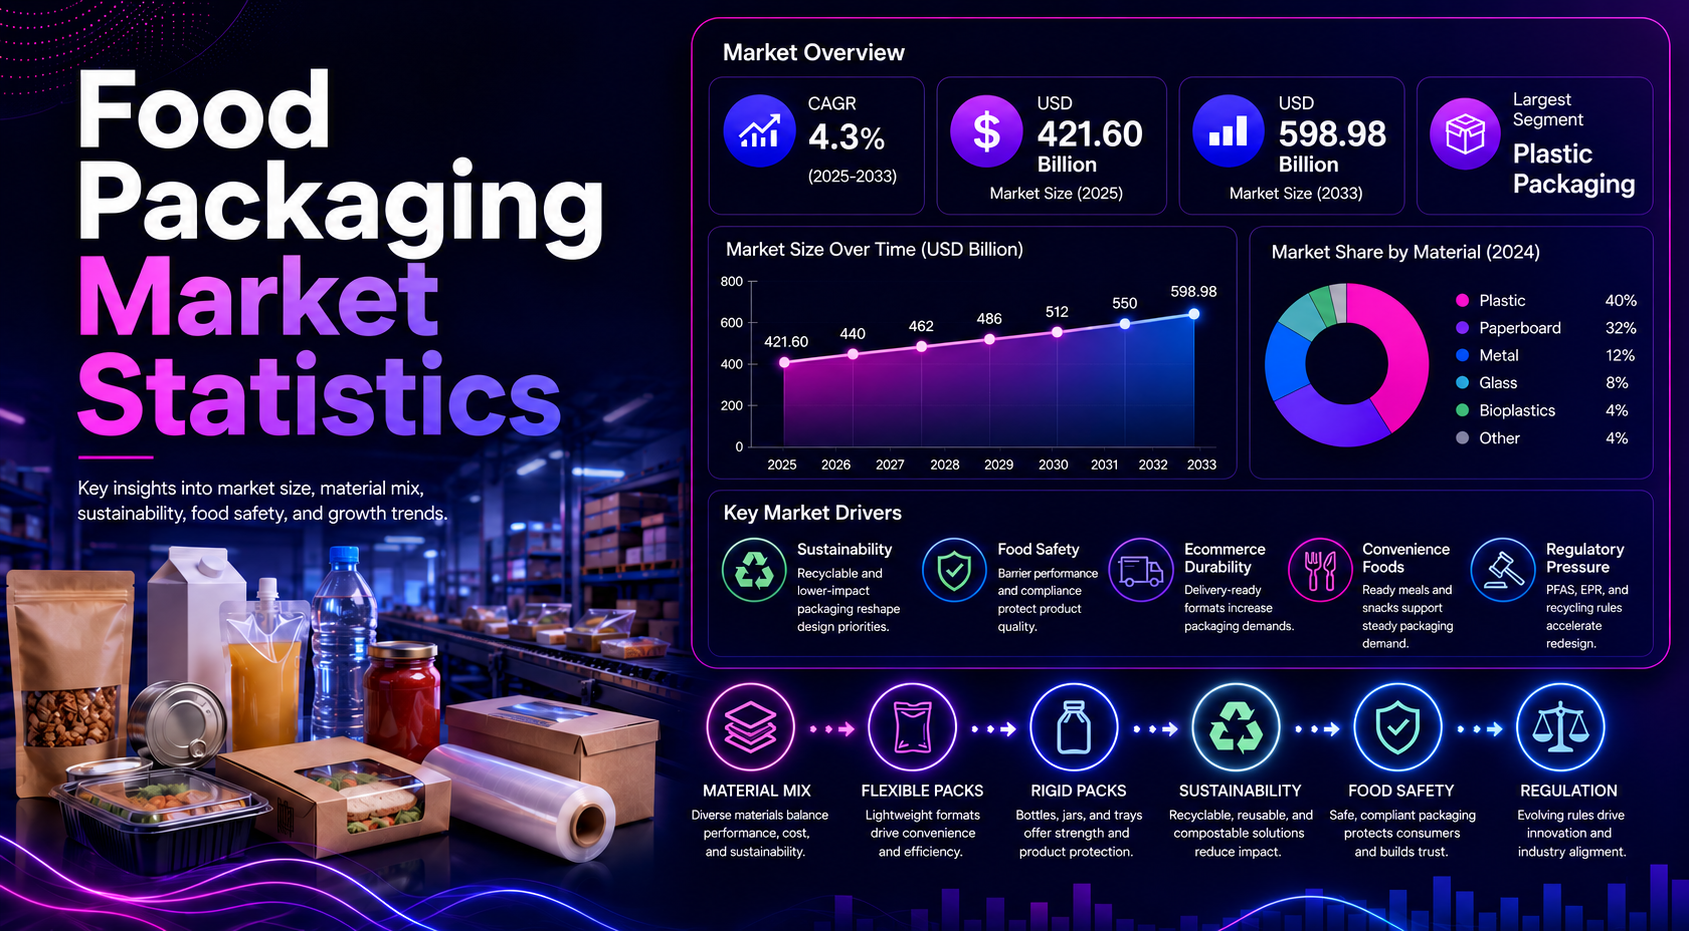
The strongest statistics show why packaging deserves its own scorecard. Global food packaging is estimated at USD 421.60 billion in 2025, with one forecast pointing to USD 598.98 billion by 2033. Broader market definitions place the 2025 opportunity above USD 533 billion and the 2034 outlook near USD 930.89 billion. At the same time, eco-friendly packaging, foodservice formats, flexible structures, next-generation materials, and regional compliance rules are changing how brands evaluate every pack.
The strongest view separates market scale from operating readiness. Market value shows where investment is moving, while material mix, shelf-life performance, channel pressure, sustainability claims, and regulation show where packaging decisions become expensive, risky, or difficult to execute.
Executive Food Packaging Benchmarks
These benchmarks frame the market at a glance: demand scale, forecast growth, material pressure, and execution risk linked to sustainability and regulation.
The numbers that define the food packaging market
• Global food packaging market size is estimated at USD 421.60B in 2025, showing that packaging is a major investment category across food, retail, logistics, and foodservice supply chains.
• The market is forecast to reach USD 598.98B by 2033, which points to steady long-term demand from packaged food, ecommerce grocery, retail modernization, and foodservice formats.
• A broader market estimate places food packaging at USD 533.22B in 2025, highlighting how market totals change when wider foodservice, industrial, and logistics packaging definitions are included.
• One broader outlook projects the market at USD 930.89B by 2034, showing the upside potential created by sustainable redesign, advanced materials, and expanding packaged food systems.
•Sustainability pressure, PFAS scrutiny, ecommerce durability, and shelf-life protection are now shaping packaging value beyond basic unit volume.
•Brands must balance packaging cost, food-contact compliance, product protection, retailer requirements, and realistic end-of-life pathways before scaling a new format.
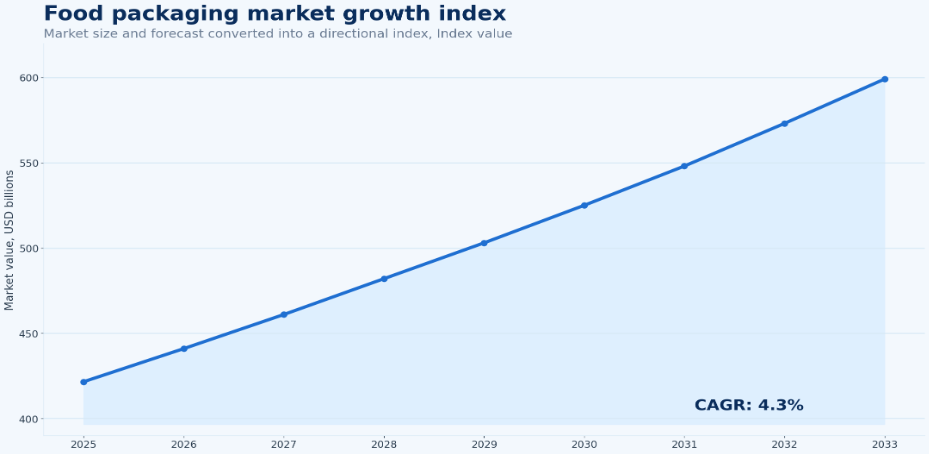
Figure 1. Global food packaging market size and forecast show how packaging demand is tied to food distribution, shelf life, and sustainability investment.
Editorial readout:
Food packaging value is moving through five pressure points: performance, demand, durability, sustainability, and compliance.
Why Food Packaging Carries Global Market Scale
Food packaging carries global market scale because it sits between food production, retail logistics, shelf-life protection, consumer trust, and regulatory compliance. Every packaged food category needs a structure that protects the product, communicates information, supports transport, and meets the requirements of the channel where it is sold. A ready meal, a frozen pizza, a dairy cup, a sauce pouch, and a snack bag each require different performance from the package, even when they all compete for the same shelf space or delivery basket.
The category also creates value because it reduces friction across the food system. It helps food manufacturers portion products, retailers reduce handling losses, foodservice operators manage portability, and consumers store or consume food safely. The same package can function as a safety layer, branding surface, compliance document, logistics tool, and sustainability claim. That multi-function role explains why packaging statistics need to be read beyond basic material volume.
| Scale driver | What it shows | Business implication |
|---|---|---|
| Packaged food volume | More food sold through retail and convenience channels | Sustains base demand for containers, films, cartons, and closures |
| Foodservice demand | More meals require portable and disposable formats | Raises demand for trays, cups, clamshells, wraps, and insulated packs |
| Shelf-life protection | More products need barrier and sealing performance | Links packaging to waste reduction and food safety |
| Ecommerce grocery | More delivery creates leak, damage, and temperature risk | Pushes packaging toward stronger secondary protection |
| Sustainability pressure | More brands and regulators require circularity claims | Forces redesign of materials, labels, and end-of-life pathways |
Editorial readout:
Food packaging protects food value first. Lower pack cost can become expensive if spoilage, damage, leakage, recall risk, or non-compliance rises.
Food Packaging Market Size and Forecast Statistics
Market-size statistics are strongest when they are read by scope. Total food packaging, flexible packaging, foodservice packaging, sustainable packaging, and biodegradable packaging do not measure the same pool of demand, so the numbers should be used as category signals rather than interchangeable totals. Market size: global estimates remain in the hundreds of billions of dollars. Forecast signal: 2033 and 2034 outlooks point to steady long-term expansion. Definition gap: wide and narrow market definitions explain forecast differences. Decision use: use each benchmark by scope, not as a single universal total.
The strongest benchmark pattern is that food packaging remains a large and steadily expanding market, while the growth drivers differ by definition. Total food packaging growth is tied to packaged food volume, convenience products, foodservice demand, and retail modernization. Sustainable packaging growth is tied to brand commitments, policy pressure, consumer expectations, and regulatory redesign. Flexible packaging growth is linked to lightweighting, shelf efficiency, snack foods, frozen foods, and ecommerce-ready formats.
Market-size and forecast benchmarks
• GVR estimates the global food packaging market at USD 421.60B in 2025, establishing the base scale for the category.
• GVR forecasts the market will reach USD 598.98B by 2033, showing steady long-term growth.
• GVR projects a 4.3% CAGR from 2025-2033, setting the main growth rhythm for the forecast period.
• MarketsandMarkets places the market at USD 548.51B by 2030, confirming near-term expansion.
• Fortune Business Insights projects a broader outlook of USD 930.89B by 2034, showing upside potential under wider market definitions.
Market definition and scope
| Market definition | What it includes | How to use it |
|---|---|---|
| Total food packaging | Retail, foodservice, industrial food, and logistics formats | Use for top-line market scale and forecast framing |
| Foodservice packaging | Cups, containers, wraps, clamshells, trays, and bags | Use for QSR, delivery, and takeaway demand analysis |
| Flexible packaging | Pouches, bags, films, wraps, and sachets | Use for convenience, snacks, frozen food, and lightweighting trends |
| Sustainable packaging | Recyclable, recycled-content, compostable, reusable, and lower-impact formats | Use for redesign, policy, and brand commitment analysis |
| Biodegradable packaging | Materials designed to degrade under defined conditions | Use carefully because infrastructure and definitions differ by market |
Material Mix: Cost, Performance, and Regulation
Material mix is one of the most important parts of food packaging analysis because it determines cost, barrier performance, weight, shelf appearance, recyclability, chemical exposure, and regulatory risk. Plastic remains central because it is lightweight, flexible, protective, and relatively efficient for many food applications. Paper and paperboard grow where recyclability, brand perception, and fiber substitution matter. Metal and glass remain important where high-barrier protection, shelf stability, premium positioning, or reuse are priorities.
The next phase of material competition is not simply plastic versus paper. It is a performance tradeoff across food safety, packaging weight, shelf life, carbon footprint, cost, collection access, and label claims. A fiber-based package may reduce plastic use but need coatings for grease or moisture resistance. A recyclable mono-material pouch may improve end-of-life potential but must still protect the food. A compostable package may satisfy a foodservice use case but only if composting infrastructure exists.
Material pressure benchmarks
• Plastic packaging value reached USD 429.89B in 2026, showing that plastic remains a core food packaging material despite regulatory and recycling pressure.
• Plastic food packaging is forecast to reach USD 565.71B by 2033, showing continued demand for lightweight, sealable, and high-barrier formats.
• Plastic packaging is projected to grow at a 4.0% CAGR from 2026-2033, which points to stable expansion rather than rapid displacement.
• The projected value gain is USD 135.82B, meaning material redesign is gradual even as brands test paper, fiber, bioplastics, and mono-material alternatives.
• The plastic packaging market multiple is about 1.32x, showing that sustainability pressure changes specifications but does not erase scale.
| Material | Where it wins | Constraint or risk |
|---|---|---|
| Plastic | Lightweight, flexible, strong barrier, low breakage | Policy pressure, recycling gaps, chemical scrutiny |
| Paper and paperboard | Recyclability perception, cartons, sleeves, dry food | Barrier coatings, moisture limits, fiber supply |
| Metal | Cans, shelf-stable food, high barrier | Energy intensity, price volatility, format limits |
| Glass | Premium food, sauces, jars, reuse potential | Weight, breakage, transport cost |
| Bioplastics | Brand sustainability goals and compostable use cases | Cost, performance, infrastructure uncertainty |
| Multilayer films | High-barrier protection for snacks and ready foods | Difficult recycling and material separation |
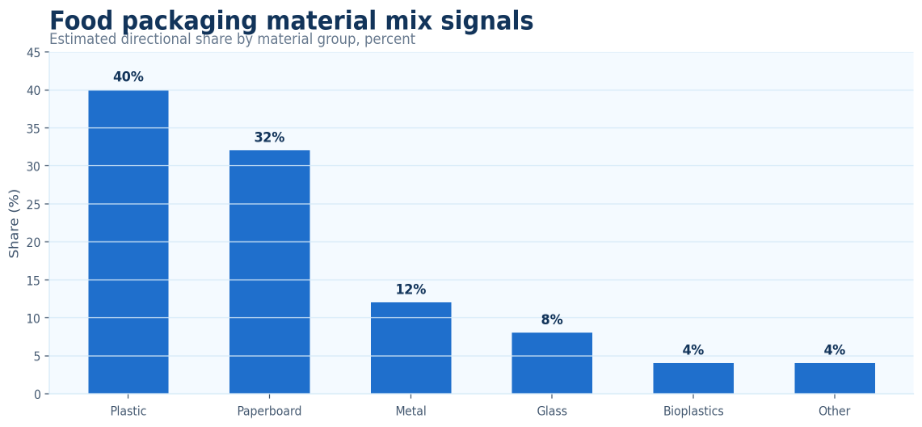
Figure 2. Material mix comparison shows why food packaging decisions must balance cost, performance, regulation, and end-of-life access.
Editorial readout:
Material choice should be judged by the job the food package must perform. A low-cost format can fail if it weakens shelf life, while a sustainable-looking format can create risk if it lacks barrier performance, collection access, or food-contact compliance.
Flexible and Rigid Packaging: Format, Protection, and Logistics
Format statistics add another layer because material alone does not explain how a package performs. Flexible packaging includes pouches, bags, films, sachets, wraps, and lids. It often wins where brands need lightweighting, portion control, lower transport weight, shelf efficiency, and consumer convenience. Rigid packaging includes trays, bottles, tubs, cartons, cans, jars, and clamshells. It remains important where food needs stacking strength, shape stability, premium display, hot-fill performance, or physical protection.
• Flexible demand: pouches, films, bags, and wraps support lightweight distribution.
• Rigid demand: trays, bottles, cups, jars, and tubs support protection and stackability.
• Channel fit: delivery and ecommerce increase the need for damage-resistant formats.
• Cost tradeoff: format choice affects freight, storage, leakage, and shelf presentation.
Flexible packaging is especially important in snacks, frozen food, sauces, pet food, confectionery, meal components, and single-serve products. Rigid packaging remains essential in dairy, beverages, ready meals, shelf-stable food, fresh produce, sauces, and foodservice applications. Semi-rigid formats also matter because trays and tubs often bridge the gap between protection and lightweighting.
| Format | Demand signal | Market implication |
|---|---|---|
| Flexible pouches | Convenience, portioning, and shelf efficiency | Supports snacks, sauces, pet food, frozen, and meal kits |
| Films and wraps | Barrier and sealing performance | Protects freshness and enables high-speed packing |
| Rigid trays | Protection and ready-meal compatibility | Supports chilled, frozen, and microwave-ready foods |
| Cans and jars | Shelf-stable food protection | Maintains relevance in sauces, vegetables, soups, and premium products |
| Clamshells | Visibility and portability | Supports produce, bakery, deli, and foodservice needs |
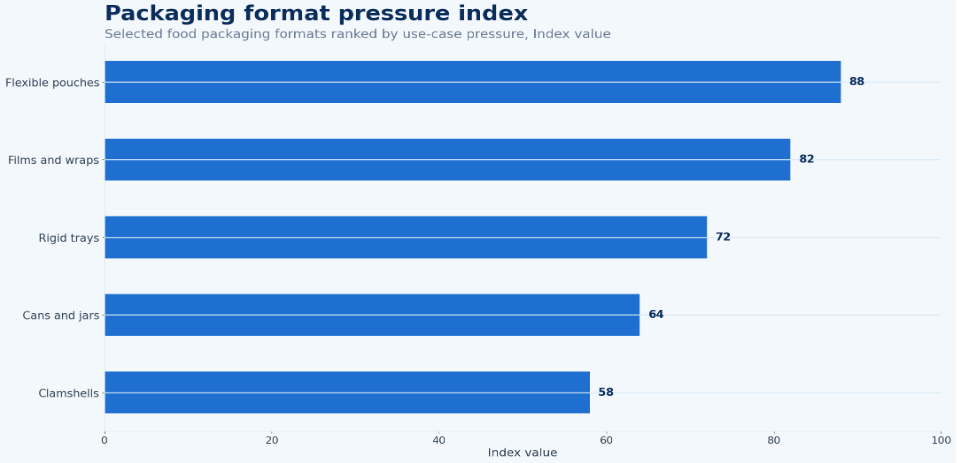
Figure 3. Flexible versus rigid packaging comparison shows how format choice changes logistics, protection, and shelf performance.
Editorial readout:
Flexible and rigid formats should be compared by use case. Product texture, barrier need, transport, display, and disposal path decide the winner.
Sustainable Packaging: Claims, Infrastructure, and Growth
Sustainable packaging is one of the strongest growth themes in food packaging, but it is also one of the easiest areas to oversimplify. Recyclable, recycled-content, compostable, biodegradable, reusable, and plastic-reduction formats are not the same solution. Each pathway depends on a different infrastructure system, regulatory definition, material performance profile, and consumer behavior pattern.
Recyclability is useful only when the package is accepted, sorted, and processed in real recycling systems. Recycled content helps reduce virgin material demand but depends on food-contact approval, supply quality, and price. Compostable packaging may be useful for food-contaminated serviceware, but it needs industrial composting access and clear labeling. Reuse can reduce single-use waste but requires reverse logistics, washing systems, and consumer participation. These tradeoffs explain why sustainability statistics should be linked to end-of-life pathways, not just material labels.
Sustainability growth benchmarks
• Eco-friendly food packaging reached USD 227.96B in 2024, showing that sustainability-focused formats already have a large existing base.
• Eco-friendly packaging is forecast to reach USD 353.78B by 2030, pointing to fast redesign demand across food and foodservice packaging.
• Eco-friendly packaging is projected to grow at a 7.6% CAGR from 2024-2030, which is above the base-market growth rate.
• The broader sustainable packaging market was estimated at USD 272.93B in 2023, confirming the scale of recyclable, recycled-content, reusable, and lower-impact formats.
• Sustainable packaging is forecast to reach USD 448.53B by 2030, showing a strong expansion path as brands align claims with infrastructure and regulation.
| Sustainability signal | What it measures | Why it matters |
|---|---|---|
| Recyclability | Whether a package can enter recycling streams | Shows if circularity claims can work in practice |
| Recycled content | Share of recycled material in a package | Reduces virgin material demand and supports policy targets |
| Compostability | Ability to break down under defined composting conditions | Useful only where infrastructure and labeling are clear |
| Reuse readiness | Ability to circulate through refill or return systems | Requires reverse logistics and cleaning economics |
| Plastic reduction | Lower virgin plastic use or substitution | Can reduce policy exposure but may create barrier tradeoffs |
| Collection access | Real consumer access to recovery systems | Determines whether end-of-life claims are credible |
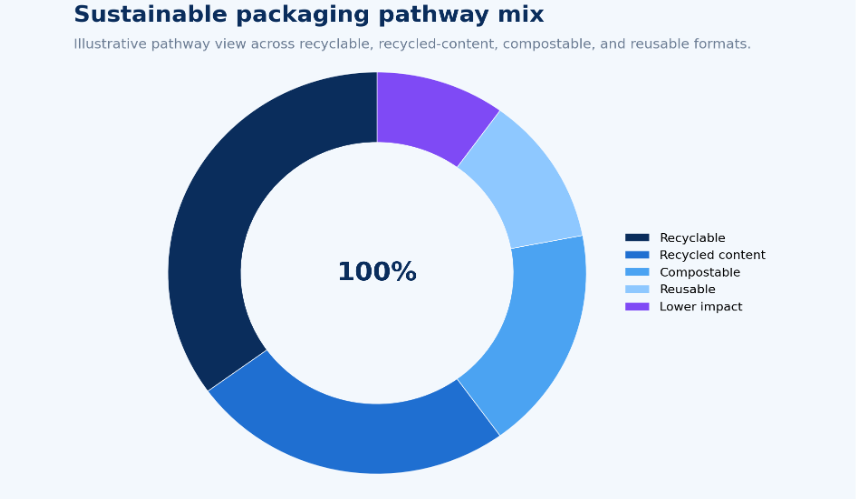
Figure 4. Sustainable packaging pathways show why recyclable, compostable, reusable, and recycled-content formats should not be treated as one solution.
Editorial readout:
Sustainable packaging is strongest when the claim matches the system. Recyclable, compostable, reusable, and recycled-content packages solve different problems, so they should not be presented as one interchangeable solution
Food Safety and Shelf-Life Statistics
Food packaging is a safety system before it is a branding system. It protects food from oxygen, moisture, light, microbial contamination, tampering, temperature abuse, and handling damage. For fresh, frozen, chilled, and ready-to-eat foods, packaging can influence shelf life, waste rates, recall exposure, and consumer trust. That is why a sustainability decision that weakens barrier performance can create a larger problem than it solves.
• Safety role: packaging protects against contamination, leakage, tampering, and spoilage.
• Shelf-life value: barrier performance can reduce waste more than low pack cost alone.
• Technology signal: active, intelligent, and modified-atmosphere formats add premium value.
• Risk watch: food-contact compliance remains central to every material switch.
Packaging technologies such as modified atmosphere packaging, active packaging, intelligent labels, tamper-evident closures, temperature indicators, moisture control, and high-barrier films are increasingly important because food supply chains are longer and more complex. Ecommerce grocery and meal kits add another layer: packaging must protect food after it leaves the store or warehouse and travels through a less controlled last-mile environment.
| Packaging function | What it protects | Business implication |
|---|---|---|
| Oxygen barrier | Flavor, color, fats, and oxidation-sensitive foods | Extends shelf life and reduces spoilage |
| Moisture barrier | Texture and product stability | Protects snacks, dry food, bakery, and frozen products |
| Tamper evidence | Consumer safety and trust | Reduces risk perception and supports compliance |
| Modified atmosphere | Fresh meat, produce, and prepared foods | Extends freshness in chilled categories |
| Traceability label | Batch, date, and compliance data | Supports recalls, transparency, and inventory control |
| Cold-chain support | Temperature-sensitive foods | Protects quality in delivery and distribution |
Editorial readout:
Food waste and packaging waste must be analyzed together. Less material can create more total impact if spoilage, leakage, or damage rises.
Food Category Demand: Where Packaging Requirements Change
Food packaging demand changes sharply by product category. Bakery and confectionery packaging emphasizes shelf display, portioning, grease resistance, and brand presentation. Dairy packaging emphasizes freshness, cold-chain compatibility, sealing, and food-contact safety. Meat, poultry, and seafood packaging emphasizes barrier performance, leak control, modified atmosphere, and temperature management. Frozen food packaging emphasizes moisture control, freezer durability, and graphics that survive long storage cycles.
• Bakery and snacks: display, portioning, grease resistance, and resealability matter most.
• Ready meals: trays, films, microwave safety, and temperature performance shape demand.
• Fresh produce: ventilation, moisture control, and waste reduction drive format choice.
• Pet and baby food: trust, safety, and shelf stability carry higher packaging expectations.
Ready meals, snacks, sauces, condiments, produce, baby food, and pet food each create their own packaging logic. Ready meals need trays, films, microwave compatibility, and heat tolerance. Snacks need lightweight flexible formats and high shelf visibility. Sauces need leakage control and controlled dispensing. Fresh produce needs breathability and damage reduction. Baby food needs high trust, strict safety, and tamper evidence. Pet food often needs high-barrier pouches, resealability, and bulk formats.
| Food category | Packaging need | Market implication |
|---|---|---|
| Bakery and confectionery | Display, portioning, grease resistance | Supports brand presentation and impulse sales |
| Dairy | Freshness, sealing, cold-chain compatibility | Links packaging to food safety and shelf life |
| Meat and seafood | Barrier, leak control, MAP, temperature control | Requires high-performance packaging and compliance |
| Ready meals | Microwave compatibility, trays, films | Supports convenience and prepared-food growth |
| Snacks | Lightweight flexible packs and shelf visibility | Supports high-volume flexible packaging demand |
| Produce | Breathability and damage reduction | Balances freshness, waste reduction, and visibility |
Editorial readout:
Food packaging cannot be optimized as one category. Food type, shelf-life risk, handling, and consumption occasion should drive the format.
Channel Packaging: Retail, Foodservice, Ecommerce, and Delivery
Channel strategy changes packaging requirements. Retail grocery packaging must support shelf display, inventory handling, barcodes, safety labels, and household storage. Foodservice packaging must manage heat, grease, portability, cost, and local restrictions on plastics or PFAS. Ecommerce grocery packaging must resist damage, protect temperature-sensitive foods, prevent leaks, and reduce consumer frustration during delivery. Meal kits add portioning, labeling, insulation, and secondary packaging demands.
A package that performs well in a supermarket may fail in quick commerce or food delivery. For example, a tray that looks strong on shelf may crack in delivery. A paper wrap that works for dine-in food may fail during a 30-minute delivery window. A recyclable pack may be difficult to use if it compromises temperature, grease resistance, or sealing. This is why channel statistics should be connected to performance requirements.
| Channel | Packaging pressure | Why it matters |
|---|---|---|
| Retail grocery | Shelf display, barcodes, stacking, freshness | Controls visibility and household purchase decisions |
| Foodservice | Heat, grease, portability, cost | Shapes QSR and takeaway experience |
| Convenience store | Single-serve, quick handling, chilled shelf | Supports impulse and on-the-go use |
| Ecommerce grocery | Damage control, insulation, leak resistance | Protects last-mile food quality |
| Meal kits | Portioning, labeling, insulation | Requires complex multi-component packaging |
| Industrial food | Bulk protection and transport efficiency | Supports manufacturing and ingredient supply chains |
Editorial readout:
Channel growth creates redesign pressure. Ecommerce, delivery, and quick commerce require stronger performance than shelf-only packaging.
Brand, Manufacturer, and Converter Signals
The food packaging market is shaped by a network of food brands, packaging manufacturers, converters, material suppliers, retailers, foodservice operators, recycling systems, and regulators. Food brands define product needs and consumer-facing claims. Packaging manufacturers and converters turn materials into functional formats. Retailers set shelf requirements and sustainability scorecards. Foodservice operators drive high-volume disposable format demand. Regulators define the boundaries for food contact, plastics, PFAS, labels, and producer responsibility.
• Converter role: speed, print quality, barrier expertise, and compliance support drive value.
• Brand pressure: retail, ecommerce, and sustainability claims increase redesign frequency.
• Supplier risk: resin, paperboard, coatings, inks, and closures create exposure points.
• Execution signal: fast testing cycles matter more than one-time material substitution.
Competitive strength in food packaging increasingly depends on design speed and compliance readiness. Suppliers that can help brands shift from multimaterial structures to more recyclable formats, reduce virgin plastic, increase recycled content, maintain barrier performance, and meet country-specific rules are better positioned than suppliers that only compete on material price.
| Company group | Packaging strength | Strategic signal |
|---|---|---|
| Global packaging manufacturers | Scale, R&D, material access | Can support large brands and multi-region transitions |
| Converters | Format engineering and customization | Translate material strategy into shelf-ready packages |
| Food brands | Product needs and brand claims | Drive specifications and redesign timelines |
| Retailers | Shelf standards and sustainability scorecards | Influence packaging acceptance and private-label design |
| Foodservice operators | High-volume disposable formats | Push demand for compliant serviceware |
| Recycling partners | End-of-life execution | Determine whether circularity claims are practical |
Editorial readout:
Food packaging competition is about more than cheaper packs. It is about managing performance, compliance, sustainability claims, and channel-specific risk.
Regional Food Packaging Intelligence
Regional packaging intelligence is one of the highest-value parts of the market because global averages hide differences in food systems, retail maturity, recycling access, climate, foodservice habits, and policy pressure.
Asia Pacific leads on scale because of population, packaged food growth, retail expansion, and manufacturing capacity. China and India are especially important because they combine rising consumption, modern retail, food delivery, and domestic packaging supply. North America is shaped by convenience food, ecommerce grocery, foodservice packaging, private-label growth, and brand sustainability targets. Europe carries stronger regulatory pressure around plastic waste, recycled content, EPR, compost ability claims, and food-contact chemicals.
Asia Pacific leads on scale because of population, packaged food growth, retail expansion, and manufacturing capacity. China and India are especially important because they combine rising consumption, modern retail, food delivery, and domestic packaging supply. North America is shaped by convenience food, ecommerce grocery, foodservice packaging, private-label growth, and brand sustainability targets. Europe carries stronger regulatory pressure around plastic waste, recycled content, EPR, compos tability claims, and food-contact chemicals.
Regional growth benchmarks
- Asia Pacific food packaging revenue reached USD 103.15B in 2024, giving the region a large scale base for packaged food, retail, and manufacturing demand.
- Asia Pacific food packaging revenue is forecast to reach USD 179.67B by 2033, showing long-term upside for converters, material suppliers, and food brands.
- The region is projected to grow at a 6.36% CAGR from 2024-2033, placing it above the base-market growth rhythm.
- Asia Pacific is expected to add USD 76.52B in value over the forecast period, creating a large expansion runway for flexible, rigid, and foodservice formats.
- The regional market is projected to expand by 1.74x, confirming scale-led momentum across packaged food, delivery, modern retail, and urban consumption.
Latin America is influenced by affordability, flexible packaging, retail modernization, and packaged food penetration. Middle East and Africa markets are more dependent on food imports, climate conditions, urbanization, and cold-chain development. This regional mix shows why a global packaging strategy must be adapted to local channel and compliance realities.
| Region | Category signal | Market implication |
|---|---|---|
| Asia Pacific | Large packaged food base and USD 171.6B in 2025 regional food packaging revenue | Scale, urbanization, and retail expansion support growth |
| North America | Convenience food, foodservice, and ecommerce grocery demand | Performance, delivery durability, and sustainability targets matter |
| Europe | EPR, plastic reduction, recycling, and PFAS scrutiny | Compliance pressure shapes material and format redesign |
| Latin America | Affordable packaged food and flexible packaging demand | Cost, portioning, and modern retail growth matter |
| Middle East & Africa | Food imports, climate, urban retail, and cold-chain expansion | Temperature protection and distribution reliability matter |
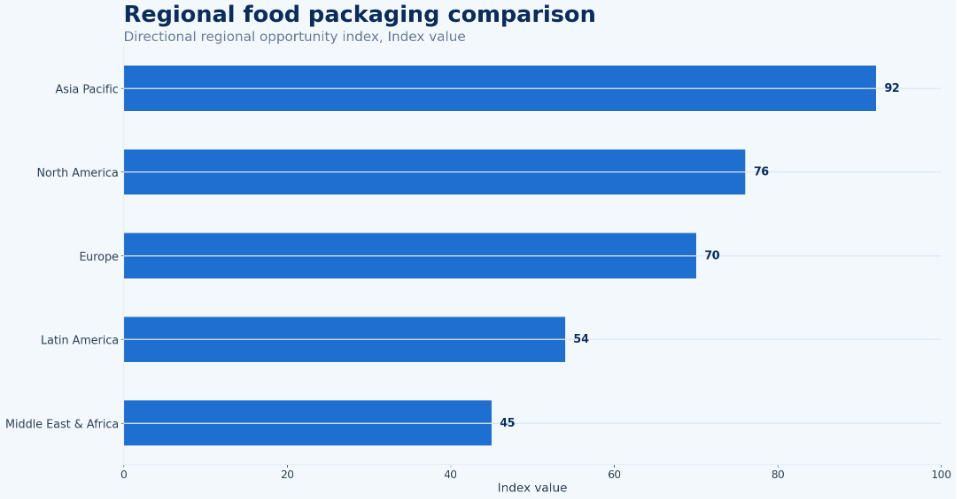
Figure 5. Regional food packaging comparison separates scale markets, regulation-heavy markets, and emerging channel-growth markets.
Editorial readout:
The same packaging statistic can mean different things by region: scale in Asia Pacific, compliance in Europe, convenience in North America, and distribution maturity in emerging markets.
Country-Level Food Packaging Statistics
Country-level packaging statistics matter because food packaging is shaped by local food habits, income levels, retail formats, waste rules, recycling infrastructure, foodservice behavior, and material regulation. A package that works in the United States may need different sizing, labeling, material, or compliance design in Germany, India, China, Brazil, or the United Arab Emirates. Country data helps separate global market size from the execution conditions that determine whether packaging redesign is practical.
The United States should be read as a high-value and high-complexity market because it combines packaged food, retail, foodservice, ecommerce, and state-level regulation. China and India are scale markets where packaged food growth and modern retail expansion raise demand for flexible, rigid, and foodservice packaging. Japan and South Korea emphasize quality, portioning, and convenience. Germany, France, and the United Kingdom emphasize compliance, recycling, and material redesign. Brazil and Mexico combine packaged food growth with affordability and flexible packaging demand. Australia, Saudi Arabia, the United Arab Emirates, and South Africa add further variation through geography, imports, climate, and infrastructure.
• United States: convenience, foodservice, ecommerce, and retailer requirements shape demand.
• China and India: population, packaged food adoption, and modern retail support scale.
• Europe: recyclability, EPR, and food-contact rules create redesign pressure.
• Emerging markets: affordability and flexible formats remain strong growth signals.
| Country | Key packaging signal | Market implication |
|---|---|---|
| United States | Large packaged food, foodservice, and ecommerce grocery base | Convenience, delivery durability, and state-level rules matter |
| China | Major scale market with fast retail modernization | Volume, manufacturing, and flexible packaging demand remain strong |
| India | Packaged food growth, urbanization, and affordability needs | Small formats, flexible packaging, and cost control matter |
| Japan | High quality expectations and portioned formats | Precision, convenience, and waste management shape design |
| Germany | Strong recycling and packaging compliance culture | Recyclability, EPR, and material documentation matter |
| United Kingdom | Plastic reduction and foodservice packaging pressure | Compliance and sustainable alternatives remain strategic |
| Brazil | Packaged food scale and flexible format demand | Affordability, retail growth, and material cost matter |
| Saudi Arabia | Food imports, climate, and modern retail | Shelf stability and temperature protection are important |
Editorial readout:
Country-level data turns global growth into operating decisions. Material choice, pack size, labels, compliance, and end-of-life claims must adapt by market.
Policy, Plastic, PFAS, and Recycling Pressure
Policy is now a direct market force in food packaging. Single-use plastic rules, EPR fees, recycled-content targets, PFAS restrictions, compostability labeling, and food-contact requirements can change pack economics before consumer demand does.
PFAS scrutiny is particularly important for food packaging because grease-resistant paper, molded fiber, and foodservice containers can be affected by chemical restrictions. Plastic policy matters because many food formats depend on lightweight barrier packaging. EPR matters because producer fees can shift costs toward brands and packaging suppliers. Compostability claims matter because unclear labels can confuse consumers and create contamination in recycling or compost streams. These issues make policy statistics central to food packaging planning.
| Policy area | What it affects | Market impact |
|---|---|---|
| Single-use plastic rules | Service ware, bags, straws, containers, films | Pushes substitution and redesign |
| Extended producer responsibility | Fees and producer accountability | Adds cost visibility and circularity pressure |
| PFAS restrictions | Grease-resistant food contact materials | Changes coatings, molded fiber, and foodservice specs |
| Recycled-content targets | Material sourcing and food-contact approvals | Supports circularity but raises supply and compliance needs |
| Food-contact rules | Chemical safety and migration limits | Raises testing, documentation, and supplier standards |
| Compostability labeling | Claims and consumer sorting | Requires clear definitions and infrastructure alignment |
| Recycling access | Actual collection and processing systems | Determines whether claims work in practice |
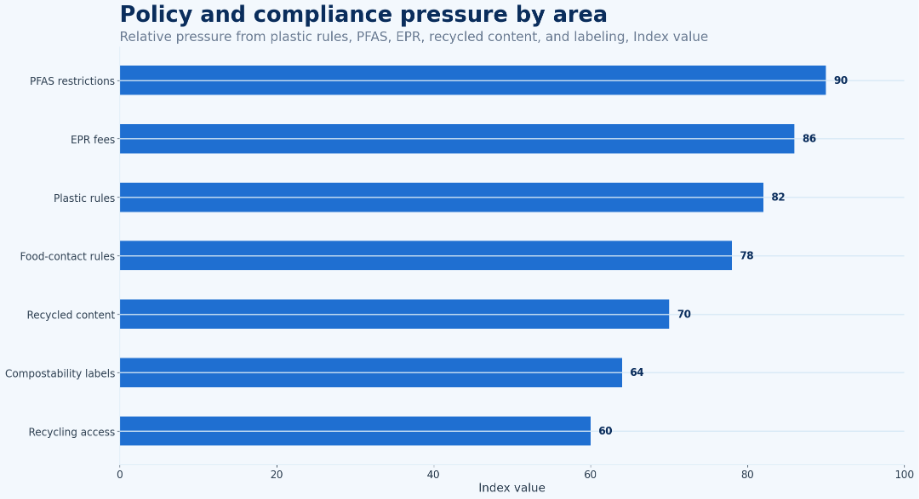
Figure 6. Policy pressure by packaging area shows how regulation is changing material economics and compliance priorities.
Editorial readout:
Regulation is a design variable. Winning packs protect food, fit the channel, and meet material, chemical, labeling, and end-of-life rules.
Packaging Cost: Margin, Operations, and Risk
Packaging cost has become more visible because food companies are managing inflation, retailer price pressure, and shifting material economics at the same time. Resin, paperboard, aluminum, glass, coatings, inks, adhesives, freight, energy, and labor can move in different directions. A food brand may reduce the weight of one pack but still face higher total cost if sealing speed drops, scrap rises, or the replacement material requires more expensive coatings.
The better benchmark is total packaging economics. Unit price matters, but it does not explain whether the package protects shelf life, survives distribution, runs efficiently on filling lines, meets retailer requirements, or avoids compliance risk. A cheaper package can become expensive if it increases leakage, spoilage, returns, damage claims, or redesign work. A higher-cost package may be justified when it reduces food waste, improves line uptime, lowers freight weight, or satisfies regulation before a deadline.
Cost and margin benchmarks
• Unit-cost pressure: resin, fiber, metal, coatings, adhesives, and freight affect pack economics.
• Line-efficiency pressure: a new pack can slow filling, sealing, labeling, or case packing.
• Waste pressure: weak barrier, poor seals, or low damage resistance can raise product loss.
• Compliance pressure: PFAS, EPR, recycled-content rules, and labeling standards add redesign cost.
Editorial readout:
Cost per package is only the starting point. The stronger benchmark is total packaging economics: unit cost, line efficiency, shelf life, damage, compliance, and retailer acceptance.
Packaging Innovation: Adoption Signals to Watch
Innovation in food packaging is moving across several layers at once. Mono-material flexible films are being developed to improve recyclability. High-barrier paper structures are being tested for snacks, frozen food, and dry goods. Molded fiber is expanding in foodservice, produce, and tray applications. Active packaging, intelligent labels, freshness indicators, and QR-linked traceability are improving safety and information flow. Reusable and refill formats continue to be tested in controlled retail, foodservice, and delivery models.
These innovations should be judged by adoption signals, not by announcements alone. Strong signals include retailer trials becoming permanent, food brands scaling across multiple SKUs, converters investing in new machinery, regulators recognizing standards, and recycling systems accepting the new structure. Weak signals include pilot-only programs, vague claims, unclear recovery pathways, or formats that require consumer behavior that has not yet been built.
Innovation signals worth tracking
• Mono-material films: designed to improve recycling fit while protecting snacks, frozen food, and dry goods.
• High-barrier paper: supports fiber substitution where coatings can still protect food quality.
• Molded fiber: expands in trays, bowls, produce packs, and foodservice containers.
• Intelligent packaging: uses labels, indicators, or codes to support freshness, traceability, and trust.
Editorial readout:
Food packaging innovation is strongest when it solves several problems at once: protection, compliance, line performance, consumer usability, and end-of-life fit.
Procurement and Supplier Readiness
Food packaging procurement is becoming more strategic because buyers need suppliers that can support performance testing, food-contact documentation, recycled-content quality, PFAS-free alternatives, regional compliance, and redesign timelines. A supplier with a lower quote can still create hidden risk if it cannot document materials, support multi-country rules, or scale a new format without quality problems.
Packaging buyers should compare suppliers by capability as well as cost. Useful measures include testing capacity, geographic reach, converter flexibility, recycled material access, food-contact expertise, lead time, and ability to support retailer sustainability scorecards. For larger food brands, supplier diversification also matters because resin shortages, fiber constraints, energy costs, freight disruption, and policy changes can quickly affect availability.
The procurement implication is clear: packaging should be purchased as a performance and compliance input, not only a commodity. Cost per unit remains important, but total packaging value also includes fewer damages, longer shelf life, fewer compliance failures, stronger environmental claims, better retailer acceptance, and lower redesign risk.
| Supplier capability | What to confirm | Why it matters |
|---|---|---|
| Food-contact documentation | Migration testing, material declarations, and coating details | Reduces safety and regulatory risk |
| Redesign support | Prototype speed, validation testing, and commercial-line readiness | Helps brands shift materials without disrupting supply |
| Regional compliance | PFAS, EPR, recycled-content, labeling, and local rules | Prevents one global pack from failing in stricter markets |
| Recovery alignment | Recycling, composting, reuse, or disposal pathway by market | Keeps sustainability claims realistic |
Editorial readout:
Supplier readiness is now part of packaging strategy. The strongest partners combine material access, testing proof, regulatory support, and practical redesign capability.
Food Packaging Growth-Leak Diagnostic
A food packaging benchmark should help teams identify where growth is leaking. A market may be expanding, but a brand or supplier can still lose value through poor material choice, weak shelf-life performance, ecommerce damage, high compliance exposure, unrealistic sustainability claims, rising material costs, or poor country-level fit. This diagnostic model connects statistics to practical decisions.
| Problem area | Core signals to measure | Useful benchmark |
|---|---|---|
| Market scale | Value, CAGR, regional share | Where investment attention belongs |
| Material mix | Plastic, paper, metal, glass, bioplastics | Where cost and regulation are shifting |
| Shelf-life performance | Barrier, sealing, food waste, temperature control | Whether packaging protects food value |
| Policy exposure | PFAS, EPR, plastic rules, food-contact requirements | Compliance and redesign risk |
| Recycling access | Collection, sorting, recycled-content supply | If circularity claims are practical |
| Channel performance | Foodservice, retail, ecommerce, delivery damage | Whether formats fit real use cases |
| Country fit | Local rules, infrastructure, income, food habits | Whether a global pack needs adaptation |
Editorial readout:
his diagnostic turns statistics into decisions: growth, material shift, protection performance, and country-level compliance.
90-Day Food Packaging Benchmark Plan
A 90-day packaging benchmark plan turns external statistics into an internal scorecard. The goal is not to chase every sustainability claim or market-size number. The goal is to compare external benchmarks against real product needs, shelf-life requirements, channel risks, material costs, and country-level regulation.
The best packaging teams use the first month to establish the baseline, the second month to identify risk and opportunity, and the third month to convert data into supplier, material, and format priorities. This sequence prevents teams from treating sustainability, food safety, and cost as separate conversations.
| Timing | What to do | Output |
|---|---|---|
| Days 1–30 | Build a baseline by region, country, material, format, food category, channel, sustainability claim, and regulatory exposure. | Food packaging benchmark map |
| Days 31–60 | Compare market value, material mix, recycled-content readiness, foodservice demand, ecommerce performance, and policy exposure. | Opportunity and risk matrix |
| Days 61–90 | Prioritize materials, suppliers, formats, and markets based on performance, compliance, cost, and circularity readiness. | Repeatable packaging scorecard |
Metrics Packaging Leaders Should Track
The most useful food packaging metrics connect market growth with design decisions. Market value and CAGR show scale, while material share, shelf-life performance, recovery access, channel durability, and compliance exposure show whether the packaging system can support profitable growth.
Core metrics worth tracking
• Market value and CAGR should be tracked together because the core benchmarks range from USD 421.60B in 2025 to USD 598.98B by 2033, while broader estimates point as high as USD 930.89B by 2034.
• Material share should be reviewed by plastic, paper and paperboard, metal, glass, bioplastics, and multilayer films because each material carries a different cost, barrier, weight, recycling, and compliance profile.
• Flexible versus rigid share should be measured separately because pouches, films, wraps, trays, tubs, cans, jars, and clamshells solve different shelf-life, display, logistics, and foodservice problems.
• Recycled-content share should be monitored by food-contact approval, supply quality, and price because circularity targets can fail if compliant recycled material is unavailable or inconsistent.
• Recyclability rate should be measured against real collection, sorting, and processing access, not only against the technical claim printed on a package.
• Shelf-life extension should remain a core metric because a lighter or lower-cost pack can create higher total loss if spoilage, leakage, oxidation, or freezer damage increases.
• Packaging cost per unit should be compared with line efficiency, scrap, damage, returns, and compliance cost so procurement does not optimize unit price while raising operating risk.
• Ecommerce damage rate should be tracked through leakage, crushing, thawing, spill events, doorstep failures, and customer complaints because delivery creates risks that shelf-only packaging does not face.
• PFAS exposure should be reviewed for grease-resistant paper, molded fiber, coatings, wraps, bowls, trays, and foodservice formats where chemical scrutiny can trigger redesign.
• EPR cost exposure should be tracked by country and material type because producer responsibility fees can change the economics of plastic, paper, composite, and hard-to-recycle formats.
• Country-level compliance should be reviewed before scaling one package across markets because labeling, food-contact rules, recyclability claims, PFAS limits, and waste systems vary sharply by region.
• Channel performance should be measured across retail grocery, foodservice, ecommerce grocery, meal kits, convenience stores, and industrial food because each channel tests the package differently.
Editorial readout:
The metrics should not sit in a vanity dashboard. They should show where packaging value is being created or lost: market scale, material change, shelf-life protection, channel performance, compliance exposure, and country-level execution.
Food Packaging Market Statistics FAQ
Common questions
• What is the food packaging market?
The food packaging market includes materials, formats, and systems used to protect, transport, display, label, and preserve food products. It covers retail food, foodservice packaging, flexible formats, rigid containers, films, trays, cartons, bottles, cans, and sustainability-focused alternatives.
• How large is the global food packaging market?
Multiple estimates place the global food packaging market above USD 421 billion in 2025. Forecasts vary by definition, with some sources projecting the market near USD 599 billion by 2033 and others projecting more than USD 930 billion by 2034.
• Which region leads the food packaging market?
Asia Pacific is the clearest scale region, with regional food packaging revenue reported at about USD 171.6 billion in 2025. The region benefits from packaged food growth, urbanization, retail expansion, and large food manufacturing bases.
• What materials are most used in food packaging?
Plastic, paper and paperboard, metal, and glass remain the main material groups. Bioplastics, molded fiber, compostable materials, recycled-content formats, and coated paper are gaining attention as brands and regulators pressure packaging systems to reduce waste and improve circularity.
• Is sustainable food packaging growing?
Yes, but sustainable packaging should be separated by pathway. Recyclable, reusable, compostable, biodegradable, recycled-content, and plastic-reduction formats solve different problems and require different infrastructure.
• Why does PFAS matter in food packaging?
PFAS matters because some food-contact materials, especially grease-resistant paper or molded fiber formats, have historically used chemical treatments. New restrictions and scrutiny are pushing brands and suppliers to verify food-contact safety and redesign coatings.
• What metrics should food packaging companies track?
Packaging leaders should track market value, material mix, flexible versus rigid share, recycled-content use, recyclability, shelf-life performance, packaging cost per unit, ecommerce damage rate, PFAS exposure, EPR exposure, and country-level compliance.
Final Takeaway
Food packaging remains a global-scale market because every packaged food system depends on protection, shelf life, logistics, compliance, and consumer trust. The next phase of the market will be shaped by material substitution, sustainable design, food-contact safety, PFAS restrictions, recycling systems, ecommerce durability, and country-level regulation.
For packaging leaders, the practical goal is not only to measure market size. The stronger benchmark is readiness: which materials are shifting, which formats protect food best, which channels create new performance demands, and which regions are changing fastest through regulation, retail modernization, and circularity pressure. The strongest food packaging strategy will combine shelf-life performance, cost control, sustainable design, regional execution, and compliance readiness.