Pet food has moved from a routine household purchase into a global consumer market shaped by pet ownership, premium nutrition, ecommerce, veterinary diets, ingredient claims, and the emotional role of pets inside the home. Dogs and cats still drive most of the category, but the market is no longer only about feeding animals at the lowest cost. Brands now compete on digestion, coat health, palatability, breed size, life stage, sustainability, convenience, and the trust owners place in a package or subscription plan.
The largest market benchmarks show how much value now sits behind that shift. One upper-range estimate places the global pet food market at USD 208.55 billion in 2025 and USD 226.31 billion in 2026, with a forecast of USD 324.17 billion by 2031. A more conservative model still puts the market at USD 128.94 billion in 2025 and almost USD 199.50 billion by 2034, while worldwide revenue is also benchmarked at USD 161.72 billion in 2026. Those ranges differ, but they point to the same direction: pet food value is expanding steadily across mature and emerging markets.
Executive Pet Food Benchmarks
The headline numbers show a market with a large mature base and a long runway for premium growth. Pet food is purchased repeatedly, tied to household routines, and increasingly evaluated like human food: by ingredient quality, health benefit, brand trust, and convenience.
The numbers that define the pet food market
- The global pet food market is benchmarked at USD 208.55 billion in 2025 in one upper-range market model, showing how large the category becomes when broad pet food and related product definitions are included.
- The same model places the market at USD 226.31 billion in 2026 and forecasts USD 324.17 billion by 2031, equal to a 7.46% CAGR across 2026-2031.
- A narrower global model values pet food at USD 128.94 billion in 2025, USD 134.46 billion in 2026, and USD 199.50 billion by 2034, giving a more conservative 5.05% CAGR benchmark.
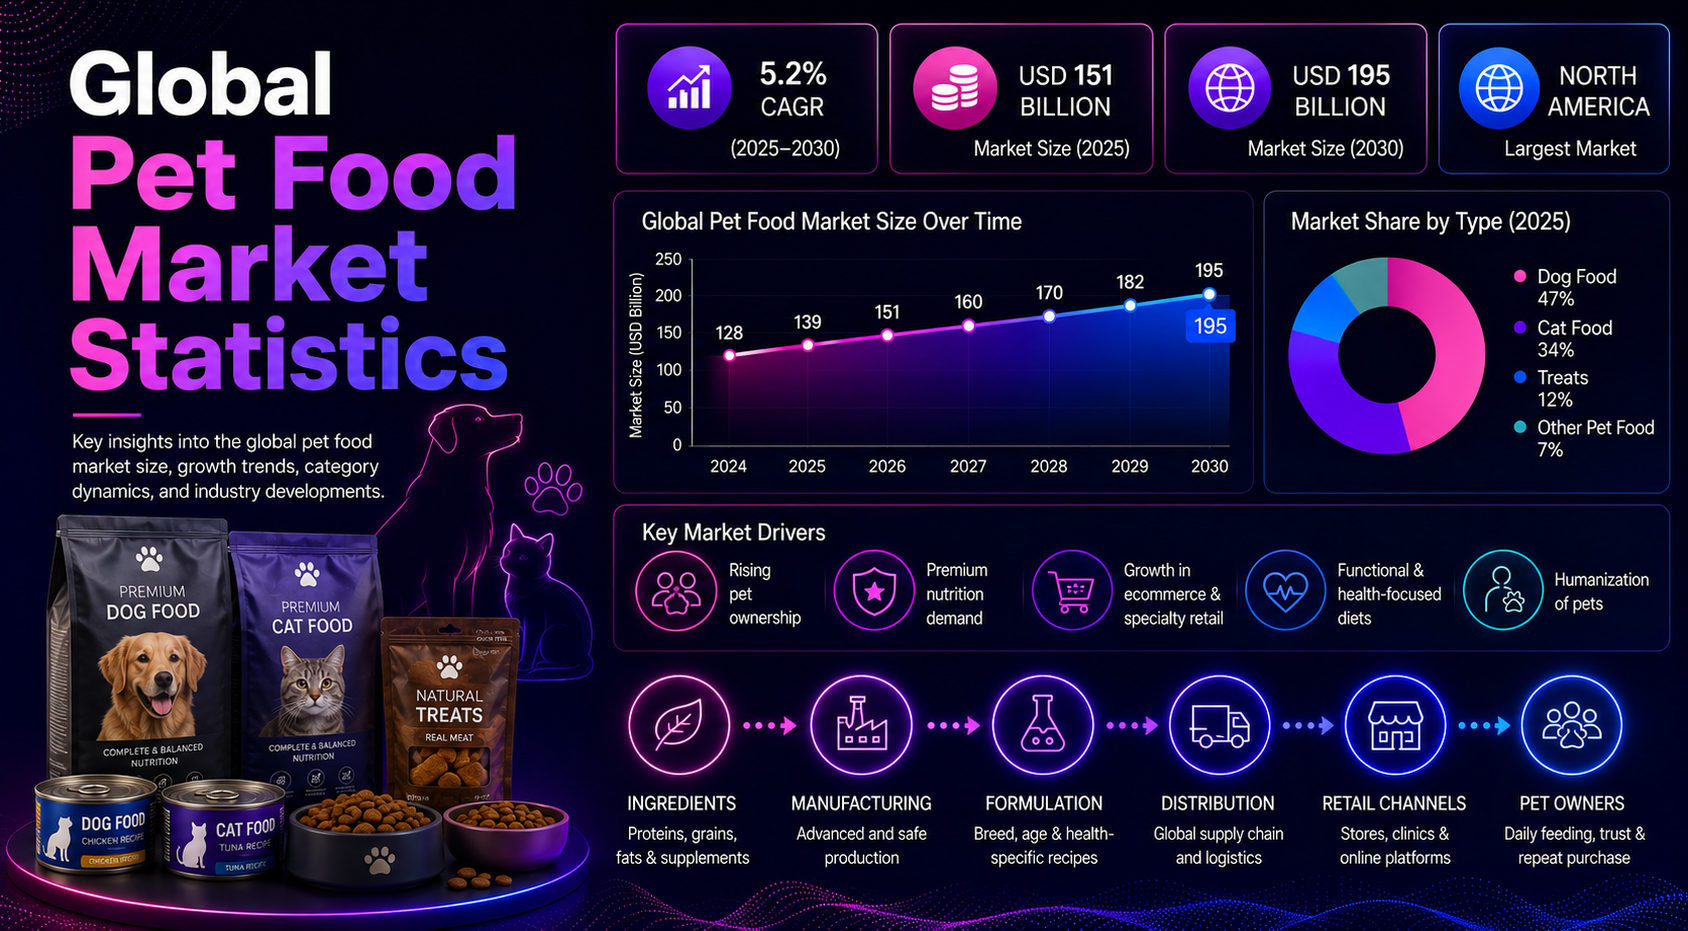
- Statista-style revenue modeling places worldwide pet food revenue at USD 161.72 billion in 2026 and expects the market to exceed USD 195 billion by 2029.
- North America held a 41.71% share of the global market in 2025 in one benchmark, confirming the region as the largest high-spend pet food base.
- U.S. pet industry spending reached USD 158.0 billion in 2024, while pet food and treats alone represented USD 68.3 billion of that total.
- APPA’s pet-owner benchmark places pet ownership at 95 million U.S. households in 2025, giving the market a broad repeat-purchase base.
- Europe’s pet food industry generated EUR 29.3 billion in value and 9.1 million tonnes in volume, supported by more than 500 pet food companies and more than 400 plants.
- Europe counted 299.148 million pets in 2023, including 108.305 million cats and 89.615 million dogs, creating one of the world’s largest companion-animal demand pools.
- China’s dog and cat consumer market reached USD 41.9 billion in 2024, and pet food represented 52.8% of pet spending in that market.
- China had 124.1 million dogs and cats in 2024, including 71.5 million cats and 52.6 million dogs, showing why cat food is central to China’s growth story.
- India’s pet food market was valued at USD 2.4 billion in 2024 and is projected to reach USD 4.6 billion by 2033, with a forecast CAGR of 7.2%.
- Canada’s pet food retail sales reached CAD 6.7 billion in 2024, with dog and cat food representing 98.2% of the sector.
- The global wet pet food market is benchmarked at USD 25.1 billion in 2025 and forecast at USD 42.1 billion by 2035, giving wet food a clear premium-format growth signal.
- The vegan dog food segment is valued at USD 6.5 billion in 2025 and forecast to approach USD 9.8 billion by 2030, reflecting niche but faster-growing sustainability-led demand.
Editorial readout
The executive numbers point to five forces behind pet food demand: pet ownership, premium nutrition, product format, channel migration, and regional growth. A useful market view separates dogs from cats, dry food from wet food, mature markets from emerging markets, and household spending from supply-chain cost pressure.
Why Pet Food Has Become a Global Consumer Market
Pet food has become a consumer market because owners do not buy it as an occasional discretionary product. They buy it repeatedly, often by pet type, life stage, package size, nutrition claim, and channel preference. That repeat behavior gives pet food a different profile from many packaged goods categories because a household can shift brands slowly, but it rarely leaves the category altogether while it owns a pet.
Pet ownership, humanization, and nutrition demand
- The U.S. pet-owner base of 95 million households in 2025 gives brands a wide consumer audience and a reliable replenishment cycle.
- U.S. dog ownership rose to about 68 million households in the latest survey, while cat ownership rose to 49 million households, keeping dogs larger by household count but cats highly relevant for premium wet food and specialized diets.
- Europe’s 299.148 million pet population includes 281.51 million pets excluding aquaria, which keeps demand broad even when fish tanks are removed from the base.
- Japan had 55.8 million pets in 2023, and even slow pet population growth still supports high-value premium products in a mature market.
- China’s 106 million pet owners in 2023 show that the market is not only large by pet count; it also has a large owner base that can be reached through ecommerce, specialty retail, and urban services.
- Post-1990s consumers were the largest named generational segment of Chinese pet owners, while post-2000s consumers already accounted for 25% of pet owners, making the market digitally native and brand-aware.
- India’s retail pet food sales grew from USD 245.4 million in 2018 to USD 629.6 million in 2023 and USD 730.1 million in 2024, showing how packaged pet food adoption can expand rapidly from a smaller base.
- Mars’ 20-country pet-homelessness project estimated almost 362 million homeless cats and dogs, a reminder that pet ownership growth and formal pet food adoption do not move evenly across all animal populations.
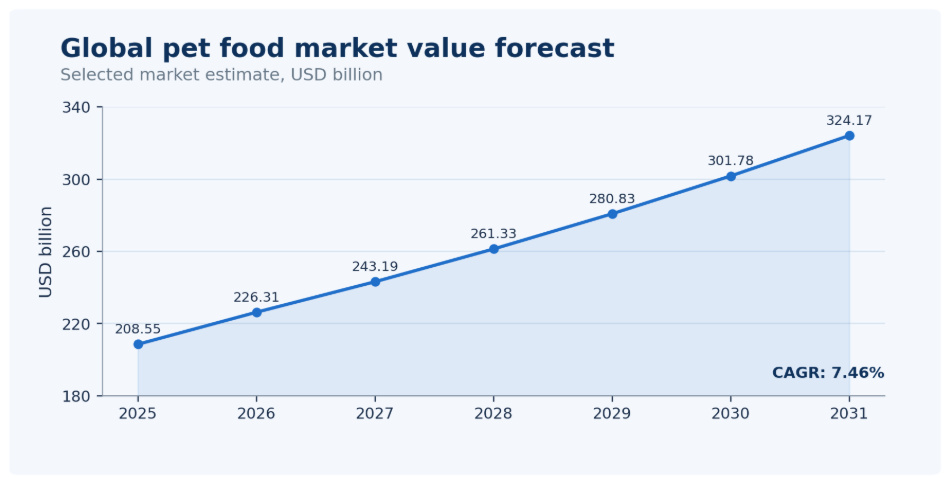
Figure 1. Global pet food market growth should be reviewed alongside pet ownership, premium nutrition, and channel shifts because category value can rise faster than pet population alone.
Global Pet Food Market Size and Forecast
The spread between the larger and narrower forecasts is useful rather than confusing. It shows that analysts draw the market boundary differently, especially around treats, veterinary diets, fresh formats, and online-only brands. For operators, the important signal is consistent: value is expanding because owners are buying more specialized food, not simply because the world has more dogs and cats.
Market-size estimates differ because pet food can be measured narrowly as finished food, broadly as food plus treats, or more widely across pet nutrition categories. The useful signal is the shared direction: the category is expanding through both volume growth and higher spend per pet.
Market-size and growth benchmarks
- One upper-range global benchmark moves from USD 208.55 billion in 2025 to USD 226.31 billion in 2026, then to USD 324.17 billion by 2031.
- That upper-range forecast uses a 7.46% CAGR from 2026 to 2031, which suggests a faster-growth definition that likely captures broad pet food category expansion.
- A more conservative forecast places the market at USD 128.94 billion in 2025, USD 134.46 billion in 2026, and USD 199.50 billion by 2034.
- The conservative model’s 5.05% CAGR from 2026 to 2034 still indicates steady global expansion even with a narrower category definition.
- Worldwide pet food revenue is also benchmarked at USD 161.72 billion in 2026, with a 5.01% annual growth expectation for 2026-2030.
- Retail value is expected to exceed USD 195 billion by 2029 in one revenue forecast, keeping pet food among the larger recurring consumer-packaged categories.
- Pet food is estimated at 1.70% of wider food market revenue by 2029, a small share of total food spending but a high-emotion and premium-heavy consumer niche.
- North America’s 41.71% share in 2025 shows how much of global value remains concentrated in high-spend, mature pet-owning markets.
| Market signal | What it shows | Why it matters |
|---|---|---|
| Upper-range global value | USD 208.55 billion in 2025 and USD 324.17 billion by 2031 | how large the category becomes under broader market definitions. |
| Conservative global value | USD 128.94 billion in 2025 and USD 199.50 billion by 2034 | Gives a lower planning range while still showing long-term expansion. |
| North America share | 41.71% of the market in 2025 | Confirms the region as a high-spend demand base. |
| Revenue forecast | USD 161.72 billion in 2026 and more than USD 195 billion by 2029 | that value growth continues across mainstream retail definitions. |
Market-size interpretation:
Pet food growth should not be read as one global value. Value rises because of more pets, higher spend per pet, premium formulas, treats, veterinary diets, ecommerce subscriptions, and packaged-food adoption in emerging markets.
Pet Ownership Statistics Behind Pet Food Demand
Ownership data also explains why the category behaves differently from many food sectors. A household does not usually buy pet food once; it repeats the purchase every week or month, often with the same formula, pack size, and retailer. That repeat cycle gives brands room to build loyalty, but it also makes switching risk high when prices rise or a product is out of stock.
Pet ownership is the demand base under every pet food forecast. A country with more dogs, cats, or pet-owning households does not automatically become a high-value pet food market, but it creates the foundation for dry food, wet food, treats, veterinary diets, and ecommerce replenishment.
Dog, cat, and household ownership benchmarks
- The U.S. had 95 million pet-owning households in 2025, making it one of the deepest repeat-purchase markets for pet food and treats.
- U.S. dog-owning households rose to about 68 million, compared with 65.1 million in the 2023-2024 survey.
- U.S. cat-owning households rose to 49 million, compared with 46.5 million in the previous survey.
- Europe counted 108.305 million cats and 89.615 million dogs in 2023, giving cats the largest named companion-animal population in the European data.
- Europe also had 48.166 million ornamental birds, 24.695 million small mammals, 17.638 million aquaria, and 10.729 million terraria in 2023.
- China had 124.1 million dogs and cats in 2024, split between 71.5 million cats and 52.6 million dogs.
- China’s cat population increased 2.5% year over year in 2024, faster than the 1.6% growth in its dog population.
- Japan’s cats and dogs made up 28.1% of its 55.8 million pet population in 2023, while smaller pets, birds, fish, and other animals added breadth to the pet care base.
- Germany counted 15.7 million cats and 10.5 million dogs in 2023, making it one of Europe’s largest companion-animal markets.
- France counted 14.9 million cats and 7.6 million dogs in 2023, giving cat food and premium wet food a strong structural base.
- The United Kingdom counted 11.7 million dogs and 11.4 million cats in 2023, creating an unusually balanced dog and cat food market.
- Italy counted 10.244 million cats, 8.766 million dogs, and 12.883 million ornamental birds in 2023, showing that non-dog/cat pet categories also remain visible in parts of Europe.
| Ownership signal | Pet food implication |
|---|---|
| More dog households | dry food, large-pack purchases, treats, dental products, and breed-size formulas. |
| More cat households | wet food, urinary care, hairball control, indoor-cat products, and smaller-pack premium formats. |
| Urban pet ownership | Raises demand for ecommerce, subscription plans, portion control, and odor-conscious formats. |
| Senior pet population | veterinary diets, joint support, weight management, and functional nutrition. |
| Multi-pet households | Increase replenishment frequency and make value packs, bundles, and auto-ship programs more attractive. |
Dog Food, Cat Food, and Other Pet Food Statistics
Dog food and cat food behave differently. Dog food usually brings more volume because dogs often eat larger portions and use larger packs. Cat food often brings premium value through wet formats, smaller portions, palatability, and specialized health claims.
Pet type benchmarks
- Canada’s dog food category held 66.4% of pet food market share in 2024, showing how dog food can dominate value in a mature market.
- Canadian cat food accounted for 31.8% of pet food market share in 2024, which still gives cats a large position even where dogs lead.
- Dog and cat food together represented 98.2% of Canadian pet food retail sales in 2024, while other pet foods accounted for only 1.8%.
- Fish food represented 0.8% of Canadian pet food sales, bird food 0.7%, and small mammal/reptile food 0.4%, confirming the long tail beyond dogs and cats.
- In China’s 2024 pet population, cats outnumbered dogs by 18.9 million animals, making cat food one of the country’s most important growth battlegrounds.
- Average annual consumption per dog in China reached USD 411 in 2024, while annual consumption per cat reached USD 281.
- Dog spending in China grew 3.0% in 2024, while cat spending grew 4.9%, again showing faster momentum on the cat side.
- India’s dog food segment still led pet food value, but cat food grew faster and is forecast to grow at a 19.2% CAGR from 2023 to 2028.
- India’s dog food segment is forecast to grow at a 14.3% CAGR from 2023 to 2028, indicating that both dog and cat food can expand rapidly when packaged feeding adoption rises.
| Pet type | Market role | Growth signal |
|---|---|---|
| Dogs | Largest volume base in many markets | Large portions, dry food, treats, dental care, and breed-size formulas support repeat demand. |
| Cats | High premium and wet-food relevance | Indoor cats, urinary care, palatability, and smaller portions support specialized products. |
| Birds, fish, and small pets | Smaller but specialized categories | Niche diets and specialty retail help maintain long-tail demand. |
| Multi-pet households | Higher basket and frequency | Bundles, auto-ship, and multi-format purchasing become more valuable. |
Pet type interpretation:
Dog food usually gives the market its volume base, while cat food can add premium value through wet food, health claims, and palatability. The strongest brands avoid treating pet food as one category and build formulas, pack sizes, and channels around animal-specific behavior.
Dry, Wet, Treats, and Specialty Pet Food Statistics
Format mix is where the market becomes most commercial. Dry food gives retailers predictable basket volume, wet food adds palatability and premium value, treats create extra trips and emotional buying, and veterinary diets attach the food decision to a health need. A brand that wins in only one format can still grow, but the strongest portfolios usually connect daily feeding with treats, health claims, and convenient replenishment.
Product format explains why market value can rise even when pet populations grow slowly. Dry food still provides the baseline because it is convenient, shelf-stable, and price efficient. Wet food, treats, veterinary diets, and fresh formats raise the value ceiling by giving owners more reasons to trade up.
Product format benchmarks
- The global wet pet food segment is valued at USD 25.1 billion in 2025, giving wet food a large base even before long-range growth is added.
- Wet pet food is forecast to reach USD 42.1 billion by 2035, with a 5.3% CAGR across 2025-2035.
- Dogs account for 58.4% of wet pet food demand in one segmentation, which shows wet food is not only a cat category even though cats are highly important to wet formats.
- Conventional wet pet food still holds 71.6% of the segment in 2025, indicating that natural and premium formats are growing from a smaller base rather than replacing mainstream products overnight.
- The vegan dog food market is valued at USD 6.5 billion in 2025 and forecast to reach USD 9.8 billion by 2030.
- Vegan dog food is projected at an 8.5% CAGR from 2025 to 2030, which makes it a faster-growth niche than many mainstream pet food segments.
- India’s market data shows dry pet food leading because of cost efficiency, shelf stability, and easier storage in a developing packaged pet food market.
- Mass pet food products still account for most Indian demand, showing that premiumization and packaged-food adoption can move together but not at the same pace.
- U.S. pet food and treats sales reached USD 65.8 billion in 2024, and treats remain important because they connect feeding with training, reward, indulgence, and owner emotion.
- U.S. pet food and treats were projected at USD 67.8 billion in 2025, keeping treats inside the largest pet industry product category.
| Product format | Main demand driver | Market implication |
|---|---|---|
| Dry food | Convenience, value, shelf life, and large-pack buying | Builds the volume baseline and supports mainstream dog food demand. |
| Wet food | Palatability, moisture, premium feeding, and cat relevance | Raises value per serving and helps brands create premium rituals. |
| Treats and snacks | Reward, training, dental care, and humanization | Creates frequent add-on purchases and emotional brand touchpoints. |
| Veterinary and functional diets | Health management and professional trust | Supports higher-value formulas tied to digestive, urinary, weight, and mobility needs. |
| Fresh, vegan, and specialty formats | Premium nutrition and lifestyle claims | Smaller base but faster growth where owners seek differentiation. |
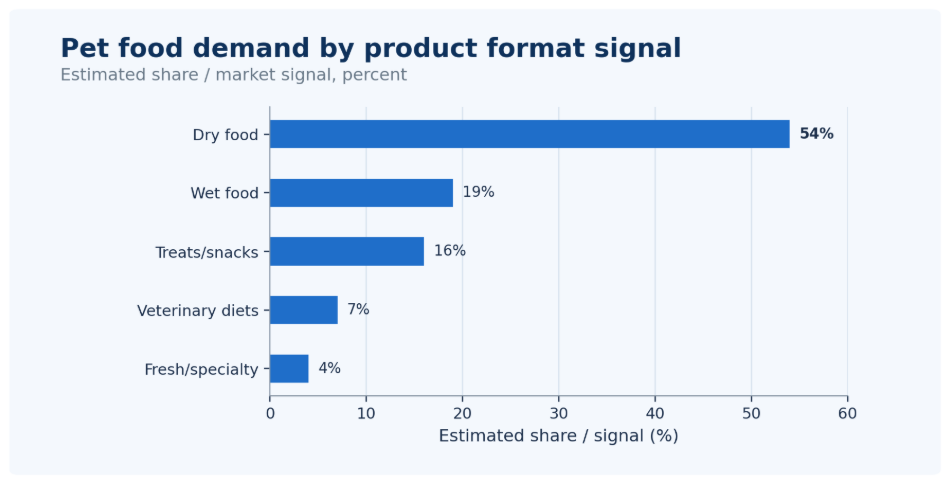
Figure 2. Product format matters because dry food supports volume, while wet food, treats, and specialty formulas often raise category value through premium use cases.
Ingredient and Nutrition Trends in Pet Food
Ingredient trends are important because owners increasingly compare pet food labels with the same attention they give to human food. Protein source, grains, digestibility, functional claims, and sustainability now influence how a product earns trust, especially in premium and ecommerce channels.
Nutrition and ingredient benchmarks
- The global pet food ingredients market is valued at USD 45.03 billion in 2025, showing the scale of the upstream ingredient base behind finished pet food.
- Pet food ingredient demand is estimated at USD 47.90 billion in 2026, which keeps ingredient sourcing closely tied to finished-product expansion.
- U.S. dog and cat food manufacturers purchased USD 13.2 billion in farm products in 2024, linking pet food directly to agriculture, meat, grain, and oilseed supply chains.
- Farm suppliers purchased USD 9.8 billion in materials and services linked to pet food ingredient demand, while the broader supply chain supported USD 7.6 billion in additional purchases.
- Animal-derived ingredients dominate India’s pet food market because protein value and palatability remain central to dog and cat acceptance.
- Vegan dog food’s USD 6.5 billion value in 2025 shows that alternative proteins have moved beyond concept status, even though they remain much smaller than mainstream animal-protein diets.
- The 8.5% CAGR forecast for vegan dog food from 2025 to 2030 suggests that sustainability and lifestyle positioning can outpace slower mainstream growth from a niche base.
- Fresh, functional, and veterinary-style diets increasingly compete on visible health needs such as digestion, skin and coat, joint support, weight control, dental care, and urinary health.
Nutrition trend interpretation:
Pet food buyers increasingly compare products by ingredient list, protein source, health claim, freshness, and convenience. Mainstream dry food remains essential, but the value upside often comes from diets that solve a visible owner concern or make feeding feel closer to human nutrition.
Pet Food Retail Channel Statistics
Channel statistics should be read as retention signals. Grocery and mass retail still matter because they put pet food in the same trip as household essentials, but ecommerce changes the economics by making repeat orders easier to automate. Veterinary and specialty channels add trust, while subscription and direct-to-consumer models give brands more control over customer data and reorder timing.
Retail channel behavior matters because pet food is a recurring purchase. The channel that wins replenishment also gains data, brand exposure, and pricing power. Grocery and mass retail keep the category accessible, pet specialty stores support advice and assortment, veterinary channels build clinical trust, and ecommerce makes auto-ship and subscription behavior easier.
Channel and purchasing signals
- Specialty stores lead Indian pet food retail because pet owners often rely on advice and trust when shifting from home food or table scraps to packaged pet food.
- India’s pet food retail value sales grew at a 20.7% CAGR from 2018 to 2023, a pace that reflects both category adoption and better retail availability.
- India’s pet food retail value sales are forecast to grow at a 15.0% CAGR from 2023 to 2028, showing that formal channels still have room to expand.
- U.S. pet food and treats formed the largest pet product category at USD 68.3 billion in 2024, giving retailers a high-frequency anchor category.
- U.S. pet food and treats sales grew 2.1% in 2024, which is slower than emerging-market growth but still meaningful on a very large base.
- UK Pet Food’s 103 member companies account for more than 90% of the UK market, showing how industry structure and retail coverage can be highly organized in mature markets.
- China’s first-tier cities accounted for 29% of pet owners in 2023, while third-tier and lower cities accounted for 30%, making channel strategy both premium urban and mass expansion at the same time.
- East China remained China’s largest pet food consumer market, while Western China held a 17% share and South China held 15%, showing that even one country needs region-specific channel planning.
| Channel decision | What to compare | Why it matters |
|---|---|---|
| Grocery and mass retail | Price, volume, repeat purchase, and household reach | Keeps mainstream dry food and value packs widely available. |
| Pet specialty | Premium mix, advice, assortment, and service | Supports higher-value diets and new product education. |
| Veterinary channel | Prescription diets, health claims, and professional trust | Raises credibility for therapeutic and functional formulas. |
| Ecommerce and auto-ship | Retention, subscription frequency, basket size, and data | Improves repeat-purchase visibility and reduces friction for heavy users. |
| DTC brands | Premium positioning, customer data, and subscription control | Helps smaller brands scale with differentiated formulas and storytelling. |
Regional Pet Food Market Intelligence
Regional differences are not only about market size. They reflect how owners buy, what they feed, which retailers they trust, how much space they have at home, and whether pets are treated mainly as companions, family members, or working animals. That is why the same global brand may need different pack sizes, price ladders, ingredients, and claims in North America, Europe, China, India, Brazil, and the Gulf markets.
Regional data is where pet food becomes more than a global total. North America gives the market its high-spend base. Europe adds a large pet population and strong regulatory structure. Asia-Pacific drives growth through China, India, South Korea, and Southeast Asia. Latin America is anchored by Brazil and Mexico, while the Middle East and Africa are smaller but gradually shifting toward packaged pet food and premium imports.
North America
- North America held 41.71% of the global market in 2025 in one benchmark, making it the largest regional demand base.
- The U.S. pet industry reached USD 158.0 billion in 2024, with pet food and treats representing USD 68.3 billion.
- U.S. manufacturers produced 9.8 million tons of dog and cat food in 2024, showing the industrial scale behind the domestic category.
- U.S. pet food manufacturers generated activity across 43 states, which makes the sector a national supply-chain contributor rather than a niche manufacturing category.
- Canada’s pet food market reached CAD 6.7 billion in retail sales in 2024, and dog and cat food represented 98.2% of the sector.
- Canadian dog and cat food sales grew at a 10.0% CAGR from 2019 to 2024, showing that even mature North American markets can post strong category growth when value and premiumization rise.
Europe
- Europe’s pet food industry value reached EUR 29.3 billion, supported by 9.1 million tonnes of pet food volume.
- Europe had more than 500 pet food companies and more than 400 manufacturing plants, giving the region a deep production and brand base.
- Europe counted 299.148 million pets in 2023, including 108.305 million cats and 89.615 million dogs.
- Grand View Research estimated Europe’s pet food market at USD 36.39 billion in 2024, with a 4.1% CAGR forecast for 2025-2030.
- Germany’s 37.7 million total pets, France’s 34.522 million, the UK’s 38.8 million, and Italy’s 36.578 million show that demand is spread across multiple large countries rather than one single European market.
- The UK pet food market was worth GBP 4.1 billion in 2024, and UK Pet Food members accounted for more than 90% of the market.
Asia-Pacific
- China’s pet food market reached USD 22.2 billion in 2024 and grew 9.2% year over year, making it one of the most important growth markets globally.
- China’s pet food market CAGR from 2013 to 2024 was 22.4%, showing how quickly packaged pet food adoption expanded over the past decade.
- India’s pet food market was valued at USD 2.4 billion in 2024 and is forecast to reach USD 4.6 billion by 2033.
- India’s retail pet food value sales are forecast to reach USD 1.2688 billion by 2028, up from USD 730.1 million in 2024.
- Japan imported 260,000 metric tons of pet food in FY2019, equal to 44% of domestic pet food consumption, showing the role imports play in a mature premium market.
- South Korea’s pet food market is estimated at USD 1.86 billion in 2026 and forecast to reach USD 2.81 billion by 2031 at an 8.60% CAGR.
Latin America
- Latin America imported USD 259 million of dog and cat food in 2023, and imports increased 75% from 2020 to 2023.
- U.S. dog and cat food exports to Latin America reached USD 162.0 million in 2024, rising 11% year over year.
- Brazil imported USD 12.25 million of dog and cat food in 2023 and more than 3,000 tons of product.
- Brazil’s pet sector imports reached USD 20.1 million in 2024, and pet food represented nearly all of that value.
- Brazil’s top five suppliers accounted for close to 91% of dog and cat food imports, showing how concentrated supplier relationships can be in import-led premium channels.
Middle East and Africa
The Middle East and Africa remain smaller than North America, Europe, and Asia-Pacific, but packaged pet food adoption is rising as urban households, specialty retail, veterinary access, and imported premium brands grow. UAE and Saudi Arabia are most relevant for imported premium products, while South Africa acts as a broader regional anchor. In these markets, the transition from informal feeding to packaged pet food matters as much as premiumization.
| Region | Pet food market implication |
|---|---|
| North America | Mature, high-spend market led by premium formulas, treats, ecommerce, and functional nutrition. |
| Europe | Large pet population with strong regulation, manufacturing depth, sustainability pressure, and premium demand. |
| Asia-Pacific | Fast growth from China, India, South Korea, ecommerce adoption, and packaged feeding shifts. |
| Latin America | Brazil and Mexico anchor demand, while imports and premium urban channels add growth. |
| Middle East & Africa | Smaller base with rising packaged pet food, imported premium products, and specialty retail. |
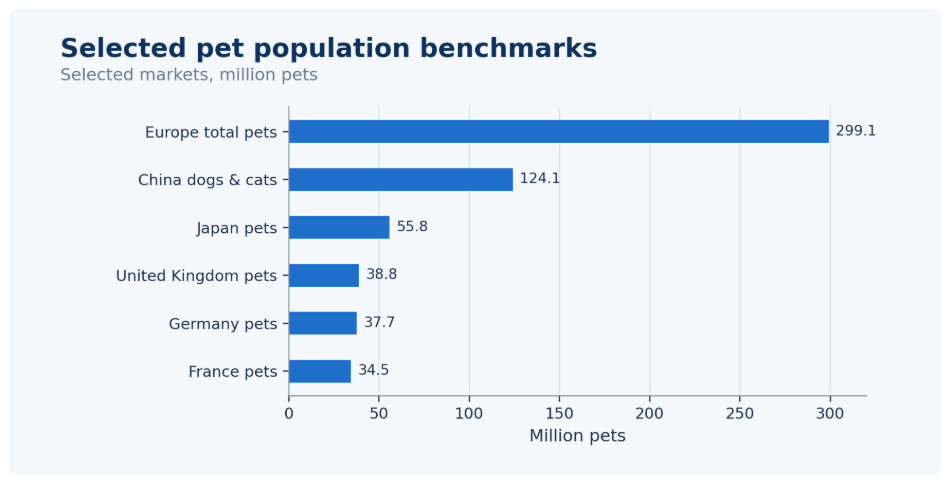
Figure 3. Regional pet food demand should be measured by pet ownership, spending per pet, channel maturity, and premium nutrition adoption rather than by population alone.
Country-Level Pet Food Statistics
Country-level data adds a practical layer to the global view. The United States shows what a mature, high-spend market looks like. China and India show how packaged pet food adoption can rise with urban ownership and ecommerce access. Europe shows the role of regulation and sustainability, while Brazil and Mexico show how large pet populations can support mainstream dry food and gradual premium growth.
Country-level statistics prevent the market from becoming too blended. The U.S. is a high-spend benchmark, China is a growth and production story, Europe contains several large country markets, and India shows how fast retail value can expand when packaged pet food adoption increases.
Major mature and high-growth markets
- The United States generated USD 68.3 billion in pet food and treats spending in 2024 and projected USD 67.8 billion in the same category for 2025.
- China’s pet food market reached USD 22.2 billion in 2024, with pet food representing 52.8% of its dog and cat consumer market.
- India’s pet food retail sales rose from USD 245.4 million in 2018 to USD 730.1 million in 2024 and are forecast to reach USD 1.2688 billion by 2028.
- Japan’s domestic cat and dog food consumption was around 593,000 metric tons in FY2019, and pet food sales exceeded USD 3 billion.
- South Korea imported USD 347 million of pet food in 2022, up from USD 239 million in 2018, equal to a 45% increase.
- Canada’s dog food share of 66.4% and cat food share of 31.8% in 2024 show how clearly dogs and cats control the Canadian pet food mix.
- France’s pet food market was valued at USD 5.76 billion in 2023 and is projected to reach USD 9.75 billion by 2033 at a 5.4% CAGR.
- The UK pet food market was estimated at USD 3.01 billion in 2024 by one model, while UK Pet Food reported GBP 4.1 billion in market value.
- Germany had 15.7 million cats and 10.5 million dogs in 2023, giving it one of Europe’s strongest pet population bases.
- Brazil’s pet sector import growth reached 63.9% in 2024, a sign that imported premium and specialty products are becoming more visible.
- India exported USD 73.02 million in retail dog and cat food in 2024 while importing USD 137.47 million, making it both a growing domestic and trade market.
- China imported USD 427.24 million of retail dog and cat food in the first ten months of 2024, although that was down 17% year over year.
| Country | Market role | Pet food relevance |
|---|---|---|
| United States | Largest high-spend pet care market | Strong premium, treats, ecommerce, veterinary diets, and manufacturing scale. |
| China | Major growth and production market | Large cat population, fast historical CAGR, domestic capacity, and import demand. |
| Germany | European demand center | Large cat and dog population supports premium and mainstream formats. |
| France | Premium European market | Projected growth from USD 5.76 billion in 2023 to USD 9.75 billion by 2033. |
| India | Fast-growing packaged pet food market | Retail value growth, specialty stores, dry food, and urban ownership expansion. |
| Brazil | Latin American anchor | Import growth and urban premium demand support regional opportunity. |
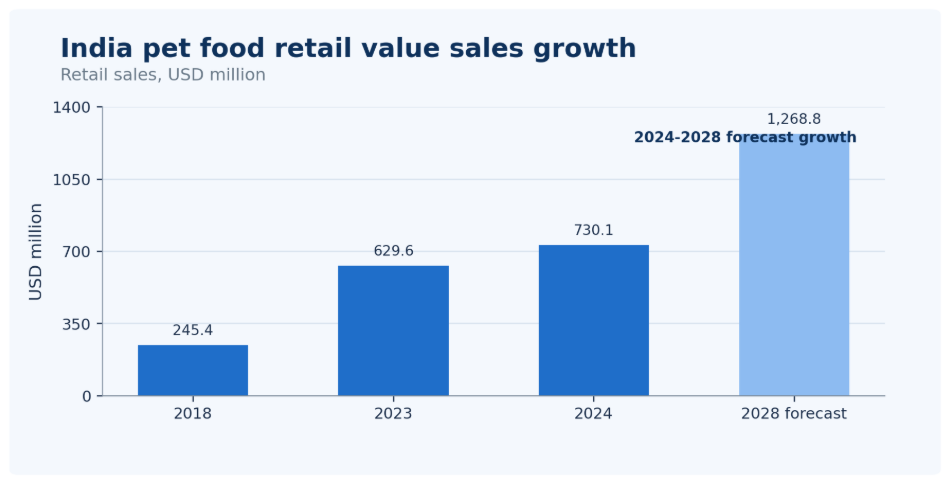
Figure 4. India’s pet food retail sales show how quickly packaged pet food adoption can expand when urban ownership, specialty retail, and category availability improve.
Pet Food Trade and Supply Chain Statistics
Pet food is sold as a branded consumer product, but it depends on animal proteins, grains, oils, vitamins, packaging, extrusion capacity, canning or pouch lines, import rules, and retail logistics. Premiumization can lift value, yet it can also make sourcing more complex.
Trade and supply-chain benchmarks
- U.S. pet food exports reached USD 2.49 billion in 2024 and grew 3.7% year over year.
- U.S. retail dog and cat food exports to China reached USD 296.6 million in 2024 and rose 15% year over year.
- The U.S. accounted for over 69% of China’s imported pet food supplier market in early 2024, giving U.S. brands a strong position in China’s premium import channel.
- China has 200 certified pet food manufacturers and 1.12 million tons of certified manufacturing capacity.
- China produced 1.9 million metric tons of pet food in 2025, with output growth of 17.9%.
- Hebei and Shandong together account for more than 60% of China’s pet food production, showing provincial concentration in domestic manufacturing.
- Japan imported 260,000 metric tons of pet food in FY2019, with Thailand, the U.S., and France together making up roughly 65% of imports.
- South Korea’s import market is supplier-diverse but concentrated at the top, with China holding 32.6%, the U.S. 15.9%, and Thailand 12.2% of import value in 2023.
- Latin America’s dog and cat food imports rose 75% from 2020 to 2023, indicating a stronger role for cross-border branded products.
- Brazil imported dog and cat food from 12 countries in 2023, but its top five suppliers accounted for close to 91% of the import value.
| Supply-chain signal | What it shows | Why it matters |
|---|---|---|
| Pet food exports | Cross-border demand for branded or specialized formulas | which producers can compete beyond domestic channels. |
| Protein ingredient costs | Exposure to meat, poultry, fish, grains, and plant proteins | Directly affects recipe cost, pricing, and margin. |
| Packaging costs | Dependence on bags, pouches, cans, cartons, and labels | Impacts dry, wet, treat, and premium packaging economics. |
| Production concentration | Manufacturing capacity clustered by country or province | Creates efficiency but also disruption exposure. |
| Fresh/frozen logistics | Need for cold chain and tighter fulfillment | Raises complexity for premium formats. |
Supply-chain interpretation:
Pet food demand is consumer-led, but profitability is supply-chain-led. A brand can grow sales through premium formats and ecommerce, yet still lose margin if protein inputs, packaging, freight, or import costs move against it.
Premium Pet Food and Humanization Statistics
Premiumization is strongest when the owner can see a clear reason to pay more. That reason may be a visible health benefit, a trusted protein source, a veterinary recommendation, easier feeding, or the emotional comfort of choosing a product that feels closer to human food standards. Premium claims without trust can fade quickly, but claims attached to digestion, coat health, senior pets, or breed needs tend to hold more value.
Premiumization does not mean every owner leaves mainstream dry food. It means more owners are willing to pay extra when a product solves a health need, offers convenience, carries a trusted ingredient claim, or fits the emotional idea of caring for a family member.
Premium and health-led demand signals
- Wet pet food’s USD 25.1 billion value in 2025 shows that premium feeding occasions already form a large global segment.
- Wet pet food’s forecast of USD 42.1 billion by 2035 implies that premium palatability, moisture, and portion-based feeding can keep adding category value.
- Vegan dog food’s 8.5% CAGR forecast from 2025 to 2030 shows how sustainability and lifestyle claims can grow from a smaller base.
- U.S. vet care and product sales reached USD 41.0 billion in 2024, which supports the wider health-led ecosystem around veterinary diets and functional feeding.
- U.S. supplies, live animals, and OTC medicine spending reached USD 34.4 billion in 2024, showing that owners spend heavily on pet care beyond food alone.
- Whitebridge Pet Brands generated about USD 325 million in U.S. retail sales before its acquisition, showing why premium cat, treat, and specialty brands attract large food companies.
- General Mills agreed to acquire Whitebridge Pet Brands for USD 1.45 billion and previously bought Blue Buffalo for USD 8.00 billion in 2018, confirming the strategic value of premium pet food assets.
- Japan’s top three companies controlled 56.2% of the cat food sector and 50.4% of the dog food sector in 2022, showing that premium and mature markets can still be concentrated around trusted brands.
- China’s average annual consumption per dog reached USD 411 and per cat reached USD 281 in 2024, making spend per pet a critical premiumization metric.
Premiumization rule:
Premium growth is strongest when a product gives the owner a reason to believe the higher price is connected to health, convenience, trust, or emotional care. The most durable premium claims are easier to understand, easy to repurchase, and visible in the pet’s daily routine.
Pet Food Market Risks and Constraints
The pet food market has strong repeat demand, but it is not insulated from pressure. Inflation can change basket size, ingredient costs can compress margins, recalls can damage trust, and crowded premium claims can make differentiation harder.
Risk benchmarks and pressure points
- U.S. dog and cat food manufacturers purchased USD 13.2 billion in farm products in 2024, creating clear exposure to agricultural input costs.
- The broader U.S. pet food supply chain supported USD 7.6 billion in additional materials, services, equipment, and labor purchases, which means cost pressure can move through many supplier layers.
- China’s pet food imports were down 17% year over year in the first ten months of 2024, showing that import channels can shift even when domestic pet food consumption remains large.
- Brazil’s top five suppliers accounted for close to 91% of dog and cat food imports in 2023, creating concentration risk in a market that depends on imported products for some premium needs.
- Japan relied on imports for 44% of domestic pet food consumption in FY2019, making currency, freight, tariffs, and supplier concentration relevant to price and assortment.
- Premium claim fatigue is a commercial risk because grain-free, natural, human-grade, functional, and fresh claims can blur together if brands do not connect them to clear pet-owner benefits.
- Pet food safety and recall risk remains unusually important because the product is tied to animal health and owner trust, not only taste or convenience.
| Risk area | What to track | Why it matters |
|---|---|---|
| Ingredient inflation | Meat, poultry, fish, grains, oils, vitamins, and packaging | Affects recipe cost, margin, and shelf price. |
| Safety and recalls | Contamination, labeling, traceability, and quality controls | Protects owner trust and brand reputation. |
| Premium claim fatigue | Natural, grain-free, human-grade, fresh, and functional claims | Makes differentiation harder when many products sound similar. |
| Channel pressure | Retailer margin, ecommerce fees, promotion cost, and subscription churn | Affects profitability even when sales volume rises. |
| Regulation and import rules | Labeling, nutrition standards, import approvals, and feed regulations | Shapes product development and market access. |
Pet Food Market Diagnostic
A practical pet food scorecard connects the statistics to decisions. The strongest question is not only whether the market is growing. It is where growth comes from, which pets and product formats create value, and which costs or channels can weaken profit.
| Problem area | Core signals to measure | Useful benchmark |
|---|---|---|
| Market growth | Market value, CAGR, category spend, and forecast range | Global values range from USD 128.94 billion to USD 208.55 billion in 2025 depending on definition. |
| Pet ownership | Dog/cat population, pet-owning households, and pet spending | The U.S. has 95 million pet-owning households, while Europe has 299.148 million pets. |
| Product mix | Dry, wet, treats, veterinary, fresh, and specialty formats | Wet pet food is a USD 25.1 billion segment in 2025 and forecast at USD 42.1 billion by 2035. |
| Regional demand | North America, Europe, Asia-Pacific, Latin America, and emerging markets | North America holds 41.71% share, while China and India show higher growth momentum. |
| Channel shift | Ecommerce, specialty retail, grocery, mass, vet, and DTC | Recurring purchases make subscription, auto-ship, and specialty advice strategically important. |
| Premiumization | Functional, natural, fresh, veterinary, and sustainability-led formulas | Vegan dog food is projected at 8.5% CAGR from 2025 to 2030. |
| Supply chain | Protein inputs, packaging, imports, production capacity, and logistics | U.S. manufacturers purchased USD 13.2 billion in farm products in 2024. |
90-Day Pet Food Market Review Plan
A market review becomes more useful when it is organized as a decision cycle. Pet food leaders need to compare ownership, category mix, regional demand, and cost exposure before committing to a product launch, channel strategy, or sourcing plan.
| Timing | What to do | Output |
|---|---|---|
| Days 1-30 | Review global market value, pet population, product format, and regional data. | Baseline demand map by pet type, format, and region. |
| Days 31-60 | Compare dog/cat demand, dry/wet/treats mix, ecommerce behavior, and specialty retail signals. | Category opportunity map showing where value is likely to grow. |
| Days 61-90 | Review premiumization, ingredient costs, trade exposure, production capacity, and country-level growth. | Practical scorecard for brand, retail, sourcing, and investment decisions. |
Planning principle
The strongest pet food analysis compares pet population, spend per pet, product format, channel behavior, regional demand, and supply-chain exposure. The most useful numbers are the ones that explain profitable category growth rather than only total market size.
Metrics Pet Food Leaders Should Track
A pet food dashboard should be detailed enough to locate where value is coming from without becoming a vanity board. Market value matters, but so do ownership, format mix, channel retention, spend per pet, and input cost pressure.
| Metric | Why it matters |
|---|---|
| Global pet food market value | total category scale and the range between broad and conservative market definitions. |
| CAGR | whether growth is coming from steady expansion or faster premium/category adoption. |
| Pet ownership rate | Defines the household base for repeat food purchases. |
| Dog and cat population | Explains volume potential and pet-type category mix. |
| Spend per pet | premiumization and willingness to trade up. |
| Dry versus wet food share | the balance between volume baseline and premium feeding occasions. |
| Treats and snacks sales | Captures humanization, reward behavior, and add-on purchases. |
| Ecommerce and auto-ship share | Measures channel migration and repeat-purchase retention. |
| Veterinary diet demand | Tracks health-led premium and trust-driven nutrition. |
| Ingredient cost index | margin pressure from proteins, grains, oils, vitamins, and packaging. |
| Regional market growth | where geographic opportunity is strongest. |
Global Pet Food Market Statistics FAQ
Common questions
How big is the global pet food market?
The global pet food market is valued at USD 208.55 billion in 2025 in one upper-range model and USD 128.94 billion in a narrower model. Another revenue benchmark places worldwide pet food revenue at USD 161.72 billion in 2026, so the best reading is a range rather than one single figure.
What is the forecast for the pet food market?
One upper-range model forecasts USD 324.17 billion by 2031 at a 7.46% CAGR, while a more conservative model forecasts USD 199.50 billion by 2034 at a 5.05% CAGR. Both point to continued expansion.
Which country spends the most on pet food?
The United States is the clearest high-spend benchmark. U.S. pet food and treats spending reached USD 68.3 billion in 2024, and 95 million U.S. households owned a pet in 2025.
Is dog food bigger than cat food?
Dog food usually has the larger volume base because dogs eat larger portions and use more dry food, but cat food is highly important for wet food, palatability, urinary care, and premium formats. Canada shows this split clearly, with dog food at 66.4% and cat food at 31.8% of pet food share in 2024.
Which product format is most important?
Dry food remains the mainstream volume format because it is convenient and shelf stable. Wet food, treats, veterinary diets, and specialty formats often drive higher value. Wet pet food alone is valued at USD 25.1 billion in 2025 and forecast at USD 42.1 billion by 2035.
Which region is growing fastest?
Asia-Pacific carries some of the strongest growth signals. China reached USD 22.2 billion in pet food value in 2024, while India is projected to grow from USD 2.4 billion in 2024 to USD 4.6 billion by 2033.
Why is premium pet food growing?
Premium growth comes from pet humanization, health concerns, specialized diets, ingredient claims, ecommerce access, and the willingness of owners to spend more when a product feels healthier or more convenient.
What are the biggest risks in the pet food market?
The main risks are ingredient inflation, protein and packaging costs, product safety, recalls, premium claim fatigue, import exposure, and channel margin pressure.
What metrics should pet food companies track?
Companies should track market value, pet ownership, dog and cat population, spend per pet, dry and wet food mix, treats, veterinary diets, ecommerce retention, ingredient costs, regional growth, and trade exposure.
Final Takeaway
Pet food is now a global consumer market built on pet ownership, humanization, nutrition, and repeat household purchasing. The category has a large mature base in North America and Europe, fast-growth signals in Asia-Pacific, and rising packaged-food adoption in emerging markets. Dogs still give the market much of its volume, while cats, wet food, treats, functional diets, and specialty formats help raise value.
The market should not be read through one global number. A better view separates pet type, format, region, country, channel, and supply chain. The same market can show slow pet population growth in Japan, high spend in the United States, fast retail adoption in India, rising cat ownership in China, and strong manufacturing depth in Europe. Each signal points to a different brand, retail, or sourcing decision.
For pet food brands, retailers, ingredient suppliers, and investors, the practical goal is to follow the numbers that explain profitable growth. That means tracking pet-owning households, dog and cat populations, dry and wet food mix, treats and premium diets, ecommerce and specialty retail, veterinary influence, ingredient costs, production capacity, import exposure, and regional demand. The strongest opportunities sit where repeat purchase, owner trust, health-led claims, and supply-chain control work together.