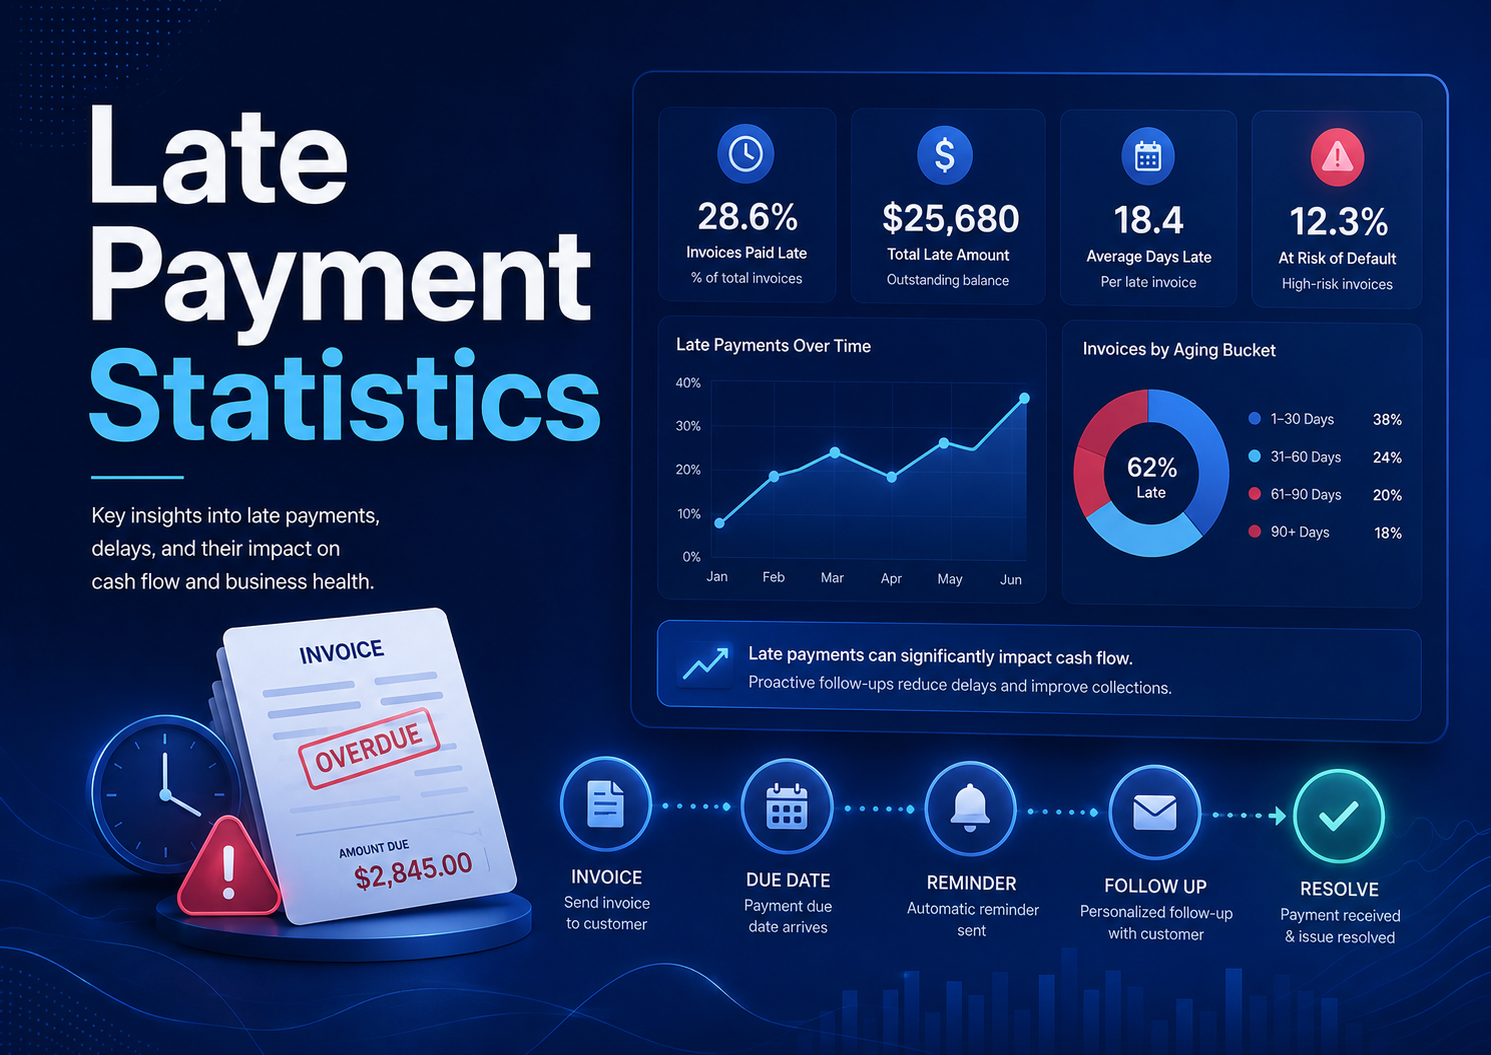
Late payments are easy to describe as a collections problem, but the data shows something broader. A delayed invoice can change payroll timing, force a business to lean on credit cards, slow supplier payments, make hiring more cautious, and turn a good customer relationship into a credit-risk discussion. The invoice may be one document, but the delay touches cash flow, operations, sales, finance, and customer management at the same time.
The headline numbers explain why late payment deserves that wider treatment. In the U.S., QuickBooks reports that 56% of surveyed small businesses are owed money from unpaid invoices, and affected firms are waiting on an average of $17,500. The U.K. comparison is heavier: 62% of surveyed businesses are owed money, and affected firms report an average unpaid amount of £21,400. Those are not abstract receivables. They are bills that cannot be paid, work that may be delayed, and decisions that become harder when expected cash does not arrive.
Late payment is best understood as an invoice-to-cash system. The statistics show where the pressure starts, how it differs by region, when overdue invoices become credit risk, and which actions can prevent routine delays from becoming financing problems. The most useful numbers support a practical business reading of late payment rather than a disconnected list of benchmarks.
Executive Late Payment Benchmarks
These are the statistics that define the late-payment problem. They show how often small businesses are owed money, how far invoices slip past the due date, how much time teams spend chasing, and why late payment can become a financing problem long before an invoice is written off.
The numbers that define the late-payment problem
• In the U.S. small-business sample, unpaid invoices affect 56% of firms, while the average affected business is waiting on $17,500.
• Invoice aging is already visible in the U.S. data: 47% of surveyed businesses have invoices more than 30 days overdue, with the average business reporting 10% of invoices in that bucket.
• U.K. small businesses show an even heavier unpaid-invoice pattern, with 62% owed money and an average outstanding amount of £21,400 among affected firms.
• Invoice aging is also deeper in the U.K. sample, where 54% of firms have invoices more than 30 days overdue and the average 30+ day share is 11%.
• Country timing data puts Canada at 9.7 days late on average, followed by the U.K. at 8.0 days, the U.S. at 7.8 days, Australia at 6.6 days, and New Zealand at 4.5 days.
• Businesses with higher overdue invoice volume report cash-flow problems at 50%, while the lower-overdue group reports 34%.
• Payment terms shape the pressure too: firms using longer terms report cash-flow problems at 60%, compared with 40% among firms using immediate terms.
• Across Europe, 52% of companies reported difficulties because of late payments in 2024, a rise of 5 percentage points from 2023 and 10 percentage points from 2021.
• The spread is broad, not local: late-payment difficulty increased in 19 Member States across the EU.
• In the U.K., late payments are estimated to contribute to 14,000 business closures per year, roughly 38 closures per day.
• Affected U.K. businesses spend about 86 hours per year chasing late invoices, while the economy-wide chasing burden is estimated at 133 million hours annually.
• B2B credit data shows overdue invoice shares of 47% in Western Europe, 51% in the U.K., 40% in North America, and 53% in Central and Eastern Europe.
Editorial readout The late-payment problem has three layers. The first is missing cash: invoices that should already be paid. The second is operational drag: hours spent chasing, reconciling, and renegotiating. The third is credit risk: accounts that move from a short delay into 30+, 60+, or 90+ day aging. A good late-payment scorecard keeps those layers separate because each one needs a different response.
Why Late Payment Is More Than A Collections Issue
A collection email is only the visible part of the problem. Behind it are the terms that were agreed, the invoice details that were sent, the customer approval process, the payment method, the reminder cadence, and the business decision about whether to keep supplying a slow-paying account. When late payment is treated only as an AR inbox task, the business misses the earlier points where the delay could have been prevented.
The clearest example is the difference between a customer who pays a few days late and a customer that regularly enters the 30+ day bucket. Both are late, but they do not carry the same risk. A customer paying 4.5 days late on average in New Zealand-style timing data may be creating small forecast noise. A buyer that reaches 60 or 90 days late changes credit exposure, staff workload, and management decisions.
How to read the statistics as operating signals
• An unpaid-invoice rate above half of surveyed firms means late payment belongs in the monthly operating review, not only the collections queue.
• An average unpaid balance of $17,500 or £21,400 should be compared with payroll, supplier bills, tax payments, and the company’s cash buffer.
• A 30+ day overdue share near 10% or 11% is most useful when the business identifies which customers and invoice types drive that share.
• A country average of 9.7 days late can still hide customers that pay early and customers that consistently push invoices into serious aging.
• A regional overdue share of 53% in CEE does not mean every invoice is risky; it means businesses need stronger customer segmentation and credit review.
• A bad-debt share of 5% to 8% is far smaller than the overdue share, which proves why overdue and write-off dashboards should be separate.
• If chasing takes 86 hours per affected business each year, late payment is consuming labor that could otherwise support sales, service, or finance work.
• When late payments are tied to 14,000 annual business closures, the issue has to be read as a survival risk for vulnerable firms, not merely as an accounting delay.
| Late-payment signal | What it usually means | Action to consider |
|---|---|---|
| A few days late | Normal timing friction or internal buyer process | Use automatic reminders and make payment easy |
| Repeated 30+ day invoices | Customer pattern, approval issue, or weak payment discipline | Assign owner, confirm blocker, and review terms. |
| Large balance beyond 60 days | Credit exposure is rising | Escalate, review credit hold, and document payment commitment. |
| High chasing time | Manual process is absorbing finance capacity | Improve invoice data, reminders, and customer segmentation. |
| Bad debt beginning to rise | Delays are becoming losses | Tighten customer screening and escalation thresholds. |
Unpaid Invoices And The Cash-Flow Gap
The simplest late-payment statistic is the amount owed, but the business impact depends on what that amount prevents. A firm with a large reserve may absorb a late invoice with annoyance. A firm that depends on weekly collections may delay supplier payments, put more spend on credit cards, hold off on hiring, or raise prices because customer payments are not arriving when expected.
This is why the QuickBooks data matters beyond the headline unpaid balance. The U.S. businesses most affected by overdue invoices report cash-flow problems at 50%, compared with 34% among businesses with lower overdue volume. That 16 percentage point gap turns late payment into an operating decision: either the business reduces overdue exposure, or it finds another way to finance the missing cash.
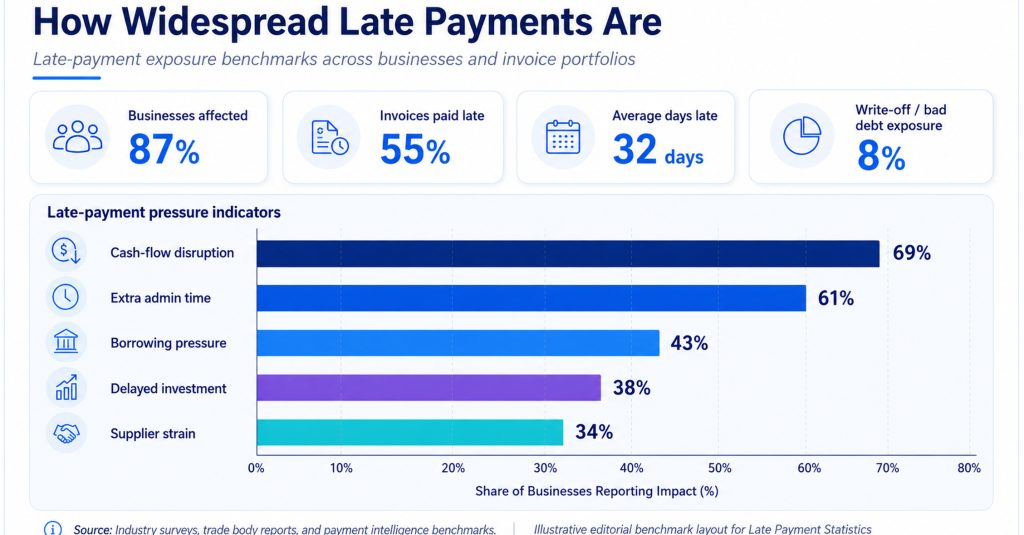
Figure 1. U.S. and U.K. small businesses both report widespread unpaid invoice exposure, with the U.K. showing higher unpaid-invoice and 30+ day overdue shares.
Cash-flow pressure points
• More affected U.S. businesses report raising prices at 30%, compared with 21% among less affected businesses.
• The average price increase is steeper in the more affected group at 16%, compared with 10% for less affected firms.
• Loan use is also higher among more affected firms, at 21% versus 11%.
• Line-of-credit use reaches 31% among more affected firms, compared with 21% in the less affected group.
• Business credit-card use is common in both groups, but the more affected group reports 54% usage compared with 46% among less affected firms.
• A rising reliance on credit cards appears in 30% of more affected businesses, compared with 17% in the less affected group.
• When longer terms are associated with 60% cash-flow problem rates, payment policy becomes part of working-capital management.
• Businesses using 90-day terms charge 40% of monthly expenses to credit cards, compared with 33% among firms using immediate terms.
Cash-flow readout Late payment does not always show up as a single dramatic event. More often it appears as a series of substitutions: a credit-card balance instead of a paid invoice, a delayed supplier payment instead of a clean cash cycle, or a price increase that tries to offset the cost of slow collections. That is why late-payment reporting should sit beside cash forecasting.
Regional Late-Payment Patterns
Regional data is useful because payment culture, regulation, buyer behavior, and invoice approval systems differ by market. A reminder cadence that works in one country may be too slow in another, while a term that feels normal for one customer base may create avoidable financing pressure for another.
The five-country timing comparison shows that late payment is not evenly distributed. Canada’s 9.7-day average lateness is more than double New Zealand’s 4.5-day average. The U.K. and U.S. sit close together at 8.0 and 7.8 days late, while Australia sits between the two extremes at 6.6 days. Those gaps may look small on a single invoice, but they become material when repeated across hundreds or thousands of invoices.
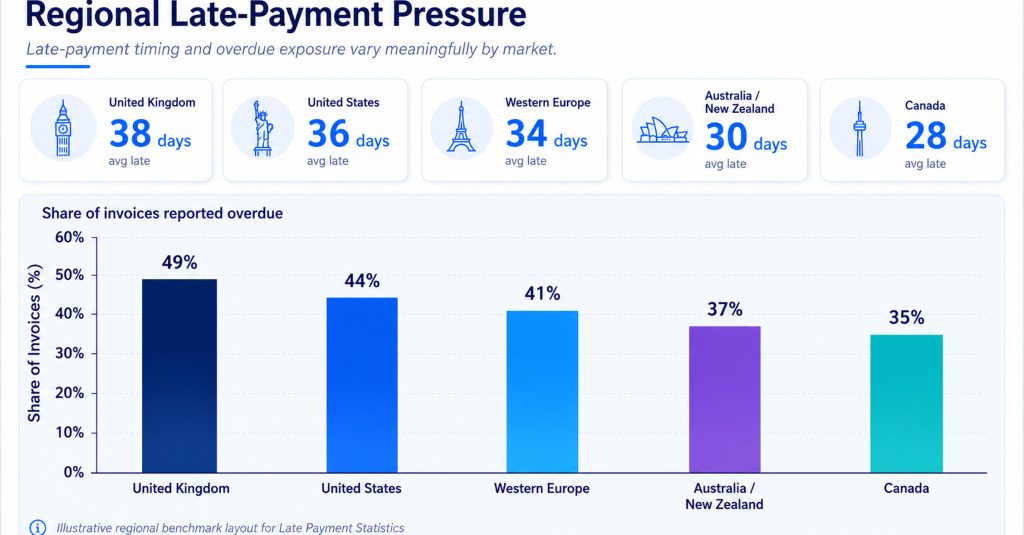
Figure 2. Average days late varies by country, which is why invoice reminders, cash forecasts, and escalation timing should not rely on one global rule.
What the country comparisons suggest
• Canada’s 9.7-day average lateness suggests businesses there may need earlier receipt confirmation and tighter due-date monitoring.
• The U.K.’s 8.0-day average lateness fits with the broader U.K. data showing 62% unpaid-invoice exposure and 54%30+ day exposure.
• The U.S. average of 7.8 days late is paired with a sizable unpaid-invoice burden, including 56% of surveyed businesses being owed money.
• Australia’s 6.6-day average lateness is lower than the U.S. and U.K. figures, but still large enough to affect rolling cash forecasts.
• New Zealand’s 4.5-day average lateness is the lowest in the five-country comparison, yet still requires reminders for firms operating with tight margins.
• Europe’s 52% late-payment difficulty rate shows that the problem remains broad even where policy and reporting have received attention.
• Because late-payment difficulties rose in 19 EU Member States, businesses operating across Europe should avoid assuming one country pattern explains the whole region.
• Regional B2B overdue shares of 40% to 53% show that country timing and trade-credit risk need to be reviewed together.
| Region or country | Useful signal | Practical implication |
|---|---|---|
| Canada | 9.7 days late on average | Build more buffer into cash forecasts and use earlier confirmations. |
| United Kingdom | 62% unpaid-invoice exposure | Treat late payment as both cash-flow and policy risk. |
| United States | 47% with 30+ day overdue invoices | Segment accounts before the 30-day bucket grows. |
| Australia | 6.6 days late on average | Use reminders to prevent small delays from becoming recurring habits. |
| European Union | 52% report late-payment difficulties | Country-by-country terms and escalation rules may be necessary. |
| CEE | 53% B2B overdue invoice share | Track customer credit exposure and recovery probability closely. |
When Overdue Invoices Become Credit Risk
Overdue invoices are not the same as bad debts. Many late invoices are paid after a reminder, a customer approval step, or a short cash squeeze. The risk rises when late invoices become predictable, repeated, concentrated in a few accounts, or connected to broken promises. That is the point where a company needs credit control, not only polite follow-up.
Regional B2B data makes this distinction clear. Overdue invoice shares can be large, from 40% in North America to 53% in CEE, but bad-debt shares are much lower, ranging from 5% to 8%. The gap matters. It tells finance teams not to panic over every late invoice, but also not to ignore the accounts that keep moving deeper into aging.
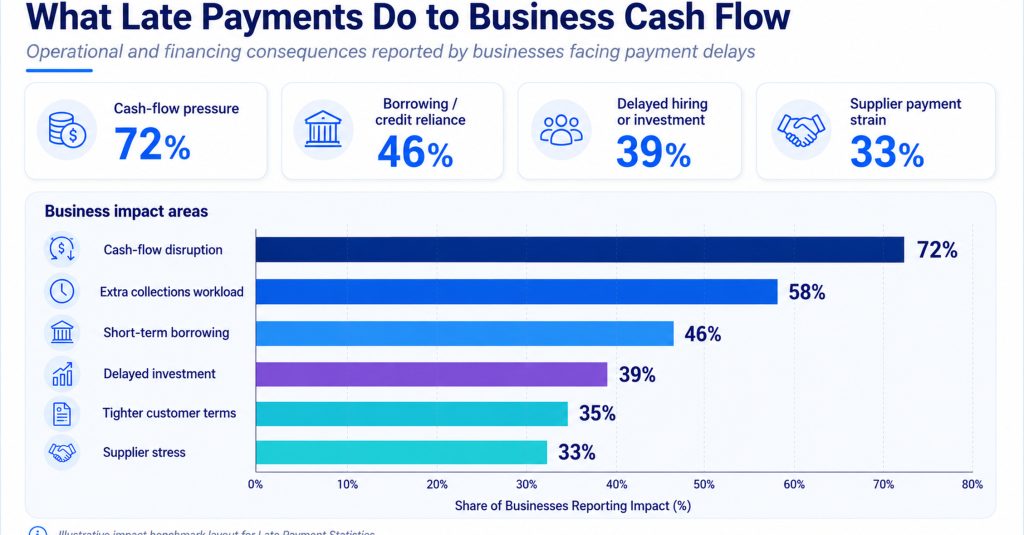
Figure 3. Overdue invoice shares are far larger than bad-debt shares, so late-payment dashboards should separate recoverable aging from likely write-off risk.
Credit-risk signals to separate from routine delay
• Western Europe shows 47% overdue B2B invoices and a 6% bad-debt share, suggesting many invoices recover but still absorb time and working capital.
• The U.K. B2B pattern is heavier, with 51% overdue invoices and 7% bad debt.
• North America’s 40% overdue share is lower than the European and CEE figures, but a 5% bad-debt share still makes risk scoring necessary.
• CEE shows the highest overdue share in this comparison at 53%, paired with an 8% bad-debt share.
• A customer that repeatedly passes 30 days late should be reviewed differently from a customer that occasionally slips by a few days.
• Accounts that reach 60+ days late should trigger documented ownership, not just another general reminder.
• An invoice approaching 90+ days late should prompt decisions about service continuation, credit hold, collections, or negotiated payment plan.
• Large-company watchlists showing buyers paying after 80+ days are useful reminders that customer size does not always equal payment reliability.
Credit-risk readout Late-payment management becomes stronger when the business separates “late but likely recoverable” from “late and deteriorating.” The first group needs reminder design and payment convenience. The second needs owner escalation, credit limits, future-order controls, and written recovery decisions.
The Human Cost Of Chasing Late Payments
Late payment also creates a hidden labor cost. Someone has to check the aging report, find the right contact, resend the invoice, answer questions, record promises, follow up again, and decide when to escalate. That work rarely appears on an invoice, but the time cost can be enormous.
The U.K. estimate of 86 hours per affected business per year makes the point concrete. That is more than two full working weeks spent on chasing rather than selling, serving customers, analyzing finance, or improving operations. At the economy level, the estimated 133 million hours of annual chasing time shows why late payment is also a productivity issue.
Where chasing time is usually wasted
• Manual follow-up becomes expensive when the same customer needs repeated reminders across many small invoices.
• A single overdue invoice with a large balance may justify senior attention earlier than a low-value invoice with a minor delay.
• If the business spends 86 hours per year chasing late payments, even a small reduction in repeat reminders can free meaningful staff time.
• A company with 10% or 11% of invoices in the 30+ day bucket should know whether those invoices come from a few customers or many small delays.
• When payment difficulties affect 52% of European firms, chasing work is not an outlier activity; it is part of normal credit management.
• Businesses that wait until invoices are 30+ days late before acting may lose the chance to fix simple approval or contact problems earlier.
• Broken promise-to-pay dates should be tracked because they separate forgetful customers from customers with unreliable payment behavior.
• A customer that delays payment after every project should not receive the same reminder path as a customer with one isolated late invoice.
| Chasing problem | What it usually means | Better response |
|---|---|---|
| Wrong contact or lost invoice | The customer may not be ignoring the bill | Confirm receipt and update billing contacts before due date. |
| Slow approval | The invoice may be stuck inside the customer’s workflow | Ask for approver name, PO status, and expected payment date. |
| Repeated small delays | The customer has normalized late payment | Use earlier reminders and review terms. |
| Large overdue balance | Cash-flow and credit exposure are rising | Escalate to account owner or management. |
| Broken commitment | The next reminder needs stronger documentation | Record promise-to-pay history and decide credit action. |
Late Payment By Customer Type And Invoice Behavior
The best late-payment programs do not treat all customers the same. A loyal customer with one delayed approval, a new buyer requesting trade credit, a large account that routinely pays after 60 days, and a small customer who ignores reminders are four different situations. Statistics help, but customer behavior decides the response.
This is where invoice-level reporting becomes more useful than company-level averages. A business may have a manageable average days-late number while a handful of customers create most of the overdue value. Another business may have many customers paying a little late, which creates forecast uncertainty but not necessarily high write-off risk.
Customer segmentation signals
• A customer that pays 5 days late every month may be more predictable than a customer that alternates between on-time payment and 45 days late.
• A buyer responsible for more than 20% of overdue value deserves a specific account plan, even if the total overdue count is small.
• Customers with balances moving past 30+ days should be separated from customers whose invoices clear within the first week after due date.
• If the business has an average 10%30+ day overdue share, the next question is whether that share is concentrated by customer, salesperson, region, or service type.
• A large customer that pays after 80+ days may look attractive on revenue but weak on working-capital quality.
• Customers who dispute only after the due date should be reviewed for invoice clarity, acceptance evidence, and documented delivery milestones.
• A customer that responds quickly but pays slowly needs a different reminder than a customer that never responds at all.
• Repeat late customers should be reviewed before renewal, next shipment, or the next project milestone, not only after another invoice becomes overdue.
Segmentation readout Customer segmentation keeps the business from over-correcting. Some late payers need easier payment paths. Some need better invoice detail. Some need earlier reminders. Some need a credit hold. The data should help the company decide which group each customer belongs to.
Aging Buckets: From Reminder To Escalation
The most practical late-payment framework is an aging ladder. Each stage should change the message, the owner, and the risk decision. A pre-due confirmation is a service message. A due-date reminder is a convenience message. A 30+ day follow-up becomes an accountability message. A 60+ or 90+ day balance becomes a credit decision.
This staged approach fits the data because so much of the problem sits in and beyond the 30-day bucket. U.S. respondents report 47% exposure to invoices more than 30 days overdue, while U.K. respondents report 54%. If a business waits until that bucket is full before acting, it is already managing a backlog rather than preventing avoidable delay.
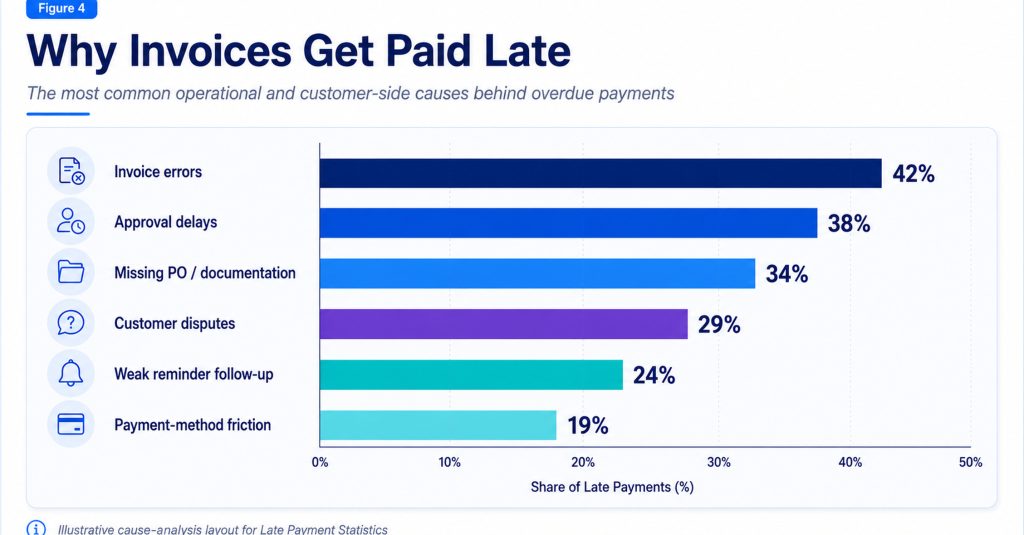
Figure 4. A late-payment workflow should change as the invoice ages, moving from receipt confirmation to documented escalation and credit-risk review.
Aging-stage decisions
• Before the due date, the reminder should confirm invoice receipt, customer contact, amount, due date, and payment route.
• On the due date, the message should make payment easy rather than sounding like escalation too early.
• At 7–14 days late, the business should ask for a payment date and identify whether a blocker exists.
• At 30+ days, the invoice should have an owner, a documented commitment, and a customer-history review.
• At 60+ days, future service, credit limits, partial payment, and senior contact should be on the table.
• At 90+ days, the business should review collections, write-off probability, customer status, and whether new work should continue.
• Accounts that move from 30+ to 60+ days despite reminders should not keep receiving the same message template.
• Aging rules are strongest when they include both timing and amount, because a $500 invoice and a $50,000 invoice do not carry the same cash risk.
| Aging stage | Primary question | Action to document |
|---|---|---|
| Pre-due | Has the customer received and approved the invoice? | Receipt confirmation, contact, PO match, payment route. |
| Due date | Can the customer pay quickly and easily? | Reminder with amount, due date, payment link or bank details. |
| 7–14 days late | Is there a blocker or simply inattention? | Payment date, approver name, dispute status. |
| 30+ days late | Is this now a cash-flow or credit concern? | Owner escalation and revised commitment. |
| 60–90+ days | Should service or credit continue? | Credit hold, collections review, or formal payment plan. |
Terms, Payment Options, And Prevention
Late-payment prevention begins before the invoice is due. Clear terms reduce ambiguity, payment links reduce friction, clean invoice data prevents dispute delays, and pre-due reminders make it easier to catch missing contacts or buyer approval issues early. The data does not point to one universal fix. It points to a coordinated system of terms, reminders, payment convenience, and credit rules.
Payment terms are especially important because they influence how much working capital the seller is financing. Businesses using longer terms report cash-flow problems at 60%, compared with 40% among firms using immediate terms. That does not mean every business should demand immediate payment, but it does mean long terms should be priced, monitored, and reviewed like a credit decision.
Prevention signals worth acting on
• A customer requesting longer terms should be reviewed against payment history, order size, margin, and concentration risk.
• Longer payment terms are associated with 60% cash-flow problem rates, so they should not be granted without understanding the working-capital cost.
• A business using 90-day terms and charging 40% of monthly expenses to credit cards may be financing customers indirectly.
• If the company’s 30+ day overdue share looks close to 10% or 11%, pre-due confirmation may be more valuable than another post-due reminder.
• Accounting software adoption is 56% among less affected businesses and 36% among heavily affected businesses, pointing to a visibility gap as well as a customer-payment gap.
• That 20 percentage point accounting-software difference does not prove software solves late payment, but it does suggest that stronger systems support earlier action.
• Payment links are most useful when they appear at the moment the customer is ready to pay, not buried in a separate email chain.
• Clear dispute instructions matter because a valid dispute should be separated from the undisputed balance before the entire invoice ages.
| Prevention lever | Metric to watch | Practical action |
|---|---|---|
| Cleaner invoice data | Corrections, rejected invoices, missing PO fields | Validate invoice fields before sending. |
| Pre-due confirmation | Receipt confirmation rate | Confirm invoice and payment route before due date. |
| Payment links | Payment completion after reminder | Reduce friction when the customer is ready to pay. |
| Term review | Cash-flow impact by term length | Shorten, price, or approve longer terms deliberately. |
| Credit control | Repeat 30/60/90+ behavior | Change limits or deposits for recurring slow payers. |
Automation, Visibility, And Reminder Quality
Automation can help, but only if the underlying process is sound. A reminder system that sends emails to the wrong contact, repeats vague wording, ignores dispute status, or fails to escalate repeat slow payers may make the process look organized while the cash position stays weak. The better question is whether automation shortens the path from invoice sent to payment commitment.
The technology data should be read as a maturity signal. Businesses less affected by late payments show higher adoption of accounting software at 56%, compared with 36% among heavily affected businesses. Business website adoption and cloud-services adoption also tend to be stronger among less affected firms. The point is not that any single tool prevents late payment. The point is that visibility, repeatable records, and easier payment paths make it harder for late invoices to disappear.
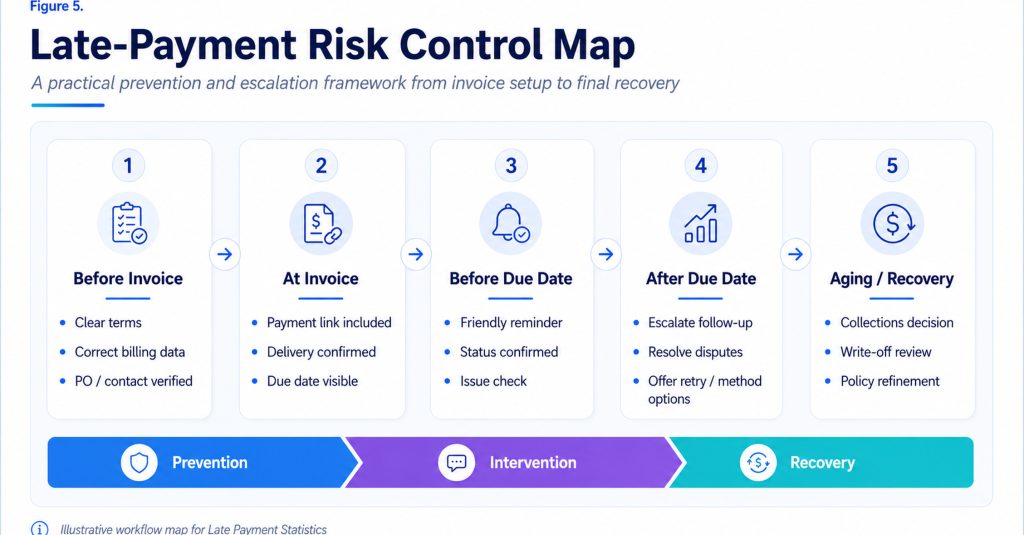
Figure 5. Late-payment pressure shows up in cash-flow problems, price increases, borrowing, credit-line use, and greater reliance on business credit cards.
Where automation should improve the process
• If an invoice becomes 30+ days overdue because it went to the wrong contact, automation should begin with contact accuracy.
• If customers pay but remittance data is missing, the bottleneck is cash application rather than payment willingness.
• If reminders keep firing after a customer has disputed an invoice, the automation is creating noise instead of clarity.
• If staff still spends 86 hours per affected business chasing, reminder automation should be judged by reduced manual work, not by message volume.
• Promise-to-pay tracking helps identify whether customers are actually committing or simply postponing the next conversation.
• Aging reports should show value as well as count, because one large invoice can create more pressure than dozens of small late balances.
• Automation should escalate accounts moving from 30+ to 60+ days rather than sending the same reminder at every stage.
• A late-payment dashboard should join invoice status, customer history, reminder history, dispute status, and payment method in one view.
Automation readout The best automation is not the loudest reminder sequence. It is the system that shows who owes money, why the invoice is late, what has already been promised, who owns the next step, and whether the delay is still recoverable. That is what turns late-payment management from chasing into control.
A 90-Day Late-Payment Improvement Plan
Late-payment improvement should be organized as a short operating cycle. The business needs a baseline, then a set of targeted fixes, then a review of which customers require changed terms or escalation. A 90-day cycle is long enough to observe payment behavior and short enough to stop overdue invoices from becoming normal.
The plan should not chase every invoice harder. It should separate preventable delay, customer process delay, repeat slow payment, dispute-driven delay, and credit-risk exposure. That keeps the company from damaging good relationships while still acting earlier on accounts that are clearly risky.
What to do in each phase
• During days 1–30, measure unpaid value, average days late, 30+ day exposure, chasing hours, customer concentration, and broken promise-to-pay dates.
• The baseline should show whether the business looks closer to the U.S. 56% unpaid-invoice pattern or the U.K. 62% pattern.
• During days 31–60, correct invoice fields, billing contacts, payment instructions, pre-due reminders, and reminder ownership.
• This middle phase should focus especially on accounts that repeatedly enter the 30+ day bucket.
• During days 61–90, review repeat slow payers for deposits, shorter terms, credit limits, service holds, or management escalation.
• Customers moving toward 60–90+ days should have documented decisions instead of another generic email.
• If longer terms are connected to 60% cash-flow problem rates, the business should review whether those terms still make commercial sense.
• If chasing time is approaching 86 hours per affected business, reducing manual follow-up should be part of the target outcome.
| Timing | Main focus | Output |
|---|---|---|
| Days 1–30 | Measure unpaid value, 30+ day aging, customer concentration, and chasing time | A baseline dashboard showing where late payment is concentrated. |
| Days 31–60 | Fix invoice details, payment routes, reminders, and customer contacts | A cleaner process that prevents avoidable delay. |
| Days 61–90 | Review repeat slow payers, terms, credit limits, and escalation rules | A customer-risk list and repeatable collections policy. |
How Leaders Should Use Late-Payment Data
Late-payment reporting becomes more valuable when leaders use it to make choices, not only to describe problems. A finance team may know that the company has overdue invoices, but the useful question is what should change because of that fact. Should terms be shortened for a specific customer group? Should payment links be added to reminder emails? Should the sales team stop promising new work to a customer with repeated 60+ day balances? Should forecasting assume that one region pays nearly 10 days late while another pays closer to 5 days late?
The most mature approach is to connect late-payment data to owners. AR may own reminders, but sales often owns customer relationships, operations may own delivery proof, finance owns cash forecasting, and leadership owns credit appetite. When these roles are separated, late payment can bounce between departments. When they are connected through a simple scorecard, the company can decide earlier whether a delay is service friction, buyer approval friction, cash-flow risk, or credit deterioration.
Leadership questions that make the data useful
• If unpaid invoice exposure is near 56% or 62% in the company’s peer group, leaders should ask whether their own unpaid share is better, worse, or simply unknown.
• If the average unpaid amount resembles $17,500 or £21,400, the finance team should translate that exposure into payroll days, supplier payments, or credit-line usage.
• If the business has a 30+ day overdue share near 10%, leadership should ask which customers create that bucket and whether it is growing.
• If average lateness is closer to 9.7 days than 4.5 days, cash forecasts should use that timing reality instead of assuming invoice due dates equal cash dates.
• If chasing consumes dozens of staff hours, the company should quantify what that time costs and what process changes would reduce it.
• If more affected firms show 30% increased credit-card reliance, late-payment data should be reviewed with borrowing and interest-cost reports.
• If regional bad-debt rates reach 8% in a comparison group, customer credit review should happen before overdue invoices become write-offs.
• If longer terms are linked with 60% cash-flow problem rates, leaders should review whether terms are being granted as strategy or as habit.
| Leader | What they should ask | Data to review |
|---|---|---|
| Owner or CEO | Is late payment changing what the business can afford to do? | Unpaid value, cash buffer, borrowing, payroll timing. |
| Finance lead | Which invoices are becoming credit risk? | 30/60/90+ aging, promise-to-pay history, bad-debt trend. |
| Sales lead | Which customers produce revenue but weaken cash quality? | Days late by account, overdue concentration, term exceptions. |
| Operations lead | Are delivery proof or acceptance records slowing payment? | Disputes, missing approvals, project completion evidence. |
| AR owner | Which reminder actions produce payment and which do not? | Reminder response, payment link conversion, escalation outcome. |
Leadership readout The strongest late-payment programs do not treat AR as the only owner. They connect customer selection, contract terms, invoice quality, reminder timing, and credit decisions. That is how the same statistics become practical: they guide who needs to act, what decision needs to change, and how soon the business should intervene before late payment becomes a financing problem.
Late Payment Metrics To Track
A late-payment scorecard should be clear enough to support decisions. Total overdue value matters, but it is not enough. The business also needs timing, customer concentration, aging movement, contact quality, credit exposure, and recovery probability. Those measures explain whether the problem is broad and mild, concentrated and severe, or caused by preventable process errors.
| Metric | Why it matters | Useful benchmark |
|---|---|---|
| Total unpaid invoice value | Shows how much expected cash is missing | Affected firms average $17,500 in the U.S. and £21,400 in the U.K. |
| 30+ day overdue share | Separates routine timing delay from aging risk | U.S. average is 10%; U.K. average is 11% among surveyed firms. |
| Average days late | Shows timing quality by market or customer group | Five-country averages range from 4.5 to 9.7 days late. |
| Cash-flow problem rate | Connects overdue invoices to operating impact | Higher-overdue U.S. firms report 50% cash-flow problems. |
| Chasing hours | Makes manual follow-up cost visible | Affected U.K. firms average 86 hours per year. |
| Credit reliance | Shows whether late invoices are being financed elsewhere | More affected firms show 30% increased credit-card reliance. |
| Bad-debt share | Separates recoverable aging from likely loss | Regional B2B bad debt ranges from 5% to 8%. |
| Repeat slow-payer count | Identifies customers needing term or credit review | Large-company watchlists include buyers paying after 80+ days. |
Metrics principle The goal is not a larger dashboard. The goal is a more decisive one. If the 30+ day bucket is growing, reminders may need to start earlier. If bad debt is rising, credit rules may need tightening. If chasing hours rise without faster recovery, the company likely needs better data, owner escalation, or customer segmentation.
Industry And Business-Model Differences
Late payment does not feel the same in every business model. A contractor may be waiting on a milestone invoice before buying materials for the next job. A wholesaler may carry a large receivable because a buyer’s approval cycle is slow. A professional-services firm may have mostly labor cost, so the unpaid invoice shows up directly as payroll pressure. A manufacturer may need to pay suppliers before a customer has paid the finished-goods invoice. The statistics give the scale, but the business model determines how quickly the delay becomes painful.
That is why late-payment reporting should not stop at the company average. A business with a 7.8-day average delay may still have one customer routinely paying 60+ days late. A firm with 10% of invoices in the 30+ day bucket may find that most of the exposure comes from one industry segment or one sales channel. A seller that accepts longer terms for large accounts may win revenue but quietly finance the buyer’s working capital.
Business-model signals to watch
• Project businesses should compare milestone due dates with payment timing because one unpaid milestone can delay labor, materials, or subcontractor scheduling.
• Wholesale and distribution firms should watch customer concentration because a single large buyer can create more risk than many small invoices paying a few days late.
• Professional-services firms should connect late payment to staffing because the main cost is often payroll, not inventory.
• Manufacturers should review supplier timing and customer timing together because raw materials may be paid before the customer invoice clears.
• Subscription or retainer businesses should separate failed recurring payment from late invoice payment because the response and recovery path differ.
• A company with 56% unpaid-invoice exposure in its market should not assume the problem is normal enough to ignore; it should compare its own unpaid share and aging trend.
• A customer paying after 80+ days may deserve different pricing, deposit terms, or service limits even when the total annual revenue looks attractive.
• Where 50% of higher-overdue firms report cash-flow problems, customer mix and payment timing should be part of sales-quality review.
• If longer terms are linked with 60% cash-flow problem rates, a sales team should not treat net terms as a harmless concession.
• A bad-debt range of 5% to 8% may look small next to overdue shares, but those losses are often concentrated enough to change profit on specific accounts.
| Business model | Late-payment risk | What to measure |
|---|---|---|
| Contractor or project work | Milestone payment delays can block the next job phase | Milestone invoice age, promise-to-pay date, materials exposure. |
| Wholesale or distribution | Large buyer balances can dominate overdue value | Customer concentration, credit limit, 30/60/90+ aging. |
| Professional services | Unpaid labor becomes payroll pressure quickly | Days late by client, disputed hours, retainer coverage. |
| Manufacturing | Supplier payments may precede customer collections | Input-cost timing, finished-goods invoice timing, term mismatch. |
| Subscription/service retainers | Failed or delayed renewal payment disrupts recurring cash | Failed payment rate, renewal date, automatic follow-up result. |
Business-model readout Late payment becomes easier to manage when the business asks where the delay hurts first. In one company it may be payroll, in another inventory, in another tax timing, and in another credit capacity. The same 30+ day invoice can carry very different operational consequences depending on margin, customer concentration, and cost timing.
Policy, Payment Terms, And Customer Conversations
A late-payment policy is not just a legal or accounting matter. It influences how a business communicates with clients before a project begins, what details are included in every invoice, when payment reminders are sent, who handles escalations, and whether future work continues after repeated delays. Using a clear seo invoice template can help businesses set payment expectations early, present terms professionally, and maintain consistency in follow-ups, reducing confusion and improving cash flow management.
The policy discussion matters because late payment is often normalized one exception at a time. A customer asks for longer terms. A salesperson agrees to protect the relationship. An invoice goes out with weak payment instructions. The first reminder waits until the invoice is already aged. By the time the account reaches 30+ days, the business is managing a problem that could have been clarified earlier.
Where policy should connect to the numbers
• Payment terms should be reviewed alongside the cash-flow gap between firms using longer terms and firms using immediate terms.
• When longer terms are associated with 60% cash-flow problem rates, a company should know which customers receive those terms and why.
• The gap between 60% under longer terms and 40% under immediate terms should be treated as a planning signal, not just a statistic.
• A business with many invoices more than 30 days overdue should consider whether reminders start too late, terms are too generous, or customers lack easy payment routes.
• Where U.K. firms report 86 hours spent chasing, a written reminder policy can save time by making the next step clear before staff improvise.
• If European late-payment difficulty affects 52% of companies, cross-border sellers should avoid assuming that one default payment term fits every market.
• A regional overdue range from 40% to 53% should influence how credit limits are set for new accounts.
• A customer with repeated 60+ day balances should trigger a commercial conversation, not only an AR message.
• If a buyer accounts for a large share of overdue value, the sales owner should be part of the conversation because the decision affects both revenue and cash quality.
• A business that changes terms after one late invoice may overreact, but a business that never changes terms after repeated late invoices is financing the customer by default.
| Policy question | Metric that should inform it | Decision it supports |
|---|---|---|
| Should this customer get longer terms? | Payment history, 30+ day pattern, margin, and concentration | Approve, shorten, price, or require deposit. |
| When should reminders begin? | Average days late, receipt confirmation, and first-response rate | Pre-due reminder, due-date reminder, or post-due escalation. |
| Who owns escalation? | Overdue value, customer importance, promise-to-pay failures | AR owner, account manager, finance lead, or management. |
| Should new work continue? | 60/90+ day aging, bad-debt risk, customer commitments | Continue, pause, credit hold, or formal plan. |
| Should policy differ by region? | Country days late, local payment norms, late-payment difficulty | Market-specific terms and reminder cadence. |
Customer conversations also need a different tone at different stages. A pre-due note can be helpful and service-oriented. A 7–14 day late note can ask for a payment date and identify blockers. A 30+ day message should become more specific about ownership and commitment. A 60+ or 90+ day account may require a management-level conversation about future work, credit limits, or a formal payment plan.
Policy readout A late-payment policy is useful only if it changes behavior. The strongest policies define terms before the sale, make payment easy on the invoice, start reminders before aging becomes serious, assign owners at 30+ days, and connect repeated slow payment to credit decisions. That turns policy from wording into operating control.
Practical Late-Payment Scenarios
Examples help translate the data into real decisions. The numbers do not mean every business should send harsher reminders or shorten every customer’s terms. They mean each business should know which late-payment pattern it is facing and respond in proportion to the risk.
A small contractor waiting on a $17,500 receivable may need that money to pay subcontractors and purchase materials. A professional-services agency with several invoices 30+ days late may need clearer acceptance proof and earlier client approval checks. A wholesaler with one large buyer paying after 80+ days may need a credit-limit conversation even if the buyer is important. A regional seller operating in countries where average lateness ranges from 4.5 to 9.7 days may need market-specific reminder timing.
How the same data changes by scenario
• For a contractor, the key metric may be unpaid value by project milestone rather than total overdue invoice count.
• For an agency, the key problem may be disputed scope or missing approval rather than the payment method itself.
• For a wholesaler, customer concentration can matter more than average days late because one account can dominate overdue value.
• For a manufacturer, late payment can create a timing gap between supplier obligations and customer collections.
• For a recurring-service business, the most useful metric may be failed payment recovery and renewal-date follow-up rather than traditional invoice chasing.
• A business with many small invoices late by 5 to 8 days may need automation and payment convenience more than credit tightening.
• A business with fewer invoices but repeated 60+ day balances may need credit review before it needs more reminder templates.
• A company seeing bad-debt exposure near 8% in a high-risk customer segment should reconsider terms before taking on more volume from similar buyers.
Late Payment Statistics FAQ
Common questions
• How common are late payments for small businesses? They are common enough to be a core cash-flow issue. QuickBooks reports that 56% of surveyed U.S. small businesses and 62% of surveyed U.K. small businesses are owed money from unpaid invoices.
• How much money is typically tied up in unpaid invoices? Among affected firms, the average unpaid amount is $17,500 in the U.S. and £21,400 in the U.K., which can be large enough to affect payroll, supplier payments, and borrowing.
• When does a late invoice become more serious? A useful threshold is the 30+ day aging bucket. In the U.S., 47% of surveyed businesses have invoices more than 30 days overdue; in the U.K., the comparable figure is 54%.
• Which countries show the highest average invoice lateness? In the five-country comparison, Canada is highest at 9.7 days late, followed by the U.K. at 8.0 days and the U.S. at 7.8 days.
• How much time do businesses spend chasing late payments? U.K. impact research estimates 86 hours per affected business per year, with a wider annual chasing burden of 133 million hours.
• Do late payments increase borrowing pressure? Yes. Businesses more affected by late payments show higher use of loans, credit lines, business credit cards, and increased credit-card reliance than less affected businesses.
• Are overdue invoices the same as bad debt? No. Overdue invoices may still be collected, while bad debt is expected loss. Regional B2B overdue shares range from 40% to 53%, while bad-debt shares range from 5% to 8%.
• What is the best way to reduce late-payment risk? Use a system: clear terms, clean invoice details, receipt confirmation, easy payment options, staged reminders, customer-level aging review, credit rules, and escalation before invoices reach 60 or 90 days late.
Final Takeaway
Late-payment statistics show that overdue invoices are not a minor administrative nuisance. They are a working-capital issue, a customer-risk signal, and a test of whether a business manages the full invoice-to-cash process well. When more than half of surveyed small businesses in both the U.S. and the U.K. are owed money from unpaid invoices, the problem has to be addressed before the due date, not only after a customer becomes overdue.
The most useful late-payment analysis breaks the problem into measurable parts. How much is unpaid? How much is more than 30 days overdue? Which customers repeat the pattern? How many hours are spent chasing? Which countries or regions pay slower? Is late payment increasing borrowing, credit-card reliance, or bad debt? Those questions turn late payment from a vague frustration into a management dashboard.
The most important shift is from reaction to design. A company that only reacts after the due date will always be working behind the problem. A company that designs payment terms, invoice data, reminder cadence, payment methods, and credit review together can identify risk earlier. If a customer always pays a few days late, the process can stay service-oriented. If the same customer repeatedly reaches 30+ or 60+ days, the response should become more specific, documented, and tied to future credit decisions.
For small businesses, the practical goal is not to chase every customer harder. It is to prevent avoidable delay, detect risk earlier, and escalate only when the data justifies it. Clear terms, clean invoice details, pre-due confirmation, payment links, customer segmentation, credit controls, and disciplined aging review all matter because late payment is rarely one problem. It is where customer behavior, invoice quality, payment friction, cash planning, and credit risk meet.
That is the practical standard for reading late-payment data: the numbers should not sit apart from business decisions. They should help owners and finance teams decide when to remind, when to escalate, when to change terms, and when to protect cash before another invoice quietly moves from late to risky.


